
Ambient Lighting Market Analysis, Size, and Forecast 2026-2030: North America (US, Canada, and Mexico), Europe (Germany, UK, and France), APAC (China, Japan, and India), Middle East and Africa (Saudi Arabia, UAE, and South Africa), South America (Brazil, Argentina, and Chile), and Rest of World (ROW)

Ambient Lighting Market Analysis, Size, and Forecast 2026-2030:
North America (US, Canada, and Mexico), Europe (Germany, UK, and France), APAC (China, Japan, and India), Middle East and Africa (Saudi Arabia, UAE, and South Africa), South America (Brazil, Argentina, and Chile), and Rest of World (ROW)

Published: Oct 2026 304 Pages SKU: IRTNTR73544

Market Overview at a Glance

$30.79 B
Market Opportunity
8.7%
CAGR 2025 - 2030
34.7%
North America Growth
$31.26 B
Lamps and luminaries segment 2024

Ambient Lighting Market Size 2026-2030

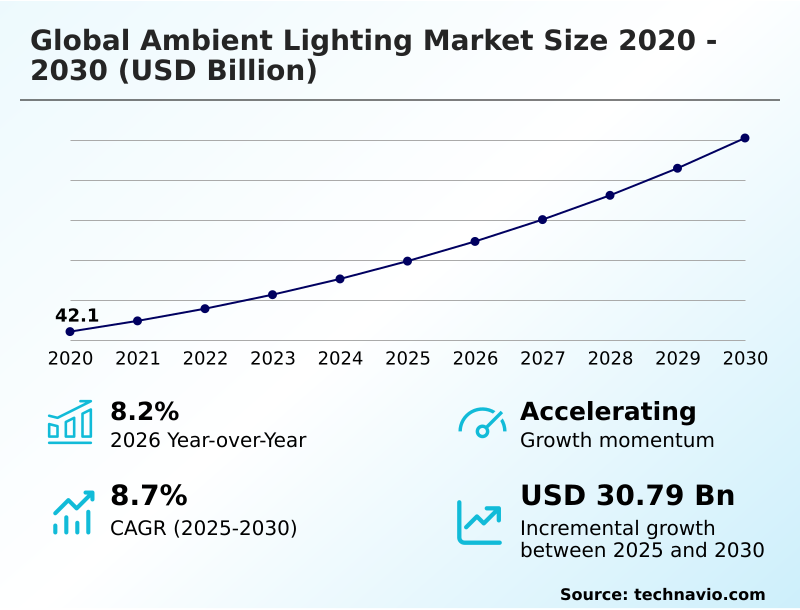
The ambient lighting market size is valued to increase by USD 30.79 billion, at a CAGR of 8.7% from 2025 to 2030. Proliferation of smart home ecosystems and IoT integration will drive the ambient lighting market.

Major Market Trends & Insights

  • North America dominated the market and accounted for a 34.7% growth during the forecast period.
  • By Product - Lamps and luminaries segment was valued at USD 31.26 billion in 2024
  • By End-user - Commercial segment accounted for the largest market revenue share in 2024

Market Size & Forecast

  • Market Opportunities: USD 48.40 billion
  • Market Future Opportunities: USD 30.79 billion
  • CAGR from 2025 to 2030 : 8.7%

Market Summary

  • The Ambient Lighting Market is undergoing a structural transformation driven by the integration of intelligent automation and advanced semiconductor technologies. Modern commercial and residential facilities increasingly deploy dynamic illumination networks to enhance visual ergonomics and optimize energy consumption.
  • In corporate real estate operations, facility managers utilize interconnected light-emitting diode systems integrated with occupancy sensors to automate daylight harvesting, successfully reducing electricity usage by 25% compared to legacy fluorescent setups. This operational shift is primarily propelled by the proliferation of smart building ecosystems, where seamless interoperability between disparate hardware components encourages large-scale retrofitting projects.
  • However, high initial capital expenditures and complex commissioning processes remain significant barriers, as retrofitting older structures often requires extensive architectural modifications that elevate total project costs by up to 15%. Despite these integration hurdles, the continuous refinement of wireless communication protocols allows businesses to deploy scalable, software-defined lighting infrastructure.
  • Consequently, intelligent illumination systems evolve beyond basic utility, functioning as active data-collecting nodes that improve overall building intelligence and support rigorous corporate sustainability frameworks.

What will be the Size of the Ambient Lighting Market during the forecast period?
Get Key Insights on Market Forecast (PDF) Get Free Sample

How is the Ambient Lighting Market Segmented?

The ambient lighting industry research report provides comprehensive data (region-wise segment analysis), with forecasts and estimates in "USD million" for the period 2026-2030, as well as historical data from 2020-2024 for the following segments.

  • Product
    • Lamps and luminaries
    • Lighting controls
    • Surface mounted lights
  • End-user
    • Commercial
    • Residential
    • Automotive
    • Industrial
  • Technology
    • LED
    • OLED
    • Conventional lighting
  • Connectivity
    • Wired
    • Wireless
  • Geography
    • North America
      • US
      • Canada
      • Mexico
    • Europe
      • Germany
      • UK
      • France
      • Italy
      • Spain
      • The Netherlands
    • APAC
      • China
      • Japan
      • India
      • South Korea
      • Australia
      • Indonesia
    • Middle East and Africa
      • Saudi Arabia
      • UAE
      • South Africa
      • Israel
      • Turkey
    • South America
      • Brazil
      • Argentina
      • Chile

By Product Insights

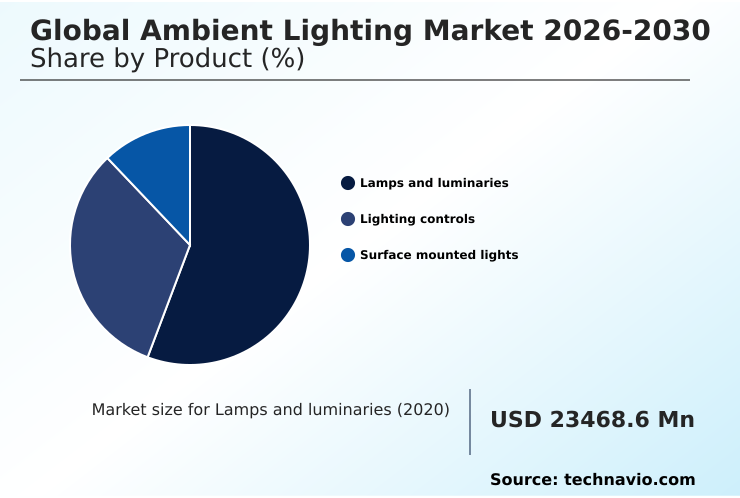
The lamps and luminaries segment is estimated to witness significant growth during the forecast period.

The hardware core of the illumination industry relies on advanced technological modules to deliver uniform background lighting across diverse commercial and residential facilities.

Facility managers increasingly prioritize networked luminaire modules and centralized lighting controllers to comply with strict commercial energy conservation mandates and secure sustainable building certifications.

By incorporating intelligent surface illumination and architectural daylighting integration, modern properties maximize natural light utilization, which directly improves energy efficiency by 22% in large-scale office complexes.

Furthermore, the deployment of adaptive software platforms allows operators to execute over-the-air firmware updates, minimizing system downtime and reducing maintenance interventions by 15%. Achieving high color rendering indices and human-centric wellness advantages requires seamless fixture integration within existing structural frameworks.

Consequently, these advanced hardware components transform static environments into responsive, data-driven ecosystems that optimize visual comfort and streamline long-term operational performance.
Get Free Sample

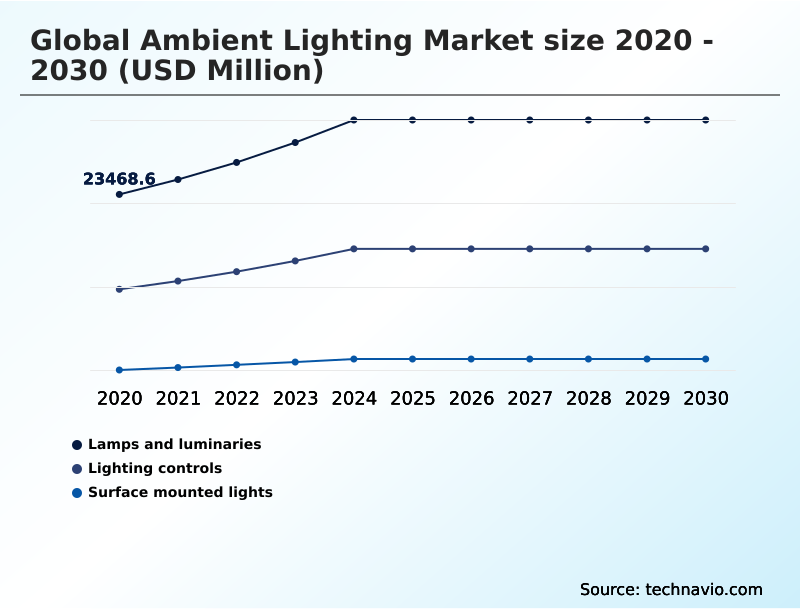
The Lamps and luminaries segment was valued at USD 31.26 billion in 2024 and showed a gradual increase during the forecast period.
Get Free Sample

Regional Analysis

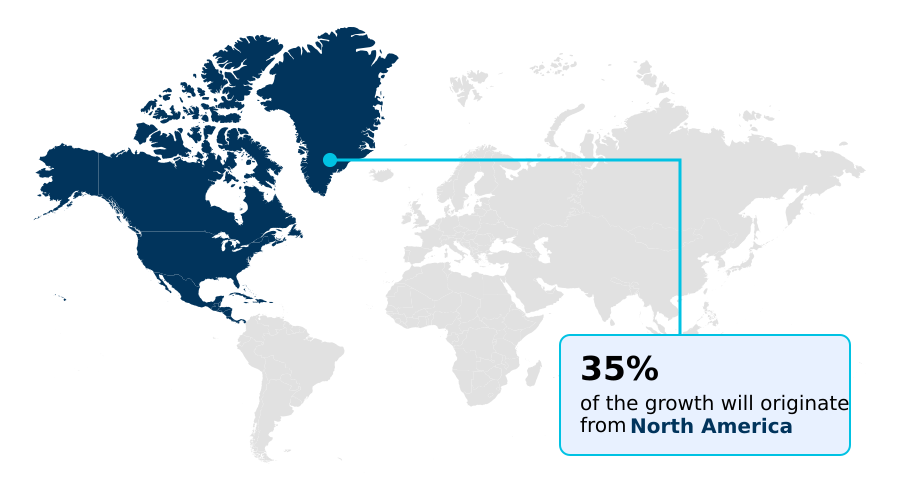
North America is estimated to contribute 34.7% to the growth of the global market during the forecast period.Technavio’s analysts have elaborately explained the regional trends and drivers that shape the market during the forecast period.
See How Ambient Lighting Market Demand is Rising in North America Get Free Sample

North America maintains a dominant position in the ambient lighting landscape due to early adoption of intelligent building automation and stringent energy efficiency mandates.

Commercial real estate developers in the United States deploy advanced light-emitting diode networks and organic light-emitting diodes to achieve superior interior spatial harmony and meet rigorous corporate sustainability frameworks.

In contrast, the APAC region exhibits faster adoption of smart residential ecosystems, driven by rapid urbanization and decreasing component costs.

North American facilities utilizing machine learning optimization and cloud-based mobile controllers report a 24% improvement in energy savings compared to conventional systems.

To support complex multi-zone lighting layouts, European contractors increasingly rely on multi-channel communication protocols that ensure secure data transmission.

Furthermore, the integration of high-performance optical design and directional ambient illumination enhances visual comfort across global markets, reducing operational overhead by 18% in modernized commercial properties.

Market Dynamics

Our researchers analyzed the data with 2025 as the base year, along with the key drivers, trends, and challenges. A holistic analysis of drivers will help companies refine their marketing strategies to gain a competitive advantage.

  • The structural evolution of the ambient illumination sector is heavily influenced by the demand for intelligent, data-driven infrastructure that enhances operational efficiency and occupant well-being. Commercial facility managers are actively integrating human-centric wellness advantages to align with rigorous corporate sustainability mandates, recognizing that optimized lighting environments directly support employee productivity and reduce workplace fatigue.
  • By continuously optimizing luminous efficacy optimization techniques, manufacturers provide advanced diode-based modules that deliver superior brightness while minimizing power consumption. This technological refinement allows supply chain operators to streamline inventory, reducing component replacement rates by 25% compared to traditional incandescent fixtures.
  • Furthermore, automating building automation platforms efficiently ensures that multi-zone lighting layouts respond instantly to occupancy metrics and natural daylight availability, significantly lowering utility overhead across expansive corporate campuses. To maintain optimal hardware performance, engineers focus on reducing thermal dissipation management costs, developing innovative heat sink materials that extend the operational lifespan of high-output luminaires.
  • This reliability is crucial for large-scale enterprise deployments where maintenance disruptions directly impact business continuity. Simultaneously, deploying software-defined lighting infrastructure empowers facility administrators to execute over-the-air firmware updates and adjust complex illumination scenes without requiring physical hardware modifications.
  • By transitioning toward interconnected, modular ecosystems, businesses achieve greater agility in their facility planning, ensuring that modern illumination networks remain adaptable, energy-efficient, and fully aligned with long-term strategic compliance goals.
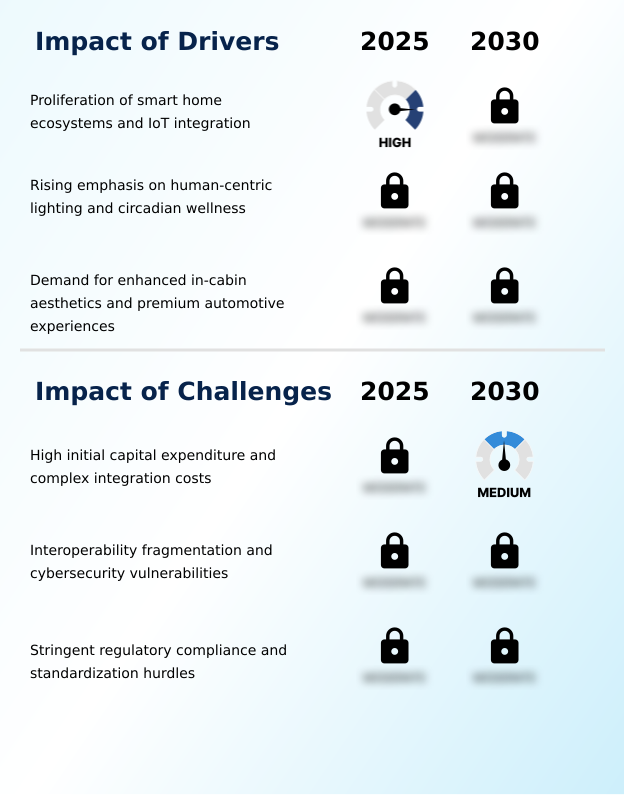
What are the key market drivers leading to the rise in the adoption of Ambient Lighting Industry?

  • The proliferation of smart home ecosystems and internet of things integration serves as a primary driver, accelerating the adoption of interconnected, highly customizable illumination networks.

  • The proliferation of internet of things architecture and advanced connectivity frameworks accelerates the mass deployment of intelligent illumination networks.
  • Commercial and residential developers increasingly rely on occupancy sensor integration and biophilic architectural illumination to establish environments that promote human-centric visual ergonomics.
  • This demand for dynamic control utilizes wireless communication protocols to process real-time environmental feedback, automatically adjusting automated lighting schedules without manual intervention.
  • By leveraging digital building management systems, facility managers deploy custom architectural fixtures that provide glare-free background illumination, successfully reducing energy waste by 25% in high-traffic areas.
  • Furthermore, the transition toward semiconductor-based illumination improves overall hardware longevity and decreases maintenance disruptions by 30%.
  • Because intelligent illumination adapts instantly to occupant behavior, building owners achieve substantial efficiency gains while simultaneously elevating the aesthetic and functional quality of modern interior spaces.

What are the market trends shaping the Ambient Lighting Industry?

  • The integration of artificial intelligence and adaptive software platforms represents a prominent trend shaping the industry landscape. This technological convergence enables intelligent, data-driven illumination systems that autonomously optimize energy consumption and enhance visual ergonomics.

  • The fusion of artificial intelligence and adaptive software platforms fundamentally shifts ambient lighting from static utility to active spatial intelligence. Modern commercial facilities actively deploy tunable white fixtures and circadian wellness illumination to enhance occupant productivity and reduce workplace fatigue.
  • This transition is propelled by the integration of smart dimming infrastructure and daylight harvesting sensors, ensuring continuous color temperature modulation based on environmental conditions. As smart building ecosystems mature, operators increasingly adopt energy-efficient retrofitting strategies that incorporate automated daylight harvesters, lowering electricity consumption by 22% in major office complexes.
  • Furthermore, cross-platform lighting interoperability allows seamless communication between legacy hardware and advanced algorithms, achieving superior luminous efficacy optimization. The rising demand for voice-activated residential automation also influences architectural designs, pushing developers to integrate intelligent illumination networks. Consequently, intelligent lighting ecosystems enhance visual comfort while lowering operational costs by 18% across diverse facility types.

What challenges does the Ambient Lighting Industry face during its growth?

  • High initial capital expenditures and complex integration requirements present significant challenges, often deterring budget-constrained enterprises from deploying advanced intelligent illumination systems.

  • High initial capital expenditures and complex integration hurdles significantly restrict the rapid adoption of advanced illumination systems across budget-constrained sectors. Upgrading legacy properties with software-defined lighting infrastructure requires substantial upfront investment in building automation platforms and specialized technical labor. While commercial clients value dynamic scene-setting and dynamic color tuning, achieving flawless wireless lighting interoperability often involves overcoming fragmented communication standards.
  • In the automotive sector, delivering premium automotive experiences through interior cabin customization demands sophisticated modular strip solutions and precise thermal dissipation management, elevating manufacturing costs by 15% per vehicle model. Furthermore, retrofitting older structures with recessed ceiling coves requires extensive architectural modifications, which can extend project timelines by up to 20%.
  • Without advanced software management to streamline the commissioning process, the complexity of configuring multi-zone intelligent networks continues to deter widespread implementation among small and medium-sized enterprises.

Exclusive Technavio Analysis on Customer Landscape

The ambient lighting market forecasting report includes the adoption lifecycle of the market, covering from the innovator’s stage to the laggard’s stage. It focuses on adoption rates in different regions based on penetration. Furthermore, the ambient lighting market report also includes key purchase criteria and drivers of price sensitivity to help companies evaluate and develop their market growth analysis strategies.
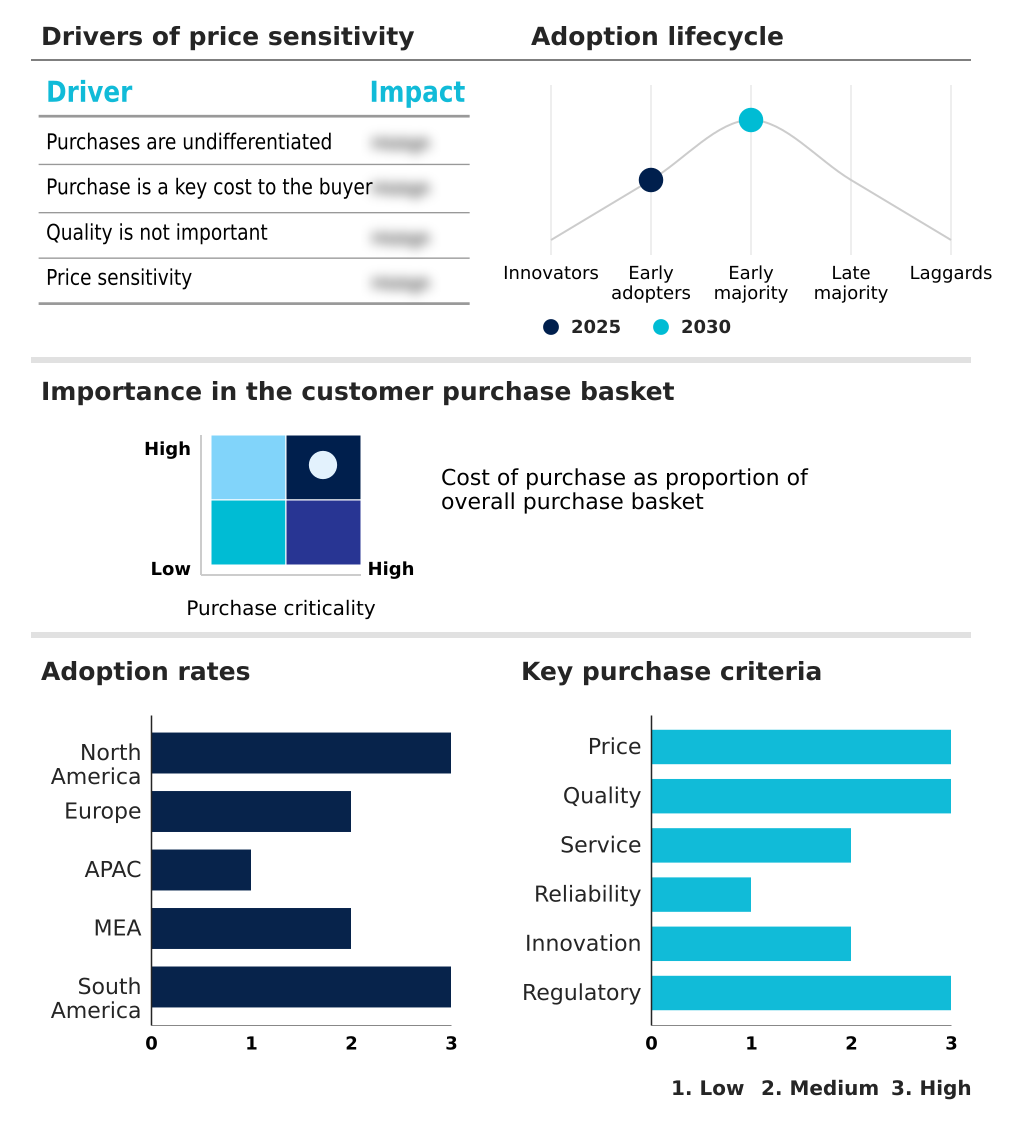
Customer Landscape of Ambient Lighting Industry

Competitive Landscape

Companies are implementing various strategies, such as strategic alliances, ambient lighting market forecast, partnerships, mergers and acquisitions, geographical expansion, and product/service launches, to enhance their presence in the industry.

Acuity Brands Inc. - The enterprise provides advanced illumination solutions, delivering intelligent light-emitting diode downlights and architectural fixtures that enhance spatial aesthetics and optimize energy efficiency across diverse commercial environments.

The industry research and growth report includes detailed analyses of the competitive landscape of the market and information about key companies, including:

  • Acuity Brands Inc.
  • ams OSRAM AG
  • Cooper Lighting LLC.
  • Cree Lighting
  • Current Lighting Solutions LLC
  • ERCO GmbH
  • Fagerhult Group AB
  • Fritz Draxlmaier GmbH and Co. KG
  • Grupo Antolin Irausa SA
  • HELLA GmbH and Co. KGaA
  • Herbert Waldmann GmbH
  • Koito Manufacturing Co. Ltd.
  • LSI Industries Inc.
  • Lutron Electronics Co. Inc.
  • Marelli Holdings Co. Ltd.
  • SCHOTT AG
  • Signify NV
  • Targetti Sankey S.r.l.
  • Valeo SA
  • Zumtobel Group AG

Qualitative and quantitative analysis of companies has been conducted to help clients understand the wider business environment as well as the strengths and weaknesses of key industry players. Data is qualitatively analyzed to categorize companies as pure play, category-focused, industry-focused, and diversified; it is quantitatively analyzed to categorize companies as dominant, leading, strong, tentative, and weak.

Recent Development and News in Ambient lighting market

  • In the Electrical Components and Equipment industry, the widespread implementation of the Matter smart home interoperability standard unified fragmented communication protocols, directly impacting Ambient Lighting demand by enabling seamless integration of diverse luminaire brands within centralized residential automation networks.
  • The enforcement of the European Union Restriction of Hazardous Substances directive phased out legacy fluorescent ballasts and halogen transformers, compelling commercial real estate operators to accelerate retrofitting projects utilizing highly efficient light-emitting diode networks.
  • Advancements in gallium nitride semiconductor manufacturing processes significantly reduced thermal dissipation in high-output power supplies, allowing engineers to design ultra-slim, miniaturized drivers that easily fit within complex architectural recessed ceiling coves.
  • The integration of Power over Ethernet technology in commercial building infrastructure eliminated the need for separate high-voltage wiring, lowering installation labor costs by 20% and driving the adoption of low-voltage networked luminaire modules in smart office environments.

Dive into Technavio’s robust research methodology, blending expert interviews, extensive data synthesis, and validated models for unparalleled Ambient Lighting Market insights. See full methodology.

Market Scope
Page number 304
Base year 2025
Historic period 2020-2024
Forecast period 2026-2030
Growth momentum & CAGR Accelerate at a CAGR of 8.7%
Market growth 2026-2030 USD 30788.1 million
Market structure Fragmented
YoY growth 2025-2026(%) 8.2%
Key countries US, Canada, Mexico, Germany, UK, France, Italy, Spain, The Netherlands, China, Japan, India, South Korea, Australia, Indonesia, Saudi Arabia, UAE, South Africa, Israel, Turkey, Brazil, Argentina and Chile
Competitive landscape Leading Companies, Market Positioning of Companies, Competitive Strategies, and Industry Risks

Request Free Sample

Research Analyst Overview

  • The Ambient Lighting landscape is experiencing a profound technological shift as enterprises transition from static illumination to highly responsive, data-driven ecosystems. Modern corporate facilities increasingly deploy tunable white fixtures and daylight harvesting sensors to optimize visual ergonomics and align with stringent environmental compliance mandates.
  • By implementing automated lighting schedules, facility managers can dynamically adjust interior luminosity based on real-time occupancy data, achieving a 24% reduction in energy waste compared to conventional manual systems. This strategic modernization directly influences budgeting decisions, as the long-term operational savings heavily outweigh the initial deployment expenses.
  • Furthermore, achieving flawless wireless lighting interoperability allows disparate hardware components to communicate securely, streamlining the commissioning process across sprawling office complexes. Advanced thermal dissipation management ensures the longevity of high-output luminaires integrated within complex recessed ceiling coves, minimizing maintenance disruptions. With the widespread adoption of cloud-based mobile controllers and centralized lighting controllers, administrators gain granular control over multi-zone environments.
  • Ultimately, these intelligent illumination networks function as critical infrastructure assets, driving measurable efficiency gains and supporting advanced corporate sustainability objectives.

What are the Key Data Covered in this Ambient Lighting Market Research and Growth Report?

  • What is the expected growth of the Ambient Lighting Market between 2026 and 2030?

    • USD 30.79 billion, at a CAGR of 8.7%

  • What segmentation does the market report cover?

    • The report is segmented by Product (Lamps and luminaries, Lighting controls, and Surface mounted lights), End-user (Commercial, Residential, Automotive, and Industrial), Technology (LED, OLED, and Conventional lighting), Connectivity (Wired, and Wireless) and Geography (North America, Europe, APAC, Middle East and Africa, South America)

  • Which regions are analyzed in the report?

    • North America, Europe, APAC, Middle East and Africa and South America

  • What are the key growth drivers and market challenges?

    • Proliferation of smart home ecosystems and IoT integration, High initial capital expenditure and complex integration costs

  • Who are the major players in the Ambient Lighting Market?

    • Acuity Brands Inc., ams OSRAM AG, Cooper Lighting LLC., Cree Lighting, Current Lighting Solutions LLC, ERCO GmbH, Fagerhult Group AB, Fritz Draxlmaier GmbH and Co. KG, Grupo Antolin Irausa SA, HELLA GmbH and Co. KGaA, Herbert Waldmann GmbH, Koito Manufacturing Co. Ltd., LSI Industries Inc., Lutron Electronics Co. Inc., Marelli Holdings Co. Ltd., SCHOTT AG, Signify NV, Targetti Sankey S.r.l., Valeo SA and Zumtobel Group AG

Market Research Insights

  • The Ambient Lighting Market rapidly evolves as commercial enterprises prioritize intelligent building automation to optimize operational efficiency. By deploying advanced software management systems, facility operators seamlessly integrate custom architectural fixtures that respond to real-time environmental feedback. This technological modernization allows corporate offices to achieve a 22% reduction in energy consumption compared to traditional static illumination.
  • Furthermore, the implementation of multi-channel communication protocols enhances network reliability, lowering maintenance disruptions by 18% across large-scale commercial complexes. As businesses strive to meet sustainable building certifications, the demand for dynamic color tuning and automated daylight harvesting continues to rise.
  • These interconnected ecosystems transform standard hardware into responsive assets, significantly improving visual comfort while driving measurable cost reductions in long-term facility management.

We can help! Our analysts can customize this ambient lighting market research report to meet your requirements.

Get in touch

1. Executive Summary

1.1 Market overview

Executive Summary - Chart on Market Overview
Executive Summary - Data Table on Market Overview
Executive Summary - Chart on Global Market Characteristics
Executive Summary - Chart on Market by Geography
Executive Summary - Chart on Market Segmentation by Product
Executive Summary - Chart on Market Segmentation by End-user
Executive Summary - Chart on Market Segmentation by Technology
Executive Summary - Chart on Market Segmentation by Connectivity
Executive Summary - Chart on Incremental Growth
Executive Summary - Data Table on Incremental Growth
Executive Summary - Chart on Company Market Positioning

2. Technavio Analysis

2.1 Analysis of price sensitivity, lifecycle, customer purchase basket, adoption rates, and purchase criteria

2.2 Criticality of inputs and Factors of differentiation

Chart on Overview on criticality of inputs and factors of differentiation

2.3 Factors of disruption

Chart on Overview on factors of disruption

2.4 Impact of drivers and challenges

Chart on Impact of drivers and challenges in 2025 and 2030

3. Market Landscape

3.1 Market ecosystem

Chart on Parent Market
Data Table on - Parent Market

3.2 Market characteristics

Chart on Market characteristics analysis

3.3 Value chain analysis

Chart on Value chain analysis

4. Market Sizing

4.1 Market definition

Data Table on Offerings of companies included in the market definition

4.2 Market segment analysis

Market segments

4.3 Market size 2025

4.4 Market outlook: Forecast for 2025-2030

Chart on Global - Market size and forecast 2025-2030 ($ million)
Data Table on Global - Market size and forecast 2025-2030 ($ million)
Chart on Global Market: Year-over-year growth 2025-2030 (%)
Data Table on Global Market: Year-over-year growth 2025-2030 (%)

5. Historic Market Size

5.1 Global Ambient Lighting Market 2020 - 2024

Historic Market Size - Data Table on Global Ambient Lighting Market 2020 - 2024 ($ million)

5.2 Product segment analysis 2020 - 2024

Historic Market Size - Product Segment 2020 - 2024 ($ million)

5.3 End-user segment analysis 2020 - 2024

Historic Market Size - End-user Segment 2020 - 2024 ($ million)

5.4 Technology segment analysis 2020 - 2024

Historic Market Size - Technology Segment 2020 - 2024 ($ million)

5.5 Connectivity segment analysis 2020 - 2024

Historic Market Size - Connectivity Segment 2020 - 2024 ($ million)

5.6 Geography segment analysis 2020 - 2024

Historic Market Size - Geography Segment 2020 - 2024 ($ million)

5.7 Country segment analysis 2020 - 2024

Historic Market Size - Country Segment 2020 - 2024 ($ million)

6. Qualitative Analysis

6.1 Impact of AI on global ambient lighting market

6.2 Impact of geopolitical conflicts on global ambient lighting market

7. Five Forces Analysis

7.1 Five forces summary

Five forces analysis - Comparison between 2025 and 2030

7.2 Bargaining power of buyers

Bargaining power of buyers - Impact of key factors 2025 and 2030

7.3 Bargaining power of suppliers

Bargaining power of suppliers - Impact of key factors in 2025 and 2030

7.4 Threat of new entrants

Threat of new entrants - Impact of key factors in 2025 and 2030

7.5 Threat of substitutes

Threat of substitutes - Impact of key factors in 2025 and 2030

7.6 Threat of rivalry

Threat of rivalry - Impact of key factors in 2025 and 2030

7.7 Market condition

Chart on Market condition - Five forces 2025 and 2030

8. Market Segmentation by Product

8.1 Market segments

Chart on Product - Market share 2025-2030 (%)
Data Table on Product - Market share 2025-2030 (%)

8.2 Comparison by Product

Chart on Comparison by Product
Data Table on Comparison by Product

8.3 Lamps and luminaries - Market size and forecast 2025-2030

Chart on Lamps and luminaries - Market size and forecast 2025-2030 ($ million)
Data Table on Lamps and luminaries - Market size and forecast 2025-2030 ($ million)
Chart on Lamps and luminaries - Year-over-year growth 2025-2030 (%)
Data Table on Lamps and luminaries - Year-over-year growth 2025-2030 (%)

8.4 Lighting controls - Market size and forecast 2025-2030

Chart on Lighting controls - Market size and forecast 2025-2030 ($ million)
Data Table on Lighting controls - Market size and forecast 2025-2030 ($ million)
Chart on Lighting controls - Year-over-year growth 2025-2030 (%)
Data Table on Lighting controls - Year-over-year growth 2025-2030 (%)

8.5 Surface mounted lights - Market size and forecast 2025-2030

Chart on Surface mounted lights - Market size and forecast 2025-2030 ($ million)
Data Table on Surface mounted lights - Market size and forecast 2025-2030 ($ million)
Chart on Surface mounted lights - Year-over-year growth 2025-2030 (%)
Data Table on Surface mounted lights - Year-over-year growth 2025-2030 (%)

8.6 Market opportunity by Product

Market opportunity by Product ($ million)
Data Table on Market opportunity by Product ($ million)

9. Market Segmentation by End-user

9.1 Market segments

Chart on End-user - Market share 2025-2030 (%)
Data Table on End-user - Market share 2025-2030 (%)

9.2 Comparison by End-user

Chart on Comparison by End-user
Data Table on Comparison by End-user

9.3 Commercial - Market size and forecast 2025-2030

Chart on Commercial - Market size and forecast 2025-2030 ($ million)
Data Table on Commercial - Market size and forecast 2025-2030 ($ million)
Chart on Commercial - Year-over-year growth 2025-2030 (%)
Data Table on Commercial - Year-over-year growth 2025-2030 (%)

9.4 Residential - Market size and forecast 2025-2030

Chart on Residential - Market size and forecast 2025-2030 ($ million)
Data Table on Residential - Market size and forecast 2025-2030 ($ million)
Chart on Residential - Year-over-year growth 2025-2030 (%)
Data Table on Residential - Year-over-year growth 2025-2030 (%)

9.5 Automotive - Market size and forecast 2025-2030

Chart on Automotive - Market size and forecast 2025-2030 ($ million)
Data Table on Automotive - Market size and forecast 2025-2030 ($ million)
Chart on Automotive - Year-over-year growth 2025-2030 (%)
Data Table on Automotive - Year-over-year growth 2025-2030 (%)

9.6 Industrial - Market size and forecast 2025-2030

Chart on Industrial - Market size and forecast 2025-2030 ($ million)
Data Table on Industrial - Market size and forecast 2025-2030 ($ million)
Chart on Industrial - Year-over-year growth 2025-2030 (%)
Data Table on Industrial - Year-over-year growth 2025-2030 (%)

9.7 Market opportunity by End-user

Market opportunity by End-user ($ million)
Data Table on Market opportunity by End-user ($ million)

10. Market Segmentation by Technology

10.1 Market segments

Chart on Technology - Market share 2025-2030 (%)
Data Table on Technology - Market share 2025-2030 (%)

10.2 Comparison by Technology

Chart on Comparison by Technology
Data Table on Comparison by Technology

10.3 LED - Market size and forecast 2025-2030

Chart on LED - Market size and forecast 2025-2030 ($ million)
Data Table on LED - Market size and forecast 2025-2030 ($ million)
Chart on LED - Year-over-year growth 2025-2030 (%)
Data Table on LED - Year-over-year growth 2025-2030 (%)

10.4 OLED - Market size and forecast 2025-2030

Chart on OLED - Market size and forecast 2025-2030 ($ million)
Data Table on OLED - Market size and forecast 2025-2030 ($ million)
Chart on OLED - Year-over-year growth 2025-2030 (%)
Data Table on OLED - Year-over-year growth 2025-2030 (%)

10.5 Conventional lighting - Market size and forecast 2025-2030

Chart on Conventional lighting - Market size and forecast 2025-2030 ($ million)
Data Table on Conventional lighting - Market size and forecast 2025-2030 ($ million)
Chart on Conventional lighting - Year-over-year growth 2025-2030 (%)
Data Table on Conventional lighting - Year-over-year growth 2025-2030 (%)

10.6 Market opportunity by Technology

Market opportunity by Technology ($ million)
Data Table on Market opportunity by Technology ($ million)

11. Market Segmentation by Connectivity

11.1 Market segments

Chart on Connectivity - Market share 2025-2030 (%)
Data Table on Connectivity - Market share 2025-2030 (%)

11.2 Comparison by Connectivity

Chart on Comparison by Connectivity
Data Table on Comparison by Connectivity

11.3 Wired - Market size and forecast 2025-2030

Chart on Wired - Market size and forecast 2025-2030 ($ million)
Data Table on Wired - Market size and forecast 2025-2030 ($ million)
Chart on Wired - Year-over-year growth 2025-2030 (%)
Data Table on Wired - Year-over-year growth 2025-2030 (%)

11.4 Wireless - Market size and forecast 2025-2030

Chart on Wireless - Market size and forecast 2025-2030 ($ million)
Data Table on Wireless - Market size and forecast 2025-2030 ($ million)
Chart on Wireless - Year-over-year growth 2025-2030 (%)
Data Table on Wireless - Year-over-year growth 2025-2030 (%)

11.5 Market opportunity by Connectivity

Market opportunity by Connectivity ($ million)
Data Table on Market opportunity by Connectivity ($ million)

12. Customer Landscape

12.1 Customer landscape overview

Analysis of price sensitivity, lifecycle, customer purchase basket, adoption rates, and purchase criteria

13. Geographic Landscape

13.1 Geographic segmentation

Chart on Market share by geography 2025-2030 (%)
Data Table on Market share by geography 2025-2030 (%)

13.2 Geographic comparison

Chart on Geographic comparison
Data Table on Geographic comparison

13.3 North America - Market size and forecast 2025-2030

Chart on North America - Market size and forecast 2025-2030 ($ million)
Data Table on North America - Market size and forecast 2025-2030 ($ million)
Chart on North America - Year-over-year growth 2025-2030 (%)
Data Table on North America - Year-over-year growth 2025-2030 (%)
Chart on Regional Comparison - North America
Data Table on Regional Comparison - North America

13.3.1 US - Market size and forecast 2025-2030

Chart on US - Market size and forecast 2025-2030 ($ million)
Data Table on US - Market size and forecast 2025-2030 ($ million)
Chart on US - Year-over-year growth 2025-2030 (%)
Data Table on US - Year-over-year growth 2025-2030 (%)

13.3.2 Canada - Market size and forecast 2025-2030

Chart on Canada - Market size and forecast 2025-2030 ($ million)
Data Table on Canada - Market size and forecast 2025-2030 ($ million)
Chart on Canada - Year-over-year growth 2025-2030 (%)
Data Table on Canada - Year-over-year growth 2025-2030 (%)

13.3.3 Mexico - Market size and forecast 2025-2030

Chart on Mexico - Market size and forecast 2025-2030 ($ million)
Data Table on Mexico - Market size and forecast 2025-2030 ($ million)
Chart on Mexico - Year-over-year growth 2025-2030 (%)
Data Table on Mexico - Year-over-year growth 2025-2030 (%)

13.4 Europe - Market size and forecast 2025-2030

Chart on Europe - Market size and forecast 2025-2030 ($ million)
Data Table on Europe - Market size and forecast 2025-2030 ($ million)
Chart on Europe - Year-over-year growth 2025-2030 (%)
Data Table on Europe - Year-over-year growth 2025-2030 (%)
Chart on Regional Comparison - Europe
Data Table on Regional Comparison - Europe

13.4.1 Germany - Market size and forecast 2025-2030

Chart on Germany - Market size and forecast 2025-2030 ($ million)
Data Table on Germany - Market size and forecast 2025-2030 ($ million)
Chart on Germany - Year-over-year growth 2025-2030 (%)
Data Table on Germany - Year-over-year growth 2025-2030 (%)

13.4.2 UK - Market size and forecast 2025-2030

Chart on UK - Market size and forecast 2025-2030 ($ million)
Data Table on UK - Market size and forecast 2025-2030 ($ million)
Chart on UK - Year-over-year growth 2025-2030 (%)
Data Table on UK - Year-over-year growth 2025-2030 (%)

13.4.3 France - Market size and forecast 2025-2030

Chart on France - Market size and forecast 2025-2030 ($ million)
Data Table on France - Market size and forecast 2025-2030 ($ million)
Chart on France - Year-over-year growth 2025-2030 (%)
Data Table on France - Year-over-year growth 2025-2030 (%)

13.4.4 Italy - Market size and forecast 2025-2030

Chart on Italy - Market size and forecast 2025-2030 ($ million)
Data Table on Italy - Market size and forecast 2025-2030 ($ million)
Chart on Italy - Year-over-year growth 2025-2030 (%)
Data Table on Italy - Year-over-year growth 2025-2030 (%)

13.4.5 Spain - Market size and forecast 2025-2030

Chart on Spain - Market size and forecast 2025-2030 ($ million)
Data Table on Spain - Market size and forecast 2025-2030 ($ million)
Chart on Spain - Year-over-year growth 2025-2030 (%)
Data Table on Spain - Year-over-year growth 2025-2030 (%)

13.4.6 The Netherlands - Market size and forecast 2025-2030

Chart on The Netherlands - Market size and forecast 2025-2030 ($ million)
Data Table on The Netherlands - Market size and forecast 2025-2030 ($ million)
Chart on The Netherlands - Year-over-year growth 2025-2030 (%)
Data Table on The Netherlands - Year-over-year growth 2025-2030 (%)

13.5 APAC - Market size and forecast 2025-2030

Chart on APAC - Market size and forecast 2025-2030 ($ million)
Data Table on APAC - Market size and forecast 2025-2030 ($ million)
Chart on APAC - Year-over-year growth 2025-2030 (%)
Data Table on APAC - Year-over-year growth 2025-2030 (%)
Chart on Regional Comparison - APAC
Data Table on Regional Comparison - APAC

13.5.1 China - Market size and forecast 2025-2030

Chart on China - Market size and forecast 2025-2030 ($ million)
Data Table on China - Market size and forecast 2025-2030 ($ million)
Chart on China - Year-over-year growth 2025-2030 (%)
Data Table on China - Year-over-year growth 2025-2030 (%)

13.5.2 Japan - Market size and forecast 2025-2030

Chart on Japan - Market size and forecast 2025-2030 ($ million)
Data Table on Japan - Market size and forecast 2025-2030 ($ million)
Chart on Japan - Year-over-year growth 2025-2030 (%)
Data Table on Japan - Year-over-year growth 2025-2030 (%)

13.5.3 India - Market size and forecast 2025-2030

Chart on India - Market size and forecast 2025-2030 ($ million)
Data Table on India - Market size and forecast 2025-2030 ($ million)
Chart on India - Year-over-year growth 2025-2030 (%)
Data Table on India - Year-over-year growth 2025-2030 (%)

13.5.4 South Korea - Market size and forecast 2025-2030

Chart on South Korea - Market size and forecast 2025-2030 ($ million)
Data Table on South Korea - Market size and forecast 2025-2030 ($ million)
Chart on South Korea - Year-over-year growth 2025-2030 (%)
Data Table on South Korea - Year-over-year growth 2025-2030 (%)

13.5.5 Australia - Market size and forecast 2025-2030

Chart on Australia - Market size and forecast 2025-2030 ($ million)
Data Table on Australia - Market size and forecast 2025-2030 ($ million)
Chart on Australia - Year-over-year growth 2025-2030 (%)
Data Table on Australia - Year-over-year growth 2025-2030 (%)

13.5.6 Indonesia - Market size and forecast 2025-2030

Chart on Indonesia - Market size and forecast 2025-2030 ($ million)
Data Table on Indonesia - Market size and forecast 2025-2030 ($ million)
Chart on Indonesia - Year-over-year growth 2025-2030 (%)
Data Table on Indonesia - Year-over-year growth 2025-2030 (%)

13.6 Middle East and Africa - Market size and forecast 2025-2030

Chart on Middle East and Africa - Market size and forecast 2025-2030 ($ million)
Data Table on Middle East and Africa - Market size and forecast 2025-2030 ($ million)
Chart on Middle East and Africa - Year-over-year growth 2025-2030 (%)
Data Table on Middle East and Africa - Year-over-year growth 2025-2030 (%)
Chart on Regional Comparison - Middle East and Africa
Data Table on Regional Comparison - Middle East and Africa

13.6.1 Saudi Arabia - Market size and forecast 2025-2030

Chart on Saudi Arabia - Market size and forecast 2025-2030 ($ million)
Data Table on Saudi Arabia - Market size and forecast 2025-2030 ($ million)
Chart on Saudi Arabia - Year-over-year growth 2025-2030 (%)
Data Table on Saudi Arabia - Year-over-year growth 2025-2030 (%)

13.6.2 UAE - Market size and forecast 2025-2030

Chart on UAE - Market size and forecast 2025-2030 ($ million)
Data Table on UAE - Market size and forecast 2025-2030 ($ million)
Chart on UAE - Year-over-year growth 2025-2030 (%)
Data Table on UAE - Year-over-year growth 2025-2030 (%)

13.6.3 South Africa - Market size and forecast 2025-2030

Chart on South Africa - Market size and forecast 2025-2030 ($ million)
Data Table on South Africa - Market size and forecast 2025-2030 ($ million)
Chart on South Africa - Year-over-year growth 2025-2030 (%)
Data Table on South Africa - Year-over-year growth 2025-2030 (%)

13.6.4 Israel - Market size and forecast 2025-2030

Chart on Israel - Market size and forecast 2025-2030 ($ million)
Data Table on Israel - Market size and forecast 2025-2030 ($ million)
Chart on Israel - Year-over-year growth 2025-2030 (%)
Data Table on Israel - Year-over-year growth 2025-2030 (%)

13.6.5 Turkey - Market size and forecast 2025-2030

Chart on Turkey - Market size and forecast 2025-2030 ($ million)
Data Table on Turkey - Market size and forecast 2025-2030 ($ million)
Chart on Turkey - Year-over-year growth 2025-2030 (%)
Data Table on Turkey - Year-over-year growth 2025-2030 (%)

13.7 South America - Market size and forecast 2025-2030

Chart on South America - Market size and forecast 2025-2030 ($ million)
Data Table on South America - Market size and forecast 2025-2030 ($ million)
Chart on South America - Year-over-year growth 2025-2030 (%)
Data Table on South America - Year-over-year growth 2025-2030 (%)
Chart on Regional Comparison - South America
Data Table on Regional Comparison - South America

13.7.1 Brazil - Market size and forecast 2025-2030

Chart on Brazil - Market size and forecast 2025-2030 ($ million)
Data Table on Brazil - Market size and forecast 2025-2030 ($ million)
Chart on Brazil - Year-over-year growth 2025-2030 (%)
Data Table on Brazil - Year-over-year growth 2025-2030 (%)

13.7.2 Argentina - Market size and forecast 2025-2030

Chart on Argentina - Market size and forecast 2025-2030 ($ million)
Data Table on Argentina - Market size and forecast 2025-2030 ($ million)
Chart on Argentina - Year-over-year growth 2025-2030 (%)
Data Table on Argentina - Year-over-year growth 2025-2030 (%)

13.7.3 Chile - Market size and forecast 2025-2030

Chart on Chile - Market size and forecast 2025-2030 ($ million)
Data Table on Chile - Market size and forecast 2025-2030 ($ million)
Chart on Chile - Year-over-year growth 2025-2030 (%)
Data Table on Chile - Year-over-year growth 2025-2030 (%)

13.8 Market opportunity by geography

Market opportunity by geography ($ million)
Data Tables on Market opportunity by geography ($ million)

14. Drivers, Challenges, and Opportunity

14.1 Market drivers

Proliferation of smart home ecosystems and IoT integration
Rising emphasis on human-centric lighting and circadian wellness
Demand for enhanced in-cabin aesthetics and premium automotive experiences

14.2 Market challenges

High initial capital expenditure and complex integration costs
Interoperability fragmentation and cybersecurity vulnerabilities
Stringent regulatory compliance and standardization hurdles

14.3 Impact of drivers and challenges

Impact of drivers and challenges in 2025 and 2030

14.4 Market opportunities

Integration of AI and adaptive software platforms
Ascendance of biophilic design and circadian wellness architecture
Proliferation of LED retrofitting and modular strip solutions

15. Competitive Landscape

15.1 Overview

15.2

Overview on criticality of inputs and factors of differentiation

15.3 Landscape disruption

Overview on factors of disruption

15.4 Industry risks

Impact of key risks on business

16. Competitive Analysis

16.1 Companies profiled

Companies covered

16.2 Company ranking index

16.3 Market positioning of companies

Matrix on companies position and classification

16.4 Acuity Brands Inc.

Acuity Brands Inc. - Overview
Acuity Brands Inc. - Business segments
Acuity Brands Inc. - Key offerings
Acuity Brands Inc. - Segment focus
SWOT

16.5 ams OSRAM AG

ams OSRAM AG - Overview
ams OSRAM AG - Business segments
ams OSRAM AG - Key offerings
ams OSRAM AG - Segment focus
SWOT

16.6 Cooper Lighting LLC.

Cooper Lighting LLC. - Overview
Cooper Lighting LLC. - Product / Service
Cooper Lighting LLC. - Key offerings
SWOT

16.7 Cree Lighting

Cree Lighting - Overview
Cree Lighting - Product / Service
Cree Lighting - Key offerings
SWOT

16.8 Current Lighting Solutions LLC

Current Lighting Solutions LLC - Overview
Current Lighting Solutions LLC - Product / Service
Current Lighting Solutions LLC - Key offerings
SWOT

16.9 ERCO GmbH

ERCO GmbH - Overview
ERCO GmbH - Product / Service
ERCO GmbH - Key offerings
SWOT

16.10 Fagerhult Group AB

Fagerhult Group AB - Overview
Fagerhult Group AB - Product / Service
Fagerhult Group AB - Key offerings
SWOT

16.11 Fritz Draxlmaier GmbH and Co. KG

Fritz Draxlmaier GmbH and Co. KG - Overview
Fritz Draxlmaier GmbH and Co. KG - Product / Service
Fritz Draxlmaier GmbH and Co. KG - Key offerings
SWOT

16.12 Grupo Antolin Irausa SA

Grupo Antolin Irausa SA - Overview
Grupo Antolin Irausa SA - Product / Service
Grupo Antolin Irausa SA - Key offerings
SWOT

16.13 HELLA GmbH and Co. KGaA

HELLA GmbH and Co. KGaA - Overview
HELLA GmbH and Co. KGaA - Business segments
HELLA GmbH and Co. KGaA - Key offerings
HELLA GmbH and Co. KGaA - Segment focus
SWOT

16.14 Koito Manufacturing Co. Ltd.

Koito Manufacturing Co. Ltd. - Overview
Koito Manufacturing Co. Ltd. - Business segments
Koito Manufacturing Co. Ltd. - Key offerings
Koito Manufacturing Co. Ltd. - Segment focus
SWOT

16.15 LSI Industries Inc.

LSI Industries Inc. - Overview
LSI Industries Inc. - Business segments
LSI Industries Inc. - Key offerings
LSI Industries Inc. - Segment focus
SWOT

16.16 Lutron Electronics Co. Inc.

Lutron Electronics Co. Inc. - Overview
Lutron Electronics Co. Inc. - Product / Service
Lutron Electronics Co. Inc. - Key offerings
SWOT

16.17 Marelli Holdings Co. Ltd.

Marelli Holdings Co. Ltd. - Overview
Marelli Holdings Co. Ltd. - Product / Service
Marelli Holdings Co. Ltd. - Key offerings
SWOT

16.18 SCHOTT AG

SCHOTT AG - Overview
SCHOTT AG - Product / Service
SCHOTT AG - Key offerings
SWOT

17. Appendix

17.1 Scope of the report

Market definition
Objectives
Notes and caveats

17.2 Inclusions and exclusions checklist

Inclusions checklist
Exclusions checklist

17.3 Currency conversion rates for US$

17.4 Research methodology

17.5 Data procurement

Information sources

17.6 Data validation

17.7 Validation techniques employed for market sizing

17.8 Data synthesis

17.9 360 degree market analysis

17.10 List of abbreviations

Research Methodology

Technavio presents a detailed picture of the market by way of study, synthesis, and summation of data from multiple sources. The analysts have presented the various facets of the market with a particular focus on identifying the key industry influencers. The data thus presented is comprehensive, reliable, and the result of extensive research, both primary and secondary.

INFORMATION SOURCES

Primary sources

  • Manufacturers and suppliers
  • Channel partners
  • Industry experts
  • Strategic decision makers

Secondary sources

  • Industry journals and periodicals
  • Government data
  • Financial reports of key industry players
  • Historical data
  • Press releases

DATA ANALYSIS

Data Synthesis

  • Collation of data
  • Estimation of key figures
  • Analysis of derived insights

Data Validation

  • Triangulation with data models
  • Reference against proprietary databases
  • Corroboration with industry experts

REPORT WRITING

Qualitative

  • Market drivers
  • Market challenges
  • Market trends
  • Five forces analysis

Quantitative

  • Market size and forecast
  • Market segmentation
  • Geographical insights
  • Competitive landscape

Interested in this report?

Get your sample now to see our research methodology and insights!

Download Now

Frequently Asked Questions

Ambient Lighting market growth will increase by USD 30788.1 million during 2026-2030.

The Ambient Lighting market is expected to grow at a CAGR of 8.7% during 2026-2030.

Ambient Lighting market is segmented by Product (Lamps and luminaries, Lighting controls, Surface mounted lights) End-user (Commercial, Residential, Automotive, Industrial) Technology (LED, OLED, Conventional lighting) Connectivity (Wired, Wireless)

Acuity Brands Inc., ams OSRAM AG, Cooper Lighting LLC., Cree Lighting, Current Lighting Solutions LLC, ERCO GmbH, Fagerhult Group AB, Fritz Draxlmaier GmbH and Co. KG, Grupo Antolin Irausa SA, HELLA GmbH and Co. KGaA, Herbert Waldmann GmbH, Koito Manufacturing Co. Ltd., LSI Industries Inc., Lutron Electronics Co. Inc., Marelli Holdings Co. Ltd., SCHOTT AG, Signify NV, Targetti Sankey S.r.l., Valeo SA, Zumtobel Group AG are a few of the key vendors in the Ambient Lighting market.

North America will register the highest growth rate of 34.7% among the other regions. Therefore, the Ambient Lighting market in North America is expected to garner significant business opportunities for the vendors during the forecast period.

US, Canada, Mexico, Germany, UK, France, Italy, Spain, The Netherlands, China, Japan, India, South Korea, Australia, Indonesia, Saudi Arabia, UAE, South Africa, Israel, Turkey, Brazil, Argentina, Chile

  • Proliferation of smart home ecosystems and IoT integration is the driving factor this market.

The Ambient Lighting market vendors should focus on grabbing business opportunities from the Product segment as it accounted for the largest market share in the base year.
RIA - Research AI Assistant
Ask RIA
