Animal Growth Promoters Market Analysis, Size, and Forecast 2025-2029: APAC (China, India, and Japan), North America (US, Canada, and Mexico), Europe (Germany, UK, and France), South America (Brazil and Argentina), Middle East and Africa (South Africa, Saudi Arabia, and UAE), and Rest of World (ROW)

Animal Growth Promoters Market Analysis, Size, and Forecast 2025-2029:
APAC (China, India, and Japan), North America (US, Canada, and Mexico), Europe (Germany, UK, and France), South America (Brazil and Argentina), Middle East and Africa (South Africa, Saudi Arabia, and UAE), and Rest of World (ROW)

Published: Dec 2025 291 Pages SKU: IRTNTR74168

Market Overview at a Glance

$6.80 B
Market Opportunity
7.6%
CAGR 2024 - 2029
61.5%
APAC Growth
$7.18 B
Poultry segment 2023

Animal Growth Promoters Market Size 2025-2029

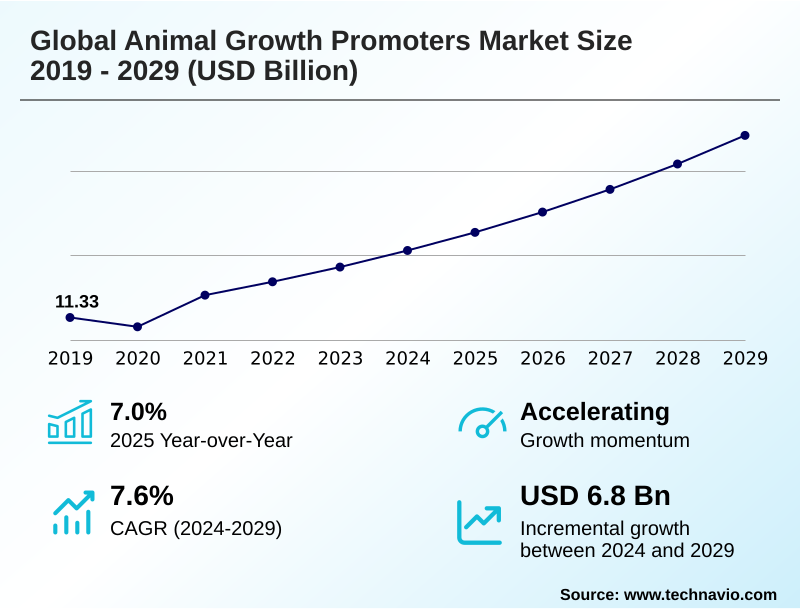
The animal growth promoters market size is valued to increase by USD 6.80 billion, at a CAGR of 7.6% from 2024 to 2029. Heightened global demand for animal-derived protein will drive the animal growth promoters market.

Major Market Trends & Insights

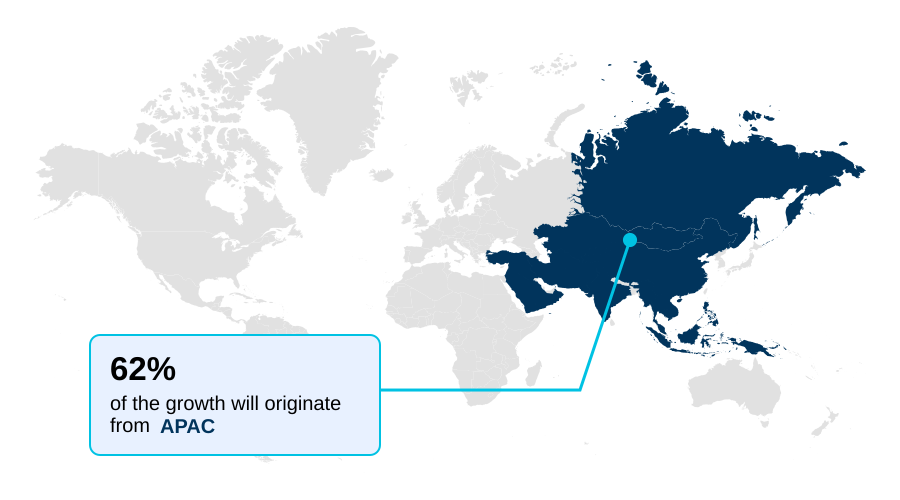
  • APAC dominated the market and accounted for a 61.5% growth during the forecast period.
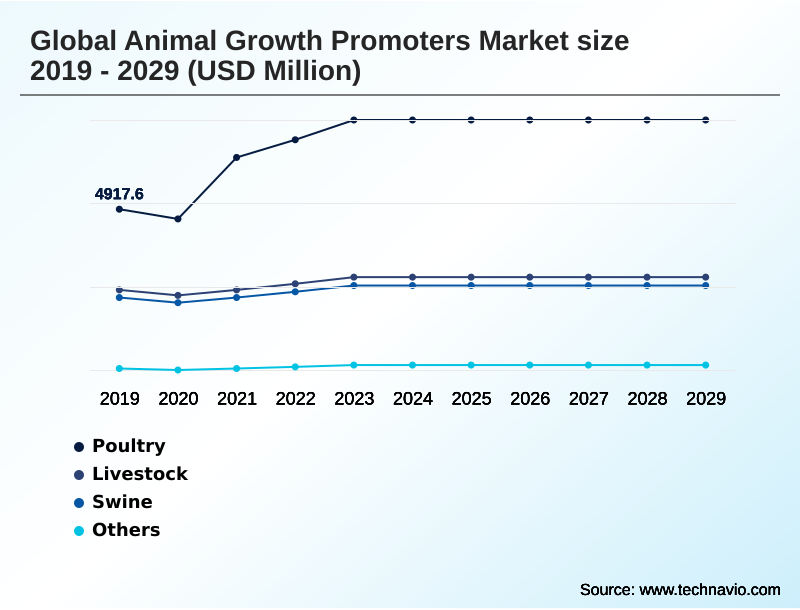
  • By Type - Poultry segment was valued at USD 7.18 billion in 2023
  • By Distribution Channel - Offline segment accounted for the largest market revenue share in 2023

Market Size & Forecast

  • Market Opportunities: USD 10.76 billion
  • Market Future Opportunities: USD 6.80 billion
  • CAGR from 2024 to 2029 : 7.6%

Market Summary

  • The animal growth promoters market is undergoing a fundamental transformation, moving away from conventional antibiotic-based methods toward natural and sustainable alternatives. This evolution is driven by the global need for safe animal-derived protein and heightened consumer awareness regarding antimicrobial resistance.
  • Key trends include the rising adoption of probiotics, prebiotics, and phytogenics, which enhance gut health and improve feed efficiency without contributing to bacterial resistance. For instance, a large-scale integrated poultry operation can leverage multi-strain probiotic feed additives to maintain flock health and optimize growth rates, ensuring compliance with stringent veterinary feed directives while meeting retailer demand for antibiotic-free products.
  • This strategic shift not only addresses regulatory pressures but also aligns with the principles of sustainable livestock production, which is becoming a prerequisite for market access. The industry's focus is now on scientifically validated non-antibiotic solutions that support animal welfare, improve nutrient utilization, and ensure food safety from farm to fork.

What will be the Size of the Animal Growth Promoters Market during the forecast period?

Get Key Insights on Market Forecast (PDF) Request Free Sample

How is the Animal Growth Promoters Market Segmented?

The animal growth promoters industry research report provides comprehensive data (region-wise segment analysis), with forecasts and estimates in "USD million" for the period 2025-2029, as well as historical data from 2019-2023 for the following segments.

  • Type
    • Poultry
    • Livestock
    • Swine
    • Others
  • Distribution channel
    • Offline
    • Online
  • Product type
    • Probiotics
    • Prebiotics
    • Phytogenics
  • Geography
    • APAC
      • China
      • India
      • Japan
    • North America
      • US
      • Canada
      • Mexico
    • Europe
      • Germany
      • UK
      • France
    • South America
      • Brazil
      • Argentina
    • Middle East and Africa
      • South Africa
      • Saudi Arabia
      • UAE
    • Rest of World (ROW)

By Type Insights

The poultry segment is estimated to witness significant growth during the forecast period.

The poultry segment is a significant and highly dynamic part of the animal growth promoters market, driven by intense global demand for meat and eggs.

This sector is rapidly moving away from antibiotic growth promoters toward non-antibiotic solutions that support poultry health management. Innovations such as multi-strain probiotics and advanced feed enzyme technology are critical for enhancing gut microbiota modulation and improving nutrient utilization.

For instance, the adoption of phytogenic feed additives has been shown to improve feed conversion ratios by up to 5% in commercial broiler operations.

This shift reflects a broader commitment to sustainable livestock production and addressing the challenges in antibiotic-free production, while still focusing on swine growth performance and overall animal wellness.

Request Free Sample

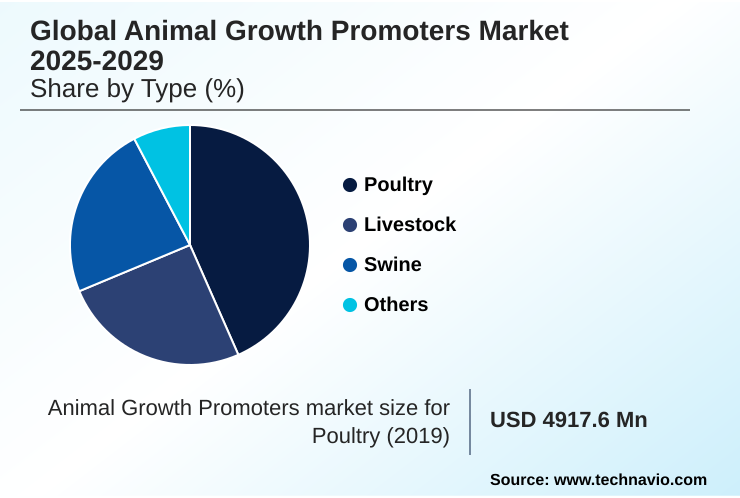
The Poultry segment was valued at USD 7.18 billion in 2023 and showed a gradual increase during the forecast period.

Request Free Sample

Regional Analysis

APAC is estimated to contribute 61.5% to the growth of the global market during the forecast period.Technavio’s analysts have elaborately explained the regional trends and drivers that shape the market during the forecast period.

See How Animal Growth Promoters Market Demand is Rising in APAC Request Free Sample

The geographic landscape is prominently led by the APAC region, which is projected to contribute over 61% of the market's incremental growth.

This dominance is fueled by the region's vast livestock population and the escalating demand for animal-derived protein in populous nations such as China and India.

The regional market is characterized by a rapid transition toward non-antibiotic solutions as local governments intensify regulations to combat antimicrobial resistance. Producers are increasingly turning to natural supplements for livestock growth to maintain productivity.

For example, the adoption of advanced phytogenic feed additives has enabled some farms to enhance nutrient absorption in cattle by approximately 8%, showcasing a commitment to both efficiency and sustainable animal farming practices.

This trend highlights the region's critical role in shaping the future of global livestock production and market dynamics of feed probiotics.

Market Dynamics

Our researchers analyzed the data with 2024 as the base year, along with the key drivers, trends, and challenges. A holistic analysis of drivers will help companies refine their marketing strategies to gain a competitive advantage.

  • The global animal growth promoters market is navigating a complex transition defined by a decisive move away from conventional methods. Producers are actively seeking effective alternatives to antibiotic growth promoters in poultry to meet both regulatory requirements and consumer preferences for antibiotic-free meat.
  • This has spurred innovation in probiotic feed supplements for swine performance, which are crucial for maintaining gut health and optimizing growth in intensive farming systems. The broader industry emphasis is on phytogenic additives for sustainable livestock farming, which aligns with global environmental and animal welfare goals.
  • A key focus remains on improving feed conversion ratio in cattle, as feed represents a major operational expense. Concurrently, evolving regulatory trends in animal feed additives are compelling manufacturers to invest heavily in research and development for compliant and effective solutions.
  • In operational terms, the shift is significant; supply chain managers report that sourcing and validating certified natural growth promoters for aquaculture now requires nearly double the due diligence time compared to conventional additives, reflecting a strategic pivot in procurement priorities toward transparency and sustainability.
  • This is balanced by the pursuit of using feed enzymes to reduce costs and a deeper understanding of prebiotics role in animal gut health, creating a dynamic and opportunity-rich environment.

What are the key market drivers leading to the rise in the adoption of Animal Growth Promoters Industry?

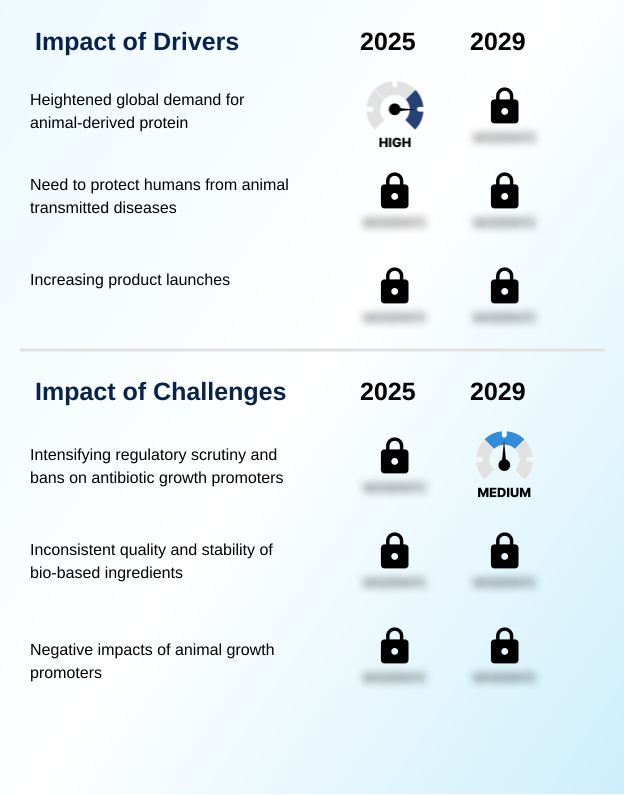
  • The primary driver for the market is the heightened global demand for animal-derived protein, which necessitates more efficient and productive livestock farming.

  • A primary driver shaping the market is the unrelenting global demand for animal-derived protein, which necessitates continuous improvements in production efficiency. This has amplified the focus on optimizing feed formulation and leveraging feed additives that enhance animal productivity.
  • The economic benefits of growth promoters are undeniable, with studies showing that strategic use can improve growth rates by over 5% in commercial livestock operations. This efficiency is critical for sustainable livestock production.
  • Furthermore, the need to protect human populations from animal-transmitted diseases provides a strong impetus for solutions that bolster animal immunity and health, reducing the reliance on therapeutic antibiotics.
  • Improving feed efficiency in poultry and other livestock is not just about profitability but also about resource management and sustainability in a resource-constrained world.

What are the market trends shaping the Animal Growth Promoters Industry?

  • The market is witnessing a significant trend toward the adoption of natural growth promoters. This shift is driven by the growing demand for sustainable and antibiotic-free animal production methods.

  • The market is characterized by a definitive trend toward natural and sustainable solutions, driven by consumer demand and regulatory pressure. The increasing demand for natural growth promoters is compelling producers to explore plant-based growth enhancers and other alternatives to antibiotic growth promoters.
  • Innovations such as encapsulation technology are becoming crucial, improving the efficacy of probiotic use in swine feed and other sensitive additives by ensuring targeted delivery in the digestive tract. This technological advancement has been shown to enhance product stability and effectiveness by over 20%.
  • The focus on phytogenics for animal health continues to grow, with new formulations of botanical additives demonstrating significant benefits in promoting digestive health and improving milk yield with natural additives. These developments underscore the industry's pivot toward holistic and scientifically backed nutritional strategies.

What challenges does the Animal Growth Promoters Industry face during its growth?

  • A key challenge affecting industry growth is the intensifying regulatory scrutiny and widespread bans on antibiotic growth promoters due to public health concerns.

  • The foremost challenge confronting the market is the stringent regulatory landscape for feed additives, which continues to intensify globally. The systematic phase-out of traditional antibiotic growth promoters due to concerns over antimicrobial resistance and bacterial resistance creates significant operational hurdles. Producers face the complex task of maintaining animal health and productivity while navigating these challenges in antibiotic-free production.
  • Transitioning to alternatives often involves higher initial costs, with some estimates suggesting a 10-15% increase in feed expenditures. Compliance with measures like the veterinary feed directive demands meticulous record-keeping and strategic adjustments in feed management. The inconsistent quality and stability of some natural ingredients also present a challenge, requiring rigorous quality control to ensure consistent efficacy and feed safety.

Exclusive Technavio Analysis on Customer Landscape

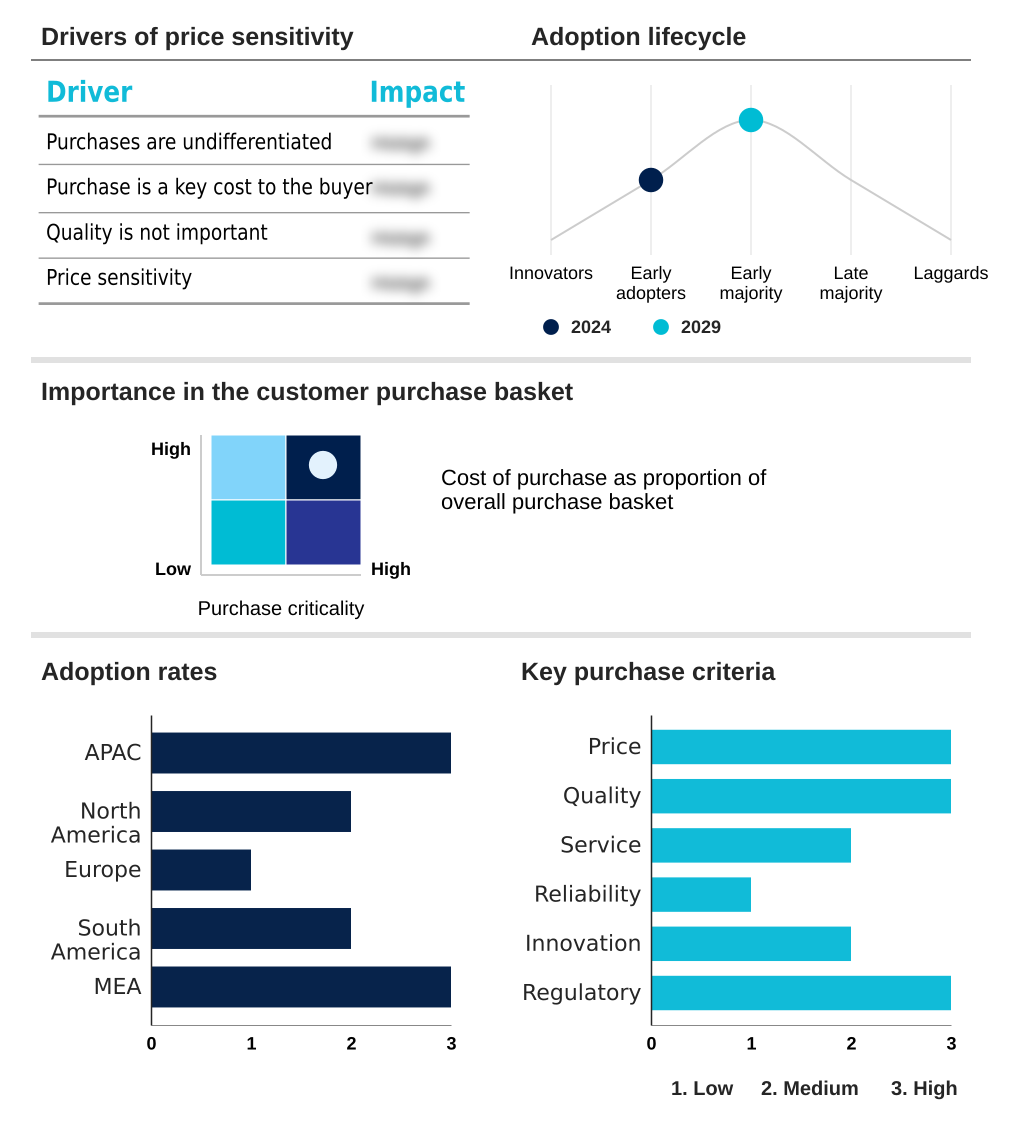
The animal growth promoters market forecasting report includes the adoption lifecycle of the market, covering from the innovator’s stage to the laggard’s stage. It focuses on adoption rates in different regions based on penetration. Furthermore, the animal growth promoters market report also includes key purchase criteria and drivers of price sensitivity to help companies evaluate and develop their market growth analysis strategies.

Customer Landscape of Animal Growth Promoters Industry

Competitive Landscape

Companies are implementing various strategies, such as strategic alliances, animal growth promoters market forecast, partnerships, mergers and acquisitions, geographical expansion, and product/service launches, to enhance their presence in the industry.

Adisseo France SAS - Offerings include advanced multi-enzymatic solutions designed to improve feed digestibility and nutrient absorption, which directly enhances livestock performance and productivity.

The industry research and growth report includes detailed analyses of the competitive landscape of the market and information about key companies, including:

  • Adisseo France SAS
  • Alltech Inc.
  • Archer Daniels Midland Co.
  • Associated British Foods Plc
  • BASF SE
  • Boehringer Ingelheim GmbH
  • Bupo Animal Health Pty Ltd.
  • Cargill Inc.
  • Chr Hansen AS
  • DSM Firmenich AG
  • Elanco Animal Health Inc.
  • Evonik Industries AG
  • Kemin Industries Inc.
  • Merck KGaA
  • Novozymes AS
  • Novus International Inc.
  • Nutreco N.V.
  • Phibro Animal Health Corp.
  • Vetoquinol SA
  • Zoetis Inc.

Qualitative and quantitative analysis of companies has been conducted to help clients understand the wider business environment as well as the strengths and weaknesses of key industry players. Data is qualitatively analyzed to categorize companies as pure play, category-focused, industry-focused, and diversified; it is quantitatively analyzed to categorize companies as dominant, leading, strong, tentative, and weak.

Recent Development and News in Animal growth promoters market

  • In September 2024, Archer Daniels Midland Co. partnered with Huvepharma to expand its portfolio of ruminant nutrition products within the US market.
  • In October 2024, DSM Firmenich AG entered a strategic partnership with Agrifirm to launch a sustainability and health optimization platform for the poultry sector, integrating its Sustell life-cycle assessment tool.
  • In December 2024, Kemin Industries Inc. introduced Bactan, a water-soluble product designed to help manage diarrhea in pigs and poultry, reinforcing its focus on sustainable animal health solutions.
  • In January 2025, BASF SE and Cargill Inc. deepened their existing collaboration to accelerate the development and delivery of innovative feed solutions aimed at improving animal nutrition and overall production efficiency.

Dive into Technavio’s robust research methodology, blending expert interviews, extensive data synthesis, and validated models for unparalleled Animal Growth Promoters Market insights. See full methodology.

Market Scope
Page number 291
Base year 2024
Historic period 2019-2023
Forecast period 2025-2029
Growth momentum & CAGR Accelerate at a CAGR of 7.6%
Market growth 2025-2029 USD 6801.9 million
Market structure Fragmented
YoY growth 2024-2025(%) 7.0%
Key countries China, India, Japan, Indonesia, Australia, South Korea, US, Canada, Mexico, Germany, UK, France, Spain, Italy, The Netherlands, Brazil, Argentina, Chile, South Africa, Saudi Arabia, Egypt, UAE and Nigeria
Competitive landscape Leading Companies, Market Positioning of Companies, Competitive Strategies, and Industry Risks

Request Free Sample

Research Analyst Overview

  • The animal growth promoters market is fundamentally shifting from a reliance on antibiotic growth promoters to a diverse portfolio of natural growth promoters, including probiotic feed additives, prebiotic supplements, and phytogenic feed additives. This pivot is a direct response to the global health imperative to mitigate antimicrobial resistance and aligns with tightening animal welfare standards.
  • For corporate strategy, boardroom decisions are increasingly centered on R&D investment in non-antibiotic solutions to ensure long-term market access and brand reputation. The adoption of advanced feed enzyme technology has enabled some producers to achieve up to a 5% improvement in the feed conversion ratio, a critical metric for operational profitability.
  • This innovation in livestock nutrition is essential for improving swine growth performance and poultry health management. Effective gut microbiota modulation through botanical additives and organic acids is key to enhancing nutrient utilization and digestive health improvement.
  • The ultimate goal is to foster sustainable livestock production and prevent zoonotic disease transmission through safer feed formulation and pathogen exclusion strategies that do not contribute to bacterial resistance.

What are the Key Data Covered in this Animal Growth Promoters Market Research and Growth Report?

  • What is the expected growth of the Animal Growth Promoters Market between 2025 and 2029?

    • USD 6.80 billion, at a CAGR of 7.6%

  • What segmentation does the market report cover?

    • The report is segmented by Type (Poultry, Livestock, Swine, and Others), Distribution Channel (Offline, and Online), Product Type (Probiotics, Prebiotics, and Phytogenics) and Geography (APAC, North America, Europe, South America, Middle East and Africa)

  • Which regions are analyzed in the report?

    • APAC, North America, Europe, South America and Middle East and Africa

  • What are the key growth drivers and market challenges?

    • Heightened global demand for animal-derived protein, Intensifying regulatory scrutiny and bans on antibiotic growth promoters

  • Who are the major players in the Animal Growth Promoters Market?

    • Adisseo France SAS, Alltech Inc., Archer Daniels Midland Co., Associated British Foods Plc, BASF SE, Boehringer Ingelheim GmbH, Bupo Animal Health Pty Ltd., Cargill Inc., Chr Hansen AS, DSM Firmenich AG, Elanco Animal Health Inc., Evonik Industries AG, Kemin Industries Inc., Merck KGaA, Novozymes AS, Novus International Inc., Nutreco N.V., Phibro Animal Health Corp., Vetoquinol SA and Zoetis Inc.

Market Research Insights

  • The market dynamics are shaped by a definitive move toward alternatives to antibiotic growth promoters, driven by both regulatory mandates and consumer demand. Sustainable animal farming practices are no longer optional, pushing producers to adopt innovative feed additives.
  • For instance, implementing strategies for improving feed efficiency in poultry can result in a 5% to 7% enhancement in feed conversion ratios, directly impacting profitability. Similarly, the targeted use of probiotics in swine feed has been correlated with a reduction in certain digestive ailments by up to 15%, improving overall herd health and productivity.
  • The evolving regulatory landscape for feed additives necessitates continuous adaptation, with a clear focus on solutions that bolster animal health while ensuring food safety and sustainability.

We can help! Our analysts can customize this animal growth promoters market research report to meet your requirements.

Get in touch

1. Executive Summary

1.1 Market overview

Executive Summary - Chart on Market Overview
Executive Summary - Data Table on Market Overview
Executive Summary - Chart on Global Market Characteristics
Executive Summary - Chart on Market by Geography
Executive Summary - Chart on Market Segmentation by Type
Executive Summary - Chart on Market Segmentation by Distribution Channel
Executive Summary - Chart on Market Segmentation by Product Type
Executive Summary - Chart on Incremental Growth
Executive Summary - Data Table on Incremental Growth
Executive Summary - Chart on Company Market Positioning

2. Technavio Analysis

2.1 Analysis of price sensitivity, lifecycle, customer purchase basket, adoption rates, and purchase criteria

2.2 Criticality of inputs and Factors of differentiation

Chart on Overview on criticality of inputs and factors of differentiation

2.3 Factors of disruption

Chart on Overview on factors of disruption

2.4 Impact of drivers and challenges

Chart on Impact of drivers and challenges in 2024 and 2029

3. Market Landscape

3.1 Market ecosystem

Chart on Parent Market
Data Table on - Parent Market

3.2 Market characteristics

Chart on Market characteristics analysis

3.3 Value chain analysis

Chart on Value chain analysis

4. Market Sizing

4.1 Market definition

Data Table on Offerings of companies included in the market definition

4.2 Market segment analysis

Market segments

4.3 Market size 2024

4.4 Market outlook: Forecast for 2024-2029

Chart on Global - Market size and forecast 2024-2029 ($ million)
Data Table on Global - Market size and forecast 2024-2029 ($ million)
Chart on Global Market: Year-over-year growth 2024-2029 (%)
Data Table on Global Market: Year-over-year growth 2024-2029 (%)

5. Historic Market Size

5.1 Global Animal Growth Promoters Market 2019 - 2023

Historic Market Size - Data Table on Global Animal Growth Promoters Market 2019 - 2023 ($ million)

5.2 Type segment analysis 2019 - 2023

Historic Market Size - Type Segment 2019 - 2023 ($ million)

5.3 Distribution Channel segment analysis 2019 - 2023

Historic Market Size - Distribution Channel Segment 2019 - 2023 ($ million)

5.4 Product Type segment analysis 2019 - 2023

Historic Market Size - Product Type Segment 2019 - 2023 ($ million)

5.5 Geography segment analysis 2019 - 2023

Historic Market Size - Geography Segment 2019 - 2023 ($ million)

5.6 Country segment analysis 2019 - 2023

Historic Market Size - Country Segment 2019 - 2023 ($ million)

6. Qualitative Analysis

6.1 Impact of AI on Global Animal Growth Promoters Market

7. Five Forces Analysis

7.1 Five forces summary

Five forces analysis - Comparison between 2024 and 2029

7.2 Bargaining power of buyers

Bargaining power of buyers - Impact of key factors 2024 and 2029

7.3 Bargaining power of suppliers

Bargaining power of suppliers - Impact of key factors in 2024 and 2029

7.4 Threat of new entrants

Threat of new entrants - Impact of key factors in 2024 and 2029

7.5 Threat of substitutes

Threat of substitutes - Impact of key factors in 2024 and 2029

7.6 Threat of rivalry

Threat of rivalry - Impact of key factors in 2024 and 2029

7.7 Market condition

Chart on Market condition - Five forces 2024 and 2029

8. Market Segmentation by Type

8.1 Market segments

Chart on Type - Market share 2024-2029 (%)
Data Table on Type - Market share 2024-2029 (%)

8.2 Comparison by Type

Chart on Comparison by Type
Data Table on Comparison by Type

8.3 Poultry - Market size and forecast 2024-2029

Chart on Poultry - Market size and forecast 2024-2029 ($ million)
Data Table on Poultry - Market size and forecast 2024-2029 ($ million)
Chart on Poultry - Year-over-year growth 2024-2029 (%)
Data Table on Poultry - Year-over-year growth 2024-2029 (%)

8.4 Livestock - Market size and forecast 2024-2029

Chart on Livestock - Market size and forecast 2024-2029 ($ million)
Data Table on Livestock - Market size and forecast 2024-2029 ($ million)
Chart on Livestock - Year-over-year growth 2024-2029 (%)
Data Table on Livestock - Year-over-year growth 2024-2029 (%)

8.5 Swine - Market size and forecast 2024-2029

Chart on Swine - Market size and forecast 2024-2029 ($ million)
Data Table on Swine - Market size and forecast 2024-2029 ($ million)
Chart on Swine - Year-over-year growth 2024-2029 (%)
Data Table on Swine - Year-over-year growth 2024-2029 (%)

8.6 Others - Market size and forecast 2024-2029

Chart on Others - Market size and forecast 2024-2029 ($ million)
Data Table on Others - Market size and forecast 2024-2029 ($ million)
Chart on Others - Year-over-year growth 2024-2029 (%)
Data Table on Others - Year-over-year growth 2024-2029 (%)

8.7 Market opportunity by Type

Market opportunity by Type ($ million)
Data Table on Market opportunity by Type ($ million)

9. Market Segmentation by Distribution Channel

9.1 Market segments

Chart on Distribution Channel - Market share 2024-2029 (%)
Data Table on Distribution Channel - Market share 2024-2029 (%)

9.2 Comparison by Distribution Channel

Chart on Comparison by Distribution Channel
Data Table on Comparison by Distribution Channel

9.3 Offline - Market size and forecast 2024-2029

Chart on Offline - Market size and forecast 2024-2029 ($ million)
Data Table on Offline - Market size and forecast 2024-2029 ($ million)
Chart on Offline - Year-over-year growth 2024-2029 (%)
Data Table on Offline - Year-over-year growth 2024-2029 (%)

9.4 Online - Market size and forecast 2024-2029

Chart on Online - Market size and forecast 2024-2029 ($ million)
Data Table on Online - Market size and forecast 2024-2029 ($ million)
Chart on Online - Year-over-year growth 2024-2029 (%)
Data Table on Online - Year-over-year growth 2024-2029 (%)

9.5 Market opportunity by Distribution Channel

Market opportunity by Distribution Channel ($ million)
Data Table on Market opportunity by Distribution Channel ($ million)

10. Market Segmentation by Product Type

10.1 Market segments

Chart on Product Type - Market share 2024-2029 (%)
Data Table on Product Type - Market share 2024-2029 (%)

10.2 Comparison by Product Type

Chart on Comparison by Product Type
Data Table on Comparison by Product Type

10.3 Probiotics - Market size and forecast 2024-2029

Chart on Probiotics - Market size and forecast 2024-2029 ($ million)
Data Table on Probiotics - Market size and forecast 2024-2029 ($ million)
Chart on Probiotics - Year-over-year growth 2024-2029 (%)
Data Table on Probiotics - Year-over-year growth 2024-2029 (%)

10.4 Prebiotics - Market size and forecast 2024-2029

Chart on Prebiotics - Market size and forecast 2024-2029 ($ million)
Data Table on Prebiotics - Market size and forecast 2024-2029 ($ million)
Chart on Prebiotics - Year-over-year growth 2024-2029 (%)
Data Table on Prebiotics - Year-over-year growth 2024-2029 (%)

10.5 Phytogenics - Market size and forecast 2024-2029

Chart on Phytogenics - Market size and forecast 2024-2029 ($ million)
Data Table on Phytogenics - Market size and forecast 2024-2029 ($ million)
Chart on Phytogenics - Year-over-year growth 2024-2029 (%)
Data Table on Phytogenics - Year-over-year growth 2024-2029 (%)

10.6 Market opportunity by Product Type

Market opportunity by Product Type ($ million)
Data Table on Market opportunity by Product Type ($ million)

11. Customer Landscape

11.1 Customer landscape overview

Analysis of price sensitivity, lifecycle, customer purchase basket, adoption rates, and purchase criteria

12. Geographic Landscape

12.1 Geographic segmentation

Chart on Market share by geography 2024-2029 (%)
Data Table on Market share by geography 2024-2029 (%)

12.2 Geographic comparison

Chart on Geographic comparison
Data Table on Geographic comparison

12.3 APAC - Market size and forecast 2024-2029

Chart on APAC - Market size and forecast 2024-2029 ($ million)
Data Table on APAC - Market size and forecast 2024-2029 ($ million)
Chart on APAC - Year-over-year growth 2024-2029 (%)
Data Table on APAC - Year-over-year growth 2024-2029 (%)
Chart on Regional Comparison - APAC
Data Table on Regional Comparison - APAC

12.3.1 China - Market size and forecast 2024-2029

Chart on China - Market size and forecast 2024-2029 ($ million)
Data Table on China - Market size and forecast 2024-2029 ($ million)
Chart on China - Year-over-year growth 2024-2029 (%)
Data Table on China - Year-over-year growth 2024-2029 (%)

12.3.2 India - Market size and forecast 2024-2029

Chart on India - Market size and forecast 2024-2029 ($ million)
Data Table on India - Market size and forecast 2024-2029 ($ million)
Chart on India - Year-over-year growth 2024-2029 (%)
Data Table on India - Year-over-year growth 2024-2029 (%)

12.3.3 Japan - Market size and forecast 2024-2029

Chart on Japan - Market size and forecast 2024-2029 ($ million)
Data Table on Japan - Market size and forecast 2024-2029 ($ million)
Chart on Japan - Year-over-year growth 2024-2029 (%)
Data Table on Japan - Year-over-year growth 2024-2029 (%)

12.3.4 Indonesia - Market size and forecast 2024-2029

Chart on Indonesia - Market size and forecast 2024-2029 ($ million)
Data Table on Indonesia - Market size and forecast 2024-2029 ($ million)
Chart on Indonesia - Year-over-year growth 2024-2029 (%)
Data Table on Indonesia - Year-over-year growth 2024-2029 (%)

12.3.5 Australia - Market size and forecast 2024-2029

Chart on Australia - Market size and forecast 2024-2029 ($ million)
Data Table on Australia - Market size and forecast 2024-2029 ($ million)
Chart on Australia - Year-over-year growth 2024-2029 (%)
Data Table on Australia - Year-over-year growth 2024-2029 (%)

12.3.6 South Korea - Market size and forecast 2024-2029

Chart on South Korea - Market size and forecast 2024-2029 ($ million)
Data Table on South Korea - Market size and forecast 2024-2029 ($ million)
Chart on South Korea - Year-over-year growth 2024-2029 (%)
Data Table on South Korea - Year-over-year growth 2024-2029 (%)

12.4 North America - Market size and forecast 2024-2029

Chart on North America - Market size and forecast 2024-2029 ($ million)
Data Table on North America - Market size and forecast 2024-2029 ($ million)
Chart on North America - Year-over-year growth 2024-2029 (%)
Data Table on North America - Year-over-year growth 2024-2029 (%)
Chart on Regional Comparison - North America
Data Table on Regional Comparison - North America

12.4.1 US - Market size and forecast 2024-2029

Chart on US - Market size and forecast 2024-2029 ($ million)
Data Table on US - Market size and forecast 2024-2029 ($ million)
Chart on US - Year-over-year growth 2024-2029 (%)
Data Table on US - Year-over-year growth 2024-2029 (%)

12.4.2 Canada - Market size and forecast 2024-2029

Chart on Canada - Market size and forecast 2024-2029 ($ million)
Data Table on Canada - Market size and forecast 2024-2029 ($ million)
Chart on Canada - Year-over-year growth 2024-2029 (%)
Data Table on Canada - Year-over-year growth 2024-2029 (%)

12.4.3 Mexico - Market size and forecast 2024-2029

Chart on Mexico - Market size and forecast 2024-2029 ($ million)
Data Table on Mexico - Market size and forecast 2024-2029 ($ million)
Chart on Mexico - Year-over-year growth 2024-2029 (%)
Data Table on Mexico - Year-over-year growth 2024-2029 (%)

12.5 Europe - Market size and forecast 2024-2029

Chart on Europe - Market size and forecast 2024-2029 ($ million)
Data Table on Europe - Market size and forecast 2024-2029 ($ million)
Chart on Europe - Year-over-year growth 2024-2029 (%)
Data Table on Europe - Year-over-year growth 2024-2029 (%)
Chart on Regional Comparison - Europe
Data Table on Regional Comparison - Europe

12.5.1 Germany - Market size and forecast 2024-2029

Chart on Germany - Market size and forecast 2024-2029 ($ million)
Data Table on Germany - Market size and forecast 2024-2029 ($ million)
Chart on Germany - Year-over-year growth 2024-2029 (%)
Data Table on Germany - Year-over-year growth 2024-2029 (%)

12.5.2 UK - Market size and forecast 2024-2029

Chart on UK - Market size and forecast 2024-2029 ($ million)
Data Table on UK - Market size and forecast 2024-2029 ($ million)
Chart on UK - Year-over-year growth 2024-2029 (%)
Data Table on UK - Year-over-year growth 2024-2029 (%)

12.5.3 France - Market size and forecast 2024-2029

Chart on France - Market size and forecast 2024-2029 ($ million)
Data Table on France - Market size and forecast 2024-2029 ($ million)
Chart on France - Year-over-year growth 2024-2029 (%)
Data Table on France - Year-over-year growth 2024-2029 (%)

12.5.4 Spain - Market size and forecast 2024-2029

Chart on Spain - Market size and forecast 2024-2029 ($ million)
Data Table on Spain - Market size and forecast 2024-2029 ($ million)
Chart on Spain - Year-over-year growth 2024-2029 (%)
Data Table on Spain - Year-over-year growth 2024-2029 (%)

12.5.5 Italy - Market size and forecast 2024-2029

Chart on Italy - Market size and forecast 2024-2029 ($ million)
Data Table on Italy - Market size and forecast 2024-2029 ($ million)
Chart on Italy - Year-over-year growth 2024-2029 (%)
Data Table on Italy - Year-over-year growth 2024-2029 (%)

12.5.6 The Netherlands - Market size and forecast 2024-2029

Chart on The Netherlands - Market size and forecast 2024-2029 ($ million)
Data Table on The Netherlands - Market size and forecast 2024-2029 ($ million)
Chart on The Netherlands - Year-over-year growth 2024-2029 (%)
Data Table on The Netherlands - Year-over-year growth 2024-2029 (%)

12.6 South America - Market size and forecast 2024-2029

Chart on South America - Market size and forecast 2024-2029 ($ million)
Data Table on South America - Market size and forecast 2024-2029 ($ million)
Chart on South America - Year-over-year growth 2024-2029 (%)
Data Table on South America - Year-over-year growth 2024-2029 (%)
Chart on Regional Comparison - South America
Data Table on Regional Comparison - South America

12.6.1 Brazil - Market size and forecast 2024-2029

Chart on Brazil - Market size and forecast 2024-2029 ($ million)
Data Table on Brazil - Market size and forecast 2024-2029 ($ million)
Chart on Brazil - Year-over-year growth 2024-2029 (%)
Data Table on Brazil - Year-over-year growth 2024-2029 (%)

12.6.2 Argentina - Market size and forecast 2024-2029

Chart on Argentina - Market size and forecast 2024-2029 ($ million)
Data Table on Argentina - Market size and forecast 2024-2029 ($ million)
Chart on Argentina - Year-over-year growth 2024-2029 (%)
Data Table on Argentina - Year-over-year growth 2024-2029 (%)

12.6.3 Chile - Market size and forecast 2024-2029

Chart on Chile - Market size and forecast 2024-2029 ($ million)
Data Table on Chile - Market size and forecast 2024-2029 ($ million)
Chart on Chile - Year-over-year growth 2024-2029 (%)
Data Table on Chile - Year-over-year growth 2024-2029 (%)

12.7 Middle East and Africa - Market size and forecast 2024-2029

Chart on Middle East and Africa - Market size and forecast 2024-2029 ($ million)
Data Table on Middle East and Africa - Market size and forecast 2024-2029 ($ million)
Chart on Middle East and Africa - Year-over-year growth 2024-2029 (%)
Data Table on Middle East and Africa - Year-over-year growth 2024-2029 (%)
Chart on Regional Comparison - Middle East and Africa
Data Table on Regional Comparison - Middle East and Africa

12.7.1 South Africa - Market size and forecast 2024-2029

Chart on South Africa - Market size and forecast 2024-2029 ($ million)
Data Table on South Africa - Market size and forecast 2024-2029 ($ million)
Chart on South Africa - Year-over-year growth 2024-2029 (%)
Data Table on South Africa - Year-over-year growth 2024-2029 (%)

12.7.2 Saudi Arabia - Market size and forecast 2024-2029

Chart on Saudi Arabia - Market size and forecast 2024-2029 ($ million)
Data Table on Saudi Arabia - Market size and forecast 2024-2029 ($ million)
Chart on Saudi Arabia - Year-over-year growth 2024-2029 (%)
Data Table on Saudi Arabia - Year-over-year growth 2024-2029 (%)

12.7.3 Egypt - Market size and forecast 2024-2029

Chart on Egypt - Market size and forecast 2024-2029 ($ million)
Data Table on Egypt - Market size and forecast 2024-2029 ($ million)
Chart on Egypt - Year-over-year growth 2024-2029 (%)
Data Table on Egypt - Year-over-year growth 2024-2029 (%)

12.7.4 UAE - Market size and forecast 2024-2029

Chart on UAE - Market size and forecast 2024-2029 ($ million)
Data Table on UAE - Market size and forecast 2024-2029 ($ million)
Chart on UAE - Year-over-year growth 2024-2029 (%)
Data Table on UAE - Year-over-year growth 2024-2029 (%)

12.7.5 Nigeria - Market size and forecast 2024-2029

Chart on Nigeria - Market size and forecast 2024-2029 ($ million)
Data Table on Nigeria - Market size and forecast 2024-2029 ($ million)
Chart on Nigeria - Year-over-year growth 2024-2029 (%)
Data Table on Nigeria - Year-over-year growth 2024-2029 (%)

12.8 Market opportunity by geography

Market opportunity by geography ($ million)
Data Tables on Market opportunity by geography ($ million)

13. Drivers, Challenges, and Opportunity

13.1 Market drivers

Heightened global demand for animal-derived protein
Need to protect humans from animal transmitted diseases
Increasing product launches

13.2 Market challenges

Intensifying regulatory scrutiny and bans on antibiotic growth promoters
Inconsistent quality and stability of bio-based ingredients
Negative impacts of animal growth promoters

13.3 Impact of drivers and challenges

Impact of drivers and challenges in 2024 and 2029

13.4 Market opportunities

Increasing demand for natural growth promoters
Expansion of probiotics and prebiotics in livestock nutrition
Transition toward antibiotic-free growth promotion solutions

14. Competitive Landscape

14.1 Overview

14.2

Overview on criticality of inputs and factors of differentiation

14.3 Landscape disruption

Overview on factors of disruption

14.4 Industry risks

Impact of key risks on business

15. Competitive Analysis

15.1 Companies profiled

Companies covered

15.2 Company ranking index

15.3 Market positioning of companies

Matrix on companies position and classification

15.4 Adisseo France SAS

Adisseo France SAS - Overview
Adisseo France SAS - Product / Service
Adisseo France SAS - Key offerings
SWOT

15.5 Alltech Inc.

Alltech Inc. - Overview
Alltech Inc. - Product / Service
Alltech Inc. - Key news
Alltech Inc. - Key offerings
SWOT

15.6 Archer Daniels Midland Co.

Archer Daniels Midland Co. - Overview
Archer Daniels Midland Co. - Business segments
Archer Daniels Midland Co. - Key news
Archer Daniels Midland Co. - Key offerings
Archer Daniels Midland Co. - Segment focus
SWOT

15.7 Associated British Foods Plc

Associated British Foods Plc - Overview
Associated British Foods Plc - Business segments
Associated British Foods Plc - Key offerings
Associated British Foods Plc - Segment focus
SWOT

15.8 BASF SE

BASF SE - Overview
BASF SE - Business segments
BASF SE - Key news
BASF SE - Key offerings
BASF SE - Segment focus
SWOT

15.9 Boehringer Ingelheim GmbH

Boehringer Ingelheim GmbH - Overview
Boehringer Ingelheim GmbH - Product / Service
Boehringer Ingelheim GmbH - Key news
Boehringer Ingelheim GmbH - Key offerings
SWOT

15.10 Bupo Animal Health Pty Ltd.

Bupo Animal Health Pty Ltd. - Overview
Bupo Animal Health Pty Ltd. - Product / Service
Bupo Animal Health Pty Ltd. - Key offerings
SWOT

15.11 Cargill Inc.

Cargill Inc. - Overview
Cargill Inc. - Product / Service
Cargill Inc. - Key offerings
SWOT

15.12 Chr Hansen AS

Chr Hansen AS - Overview
Chr Hansen AS - Business segments
Chr Hansen AS - Key news
Chr Hansen AS - Key offerings
Chr Hansen AS - Segment focus
SWOT

15.13 DSM Firmenich AG

DSM Firmenich AG - Overview
DSM Firmenich AG - Business segments
DSM Firmenich AG - Key news
DSM Firmenich AG - Key offerings
DSM Firmenich AG - Segment focus
SWOT

15.14 Elanco Animal Health Inc.

Elanco Animal Health Inc. - Overview
Elanco Animal Health Inc. - Product / Service
Elanco Animal Health Inc. - Key offerings
SWOT

15.15 Evonik Industries AG

Evonik Industries AG - Overview
Evonik Industries AG - Business segments
Evonik Industries AG - Key news
Evonik Industries AG - Key offerings
Evonik Industries AG - Segment focus
SWOT

15.16 Merck KGaA

Merck KGaA - Overview
Merck KGaA - Business segments
Merck KGaA - Key news
Merck KGaA - Key offerings
Merck KGaA - Segment focus
SWOT

15.17 Phibro Animal Health Corp.

Phibro Animal Health Corp. - Overview
Phibro Animal Health Corp. - Business segments
Phibro Animal Health Corp. - Key offerings
Phibro Animal Health Corp. - Segment focus
SWOT

15.18 Zoetis Inc.

Zoetis Inc. - Overview
Zoetis Inc. - Business segments
Zoetis Inc. - Key news
Zoetis Inc. - Key offerings
Zoetis Inc. - Segment focus
SWOT

16. Appendix

16.1 Scope of the report

Market definition
Objectives
Notes and caveats

16.2 Inclusions and exclusions checklist

Inclusions checklist
Exclusions checklist

16.3 Currency conversion rates for US$

16.4 Research methodology

16.5 Data procurement

Information sources

16.6 Data validation

16.7 Validation techniques employed for market sizing

16.8 Data synthesis

16.9 360 degree market analysis

16.10 List of abbreviations

Research Methodology

Technavio presents a detailed picture of the market by way of study, synthesis, and summation of data from multiple sources. The analysts have presented the various facets of the market with a particular focus on identifying the key industry influencers. The data thus presented is comprehensive, reliable, and the result of extensive research, both primary and secondary.

INFORMATION SOURCES

Primary sources

  • Manufacturers and suppliers
  • Channel partners
  • Industry experts
  • Strategic decision makers

Secondary sources

  • Industry journals and periodicals
  • Government data
  • Financial reports of key industry players
  • Historical data
  • Press releases

DATA ANALYSIS

Data Synthesis

  • Collation of data
  • Estimation of key figures
  • Analysis of derived insights

Data Validation

  • Triangulation with data models
  • Reference against proprietary databases
  • Corroboration with industry experts

REPORT WRITING

Qualitative

  • Market drivers
  • Market challenges
  • Market trends
  • Five forces analysis

Quantitative

  • Market size and forecast
  • Market segmentation
  • Geographical insights
  • Competitive landscape

Interested in this report?

Get your sample now to see our research methodology and insights!

Download Now

Frequently Asked Questions

Animal Growth Promoters market growth will increase by USD 6801.9 million during 2025-2029 .

The Animal Growth Promoters market is expected to grow at a CAGR of 7.6% during 2025-2029 .

Animal Growth Promoters market is segmented by Type (Poultry, Livestock, Swine, Others) Distribution channel (Offline, Online) Product type (Probiotics, Prebiotics, Phytogenics)

Adisseo France SAS, Alltech Inc., Archer Daniels Midland Co., Associated British Foods Plc, BASF SE, Boehringer Ingelheim GmbH, Bupo Animal Health Pty Ltd., Cargill Inc., Chr Hansen AS, DSM Firmenich AG, Elanco Animal Health Inc., Evonik Industries AG, Kemin Industries Inc., Merck KGaA, Novozymes AS, Novus International Inc., Nutreco N.V., Phibro Animal Health Corp., Vetoquinol SA, Zoetis Inc. are a few of the key vendors in the Animal Growth Promoters market.

APAC will register the highest growth rate of 61.5% among the other regions. Therefore, the Animal Growth Promoters market in APAC is expected to garner significant business opportunities for the vendors during the forecast period.

China, India, Japan, Indonesia, Australia, South Korea, US, Canada, Mexico, Germany, UK, France, Spain, Italy, The Netherlands, Brazil, Argentina, Chile, South Africa, Saudi Arabia, Egypt, UAE, Nigeria

  • Heightened global demand for animal-derived protein is the driving factor this market.

The Animal Growth Promoters market vendors should focus on grabbing business opportunities from the Type segment as it accounted for the largest market share in the base year.