
Antibiotics Market Size 2026-2030
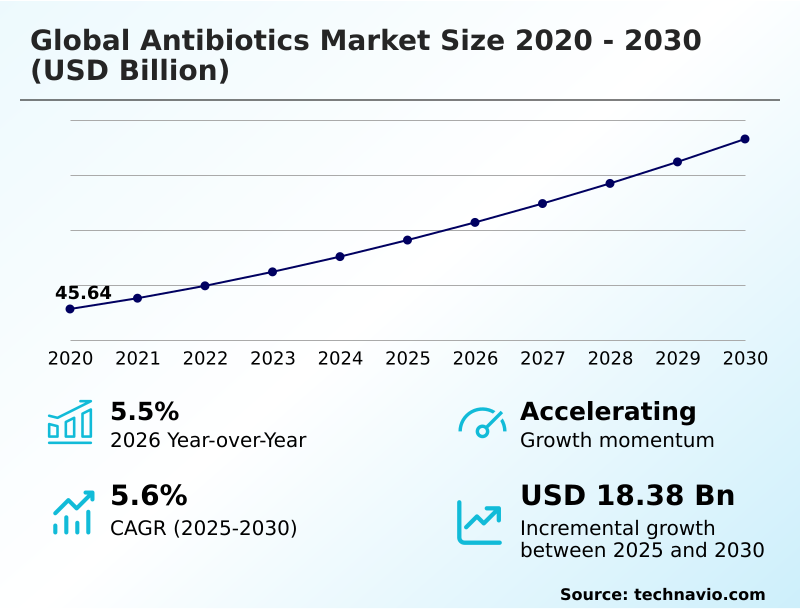
The antibiotics market size is valued to increase by USD 18.38 billion, at a CAGR of 5.6% from 2025 to 2030. Increasing antimicrobial resistance incidences will drive the antibiotics market.
Major Market Trends & Insights
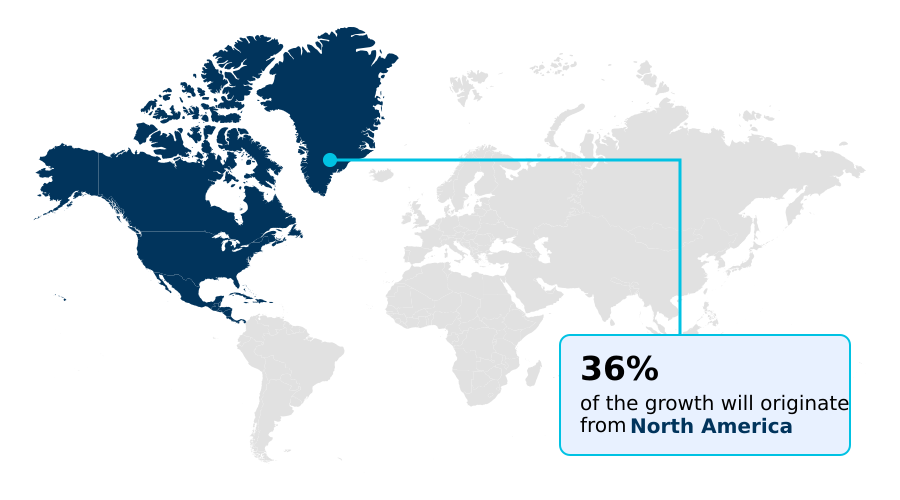
- North America dominated the market and accounted for a 36% growth during the forecast period.
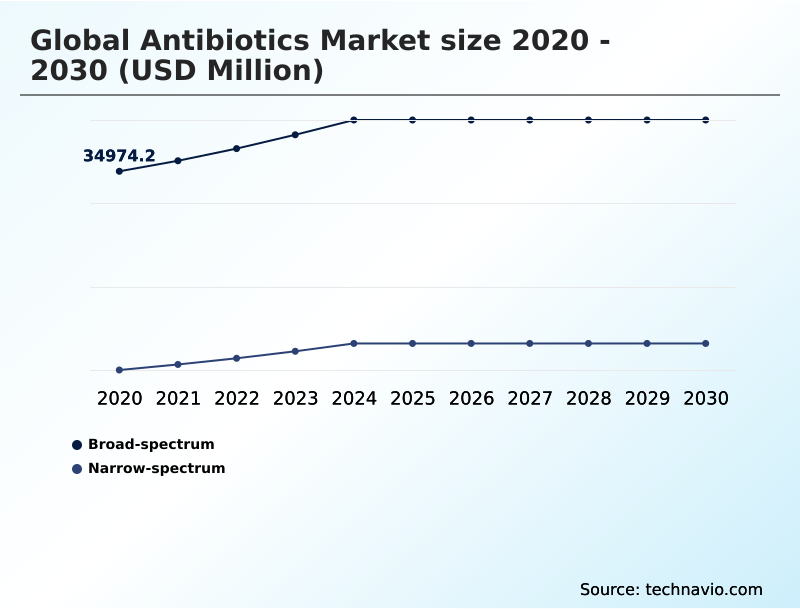
- By Product - Broad-spectrum segment was valued at USD 41.25 billion in 2024
- By Route of Administration - Intravenous segment accounted for the largest market revenue share in 2024
Market Size & Forecast
- Market Opportunities: USD 30.92 billion
- Market Future Opportunities: USD 18.38 billion
- CAGR from 2025 to 2030 : 5.6%
Market Summary
- The antibiotics market is at a critical inflection point, shaped by the dual pressures of escalating antimicrobial resistance and the economic paradox of antibiotic stewardship. The urgent clinical need for novel antibacterial agents to combat multidrug-resistant pathogens is the primary engine of innovation.
- However, the commercial viability of these new drugs is undermined by the public health imperative to use them sparingly to preserve their efficacy. This dynamic forces a strategic re-evaluation within the industry, pivoting from a volume-based sales model to one rewarding innovation through alternative mechanisms like public-private partnerships and market entry rewards.
- For instance, a hospital system implementing a robust antibiotic stewardship program leverages advanced diagnostics to ensure the use of narrow-spectrum agents, improving patient outcomes and reducing the spread of resistance, but this responsible practice simultaneously curtails sales of the very products needed to save lives.
- This complex interplay between clinical need, economic incentives, and stewardship is compelling a search for sustainable economic models for antibiotic development that can ensure a continuous pipeline of effective treatments.
What will be the Size of the Antibiotics Market during the forecast period?
Get Key Insights on Market Forecast (PDF) Get Free Sample
How is the Antibiotics Market Segmented?
The antibiotics industry research report provides comprehensive data (region-wise segment analysis), with forecasts and estimates in "USD million" for the period 2026-2030, as well as historical data from 2020-2024 for the following segments.
- Product
- Broad-spectrum
- Narrow-spectrum
- Route of administration
- Intravenous
- Oral
- Others
- Distribution channel
- Hospital pharmacies
- Retail pharmacies
- Online pharmacies
- Geography
- North America
- US
- Canada
- Mexico
- Europe
- Germany
- UK
- France
- Asia
- Rest of World (ROW)
- North America
By Product Insights
The broad-spectrum segment is estimated to witness significant growth during the forecast period.
The broad-spectrum segment remains a cornerstone of the global antibiotics market 2026-2030, particularly for empirical therapy in critical care settings. These agents are indispensable when immediate treatment is required before a causative pathogen is identified.
However, their use is increasingly scrutinized under antibiotic stewardship programs due to their role in driving antimicrobial resistance. This has led to a strategic pivot in the industry toward developing narrow-spectrum agents and supporting technologies.
The market is also influenced by the need to combat multidrug-resistant pathogens, where broad-spectrum drugs are often the last line of defense.
The push for precision medicine in infectious disease is reshaping clinical practice, though the demand for broad-spectrum options in emergencies persists, with North America contributing over 35% of incremental market growth, reflecting its high-acuity care demands.
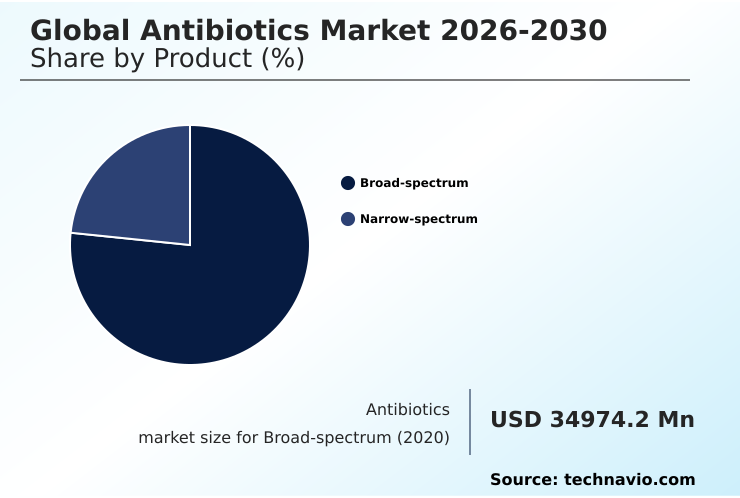
The Broad-spectrum segment was valued at USD 41.25 billion in 2024 and showed a gradual increase during the forecast period.
Regional Analysis
North America is estimated to contribute 36% to the growth of the global market during the forecast period.Technavio’s analysts have elaborately explained the regional trends and drivers that shape the market during the forecast period.
See How Antibiotics Market Demand is Rising in North America Get Free Sample
The geographic landscape of the global antibiotics market 2026-2030 is highly varied. North America will account for 36.0% of the market's incremental growth, driven by substantial government funding and incentives for developing novel antibacterial agents to combat multidrug-resistant pathogens.
The region's advanced healthcare infrastructure supports the adoption of precision medicine in infectious disease. In contrast, Asia is the fastest-growing region, with a projected CAGR of 6.8%.
This growth is fueled by improving healthcare access and a high burden of infectious diseases, but the region also faces significant challenges with antimicrobial resistance mechanisms and the need for robust antibiotic stewardship programs.
Europe's market growth of 5.1% is more moderate, reflecting mature healthcare systems with strong stewardship but also complex regulatory pathways for new antibiotics.
Market Dynamics
Our researchers analyzed the data with 2025 as the base year, along with the key drivers, trends, and challenges. A holistic analysis of drivers will help companies refine their marketing strategies to gain a competitive advantage.
- The future of the global antibiotics market 2026-2030 hinges on resolving the fundamental economic paradox that has stifled innovation for decades. The exploration of new economic models for antibiotic development is now a central theme, moving beyond volume-based sales toward systems that reward successful innovation.
- The impact of AI on antibiotic discovery is a critical factor, with machine learning algorithms demonstrating the potential to screen billions of compounds and identify novel mechanisms of action orders of magnitude faster than traditional methods. This technological shift is crucial for overcoming the challenges in antibiotic clinical trials, which remain lengthy and expensive, with high failure rates.
- To support this, streamlined regulatory pathways for new antibiotics are being developed by health authorities worldwide to expedite the approval of drugs that target critical priority pathogens.
- A key to unlocking this new ecosystem is improving the role of diagnostics in antibiotic stewardship; rapid and accurate testing enables the use of targeted therapies, which not only improves patient outcomes but also helps justify the value of new, high-cost agents.
- This integrated approach is essential to create a sustainable pipeline and ensure a return on investment for companies tackling antimicrobial resistance.
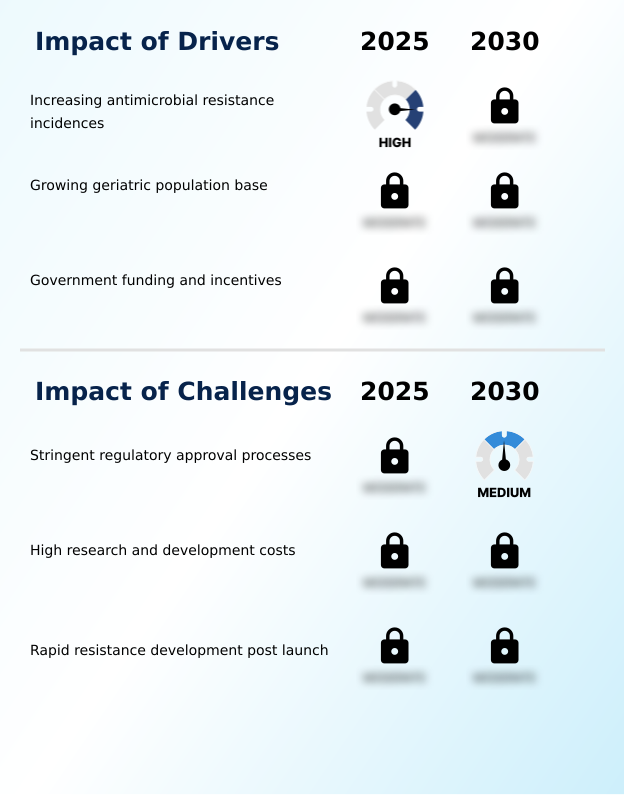
What are the key market drivers leading to the rise in the adoption of Antibiotics Industry?
- The primary driver of the global antibiotics market is the alarming and relentless rise of antimicrobial resistance, which creates an urgent demand for new and effective treatments.
- The primary driver for the global antibiotics market 2026-2030 is the relentless rise of antimicrobial resistance.
- The global burden of disease from drug-resistant infections continues to climb, with mortality rates increasing by over 15% in the last decade, creating a powerful incentive for innovation.
- This is compounded by demographic shifts, particularly a growing geriatric population that is more susceptible to severe infections. In response, governments and philanthropic organizations are escalating government funding and incentives to de-risk investment in this sector.
- These push-and-pull mechanisms, including direct grants and market entry rewards, are crucial for revitalizing the R&D pipeline, especially for small and medium-sized enterprises at the forefront of antibiotic discovery and development.
What are the market trends shaping the Antibiotics Industry?
- The global antibiotics market is seeing a pivotal trend toward pathogen-specific antibiotic development. This precision medicine approach is a direct response to the escalating crisis of antimicrobial resistance.
- Key trends are fundamentally reshaping the global antibiotics market 2026-2030, driven by the urgent need for novel antibacterial agents. A primary trend is the integration of AI and machine learning in antibiotic discovery and development. These technologies are accelerating the identification of new compounds and mechanisms of action, with some platforms reducing preclinical screening times by over 40%.
- This complements the shift toward precision medicine in infectious disease, where advanced diagnostics enable the targeted use of pathogen-specific antibiotics. Another emerging area is the renewed interest in bacteriophage therapy as a viable alternative for treating multidrug-resistant pathogens, particularly gram-negative bacteria. These trends collectively represent a move toward more sophisticated, data-driven approaches to combat antimicrobial resistance.
What challenges does the Antibiotics Industry face during its growth?
- A significant challenge constraining the global antibiotics market is the stringent and complex regulatory approval process, which can deter investment and slow down the development of new drugs.
- Significant challenges constrain the global antibiotics market 2026-2030, foremost among them being the flawed economic model. The paradox of antibiotic stewardship—where new, effective drugs must be used sparingly—severely limits return on investment.
- This is exacerbated by high research and development costs and stringent regulatory approval processes, where the probability of a new drug entering clinical trials and reaching the market is less than 10%. Furthermore, the rapid development of antimicrobial resistance mechanisms post-launch shortens the effective commercial life of a new product.
- These hurdles create a formidable barrier to entry and have led many large pharmaceutical companies to exit the field, highlighting the critical need for new economic models for antibiotic development and public-private partnerships to sustain innovation.
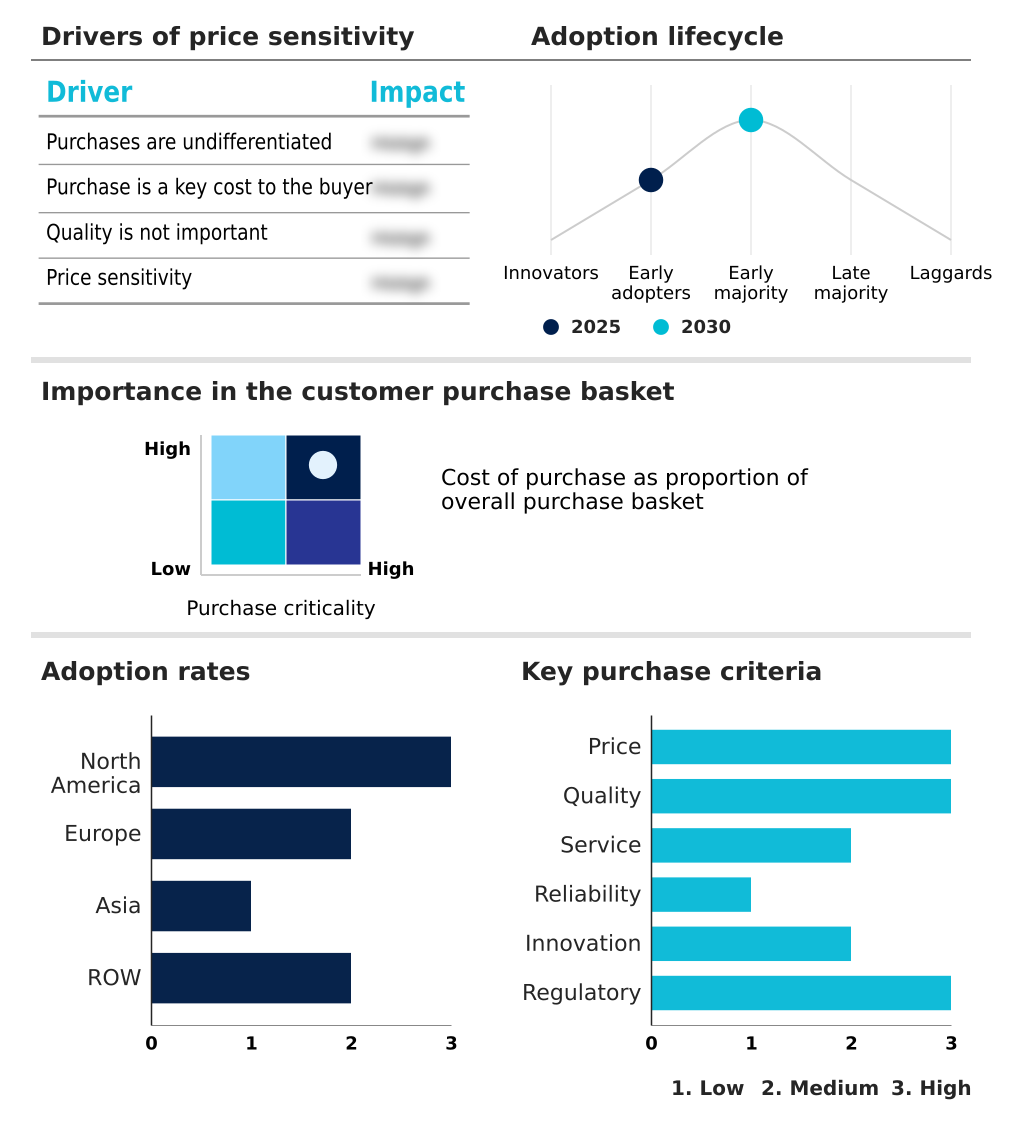
Exclusive Technavio Analysis on Customer Landscape
The antibiotics market forecasting report includes the adoption lifecycle of the market, covering from the innovator’s stage to the laggard’s stage. It focuses on adoption rates in different regions based on penetration. Furthermore, the antibiotics market report also includes key purchase criteria and drivers of price sensitivity to help companies evaluate and develop their market growth analysis strategies.
Customer Landscape of Antibiotics Industry
Competitive Landscape
Companies are implementing various strategies, such as strategic alliances, antibiotics market forecast, partnerships, mergers and acquisitions, geographical expansion, and product/service launches, to enhance their presence in the industry.
Abbott Laboratories - The company's offerings in anti-infectives, including various antibiotics, address a range of bacterial infections from common to complex.
The industry research and growth report includes detailed analyses of the competitive landscape of the market and information about key companies, including:
- Abbott Laboratories
- AbbVie Inc.
- Aspen Pharmacare Ltd.
- Aurobindo Pharma Ltd.
- Bayer AG
- Cipla Inc.
- F. Hoffmann La Roche Ltd.
- Flynn Pharma Ltd.
- GlaxoSmithKline Plc
- Incepta Pharmaceuticals Ltd.
- Kenvue Inc.
- Lupin Ltd.
- Mayne Pharma Group Ltd.
- Melinta Therapeutics LLC
- Merck KGaA
- Otsuka Holdings Co. Ltd.
- Pfizer Inc.
- Sanofi SA
- Sun Pharmaceutical Industries
- Teva Pharmaceutical Ltd.
Qualitative and quantitative analysis of companies has been conducted to help clients understand the wider business environment as well as the strengths and weaknesses of key industry players. Data is qualitatively analyzed to categorize companies as pure play, category-focused, industry-focused, and diversified; it is quantitatively analyzed to categorize companies as dominant, leading, strong, tentative, and weak.
Recent Development and News in Antibiotics market
- In November, 2024, Pfizer India, in collaboration with the Government of Goa and other partners, launched Project Parivartan, a multi-year initiative aimed at combating antimicrobial resistance through the development of a statewide framework for Antimicrobial Stewardship and infection control.
- In January, 2025, The US Food and Drug Administration, the Centers for Disease Control and Prevention, and the Department of Agriculture initiated a collaborative process to develop the National Antimicrobial Resistance Monitoring System (NARMS) Strategic Plan for 2026-2030, reinforcing the One Health approach to track resistance trends across human, animal, and environmental sectors.
- In February, 2025, Cipla Inc. secured approval from the Central Drugs Standard Control Organization in India to market Plazomicin, an antibiotic for treating complicated urinary tract infections, thereby expanding the available therapeutic options in the country.
- In May, 2025, Roche successfully advanced a new class of antibiotic into human trials, a significant milestone that addresses the nearly fifty-year drought in the discovery of novel antibiotic classes and offers potential new mechanisms to combat drug-resistant bacteria.
Dive into Technavio’s robust research methodology, blending expert interviews, extensive data synthesis, and validated models for unparalleled Antibiotics Market insights. See full methodology.
| Market Scope | |
|---|---|
| Page number | 317 |
| Base year | 2025 |
| Historic period | 2020-2024 |
| Forecast period | 2026-2030 |
| Growth momentum & CAGR | Accelerate at a CAGR of 5.6% |
| Market growth 2026-2030 | USD 18381.5 million |
| Market structure | Fragmented |
| YoY growth 2025-2026(%) | 5.5% |
| Key countries | US, Canada, Mexico, Germany, UK, France, Italy, The Netherlands, Spain, Russia, China, India, Japan, South Korea, Indonesia, Thailand, Singapore, Australia, Brazil, UAE, South Africa, Saudi Arabia and Turkey |
| Competitive landscape | Leading Companies, Market Positioning of Companies, Competitive Strategies, and Industry Risks |
Research Analyst Overview
- The global antibiotics market 2026-2030 is undergoing a structural transformation dictated by the crisis of antimicrobial resistance. This has forced a pivot from reliance on broad-spectrum antibiotics to the development of pathogen-specific antibiotics and narrow-spectrum agents.
- This shift directly impacts boardroom strategy, as companies must now balance their portfolios between high-volume generics and high-risk, high-reward R&D for novel treatments against gram-negative bacteria and other multidrug-resistant pathogens. The commercial success of these new drugs is increasingly dependent on navigating complex antibiotic stewardship programs and demonstrating value within them.
- This strategic realignment is critical, as companies investing in targeted therapies often face development timelines that are up to 20% longer but can secure premium pricing and market exclusivity. The market's evolution is further influenced by the rise of bacteriophage therapy and other alternatives, compelling established players to innovate or risk obsolescence in the fight against infectious diseases.
What are the Key Data Covered in this Antibiotics Market Research and Growth Report?
-
What is the expected growth of the Antibiotics Market between 2026 and 2030?
-
USD 18.38 billion, at a CAGR of 5.6%
-
-
What segmentation does the market report cover?
-
The report is segmented by Product (Broad-spectrum, and Narrow-spectrum), Route of Administration (Intravenous, Oral, and Others), Distribution Channel (Hospital pharmacies, Retail pharmacies, and Online pharmacies) and Geography (North America, Europe, Asia, Rest of World (ROW))
-
-
Which regions are analyzed in the report?
-
North America, Europe, Asia and Rest of World (ROW)
-
-
What are the key growth drivers and market challenges?
-
Increasing antimicrobial resistance incidences, Stringent regulatory approval processes
-
-
Who are the major players in the Antibiotics Market?
-
Abbott Laboratories, AbbVie Inc., Aspen Pharmacare Ltd., Aurobindo Pharma Ltd., Bayer AG, Cipla Inc., F. Hoffmann La Roche Ltd., Flynn Pharma Ltd., GlaxoSmithKline Plc, Incepta Pharmaceuticals Ltd., Kenvue Inc., Lupin Ltd., Mayne Pharma Group Ltd., Melinta Therapeutics LLC, Merck KGaA, Otsuka Holdings Co. Ltd., Pfizer Inc., Sanofi SA, Sun Pharmaceutical Industries and Teva Pharmaceutical Ltd.
-
Market Research Insights
- The market is defined by a complex interplay of clinical and economic forces. The advancement of antibiotic stewardship programs has led to a more than 30% reduction in inappropriate antibiotic use in some hospital settings, directly influencing prescribing patterns and sales volumes. While this promotes long-term efficacy, it also challenges traditional revenue models.
- Geographically, market dynamics vary significantly; for example, Asia's market is projected to expand at a rate nearly 35% faster than Europe's, driven by different public health challenges and healthcare spending priorities.
- This divergence necessitates tailored strategies that account for regional differences in antimicrobial resistance mechanisms, regulatory pathways for new antibiotics, and the prevalence of public-private partnerships, which are becoming crucial for funding novel antibacterial agents and de-risking antibiotic discovery and development.
We can help! Our analysts can customize this antibiotics market research report to meet your requirements.
 RIA -
RIA - 
