APAC - Areca Nuts Market by Product and Type - Forecast and Analysis 2024-2028

APAC - Areca Nuts Market by Product and Type - Forecast and Analysis 2024-2028

Published: Jan 2024 139 Pages SKU: IRTNTR46703

Market Overview at a Glance

$3.94 B
Market Opportunity
6.59%
CAGR
5.97
YoY growth 2023-2024(%)

APAC - Areca Nuts Market 2024-2028

The APAC - Areca Nuts Market size is forecast to increase by USD 3.94 billion, at a CAGR of 6.59% between 2023 and 2028.

White areca nuts, also known as chali or ripe sun-dried nuts, are prominently cultivated and consumed in the southern regions of India, Bangladesh, Sri Lanka, and Myanmar. These nuts play a vital role in scented supari preparation and are often wrapped in betel leaves with other ingredients in the popular product, paan. The increasing consumption of paan among Indian consumers, coupled with the robust production of white areca nuts in the Asia-Pacific (APAC) region, are significant drivers fueling the growth of the white areca nuts market in APAC. Aikam Enterprises specializes in offering these betel nuts, sourced from tropical regions across the Pacific, Asia, and parts of East Africa.

Market: Overview

Areca Nuts Market in APAC Size

The market shows an accelerated CAGR during the forecast period.

To get additional information about the market report, Request Free Sample

 Market Growth Analysis Driver 

One of the key factors driving the market growth is the convenience of consuming areca nuts. Developing nations are transitioning toward urbanization. In addition, urbanization indicates a rise in the per capita annual household disposable income of consumers. Furthermore, the lifestyle and dietary habits of consumers have considerably changed over the last two decades.

Moreover, their fast-paced lifestyle has made it difficult for them to find time to prepare food from scratch. Therefore, they are looking for convenient, healthy food products that fulfill their daily nutrition requirements, are easy to eat, and can be consumed on the go. Furthermore, as areca nuts are convenient to consume and have high nutrition content, they are fast becoming the food of choice for busy people who want healthy snacking options that are convenient and filling. Hence, such factors are driving the market growth during the forecast period.

 Market Growth and Trends 

A key factor shaping the market growth is the prevalence of clean labeling and fair-trade practices. Clean labels are the major trend in the global food and beverages market, including APAC. For instance, the areca nuts market in India is undergoing a paradigm shift in how they are processed and harvested. Furthermore, consumers prefer recognizable and ethically sourced ingredients.

Moreover, small and large-scale producers of areca nuts in countries like India are increasingly adopting fair trade practices. For instance, even before the establishment of a regulated marketing framework, a significant improvement was observed in trade practices among private traders and commission agents. This is mainly due to the high ethical standards and fair-trade practices being adopted by the TSS SIRSI in Karnataka, India. Hence, such factors are driving the market growth during the forecast period.

Market Challenge 

Problems in the production and processing of areca nuts are one of the key challenges hindering market growth. One main issue is the susceptibility of areca palm plantations to various pests and diseases, resulting in a decline in nut quality and yield. In addition, farmers often struggle to implement effective pest control measures due to limited access to resources and knowledge, resulting in compromised production.

Moreover, outdated processing techniques contribute to the deterioration of areca nut quality. In addition, traditional methods are time-consuming and lack efficiency, leading to increased post-harvest losses. Furthermore, the absence of modern processing technologies hampers the production of high-quality areca nuts that meet international standards, limiting market competitiveness. Hence, such factors are hindering the market growth during the forecast period.

Market Segmentation by Type

The availability of diverse whole areca nut segment types will increase the market growth. In the Asia-Pacific (APAC) areca nuts market, whole areca nuts are available in several types, distinguished by their maturity, processing techniques, and regional preferences. In addition, mature areca nuts, recognized by their rich reddish-brown hue and firm shell, are favored for their robust flavor and higher tannin content. Moreover, raw areca nuts, harvested at maturity, possess a softer shell with a greenish tint and are often utilized for immediate consumption or further processing. In addition, processed variants undergo diverse treatments such as sun-drying, curing, or flavor coatings, aiming to enhance taste, reduce bitterness, or tailor them for specific uses. In addition, these processed areca nuts can be dried, roasted, or infused with flavors such as spices or sugar to cater to diverse tastes. Hence, such factors are fuelling the growth of this segment which in turn drives the market growth during the forecast period.

Market Segmentation by Product

The red areca nuts segment is estimated to witness significant growth during the forecast period. The red areca nuts segment is also referred to as tender or matured areca nuts, which are predominantly manufactured and consumed in the northern states of India, Taiwan, and China.  In addition, the red variety of areca nuts is usually more expensive than the white variety as its processing cost is higher than that of the white variety.

Areca Nuts Market in APAC Size

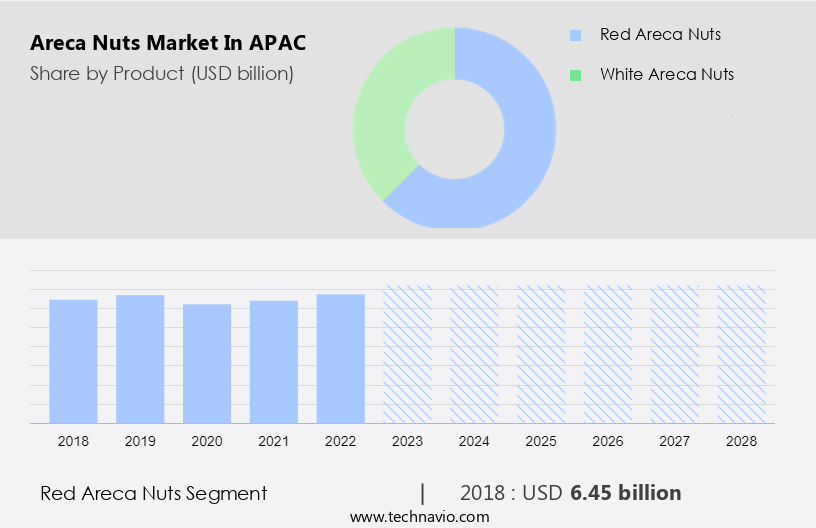
The red areca nuts segment was the largest segment and was valued at USD 6.45 billion in 2018. 

For a detailed summary of the market segments Request for Sample Report

Moreover, red areca nuts are predominantly used in the preparation of gutka (a chewing tobacco product made by crushing areca nuts, paraffin wax, catechu, and savory flavors), a product that is widely consumed in the Northern states of India. Furthermore, mouth fresheners made from the crushing of tender areca nuts are popular among Chinese consumers. In addition, the growing production levels of red areca nuts in Indian districts such as Shimoga, Chikmagalur, and Ernakulam and the Chinese province of Hunan and the growth in the number of organized retailing outlets are the major factors that are estimated to fuel the growth of the red areca nuts market in APAC during the forecast period.

Company Overview

Companies are implementing various strategies, such as strategic alliances, partnerships, mergers and acquisitions, geographical expansion, and product/service launches, to enhance their presence in the market forecasting growth and analysis.

  • Key Offering - CV. RASDI and CO: The company offers areca nuts such as betel nut lalee, betel nut whole, betel nut powder, and betel nut split.
  • Key Offering - Elias Export Import Ltd: The company offers areca nuts also known as betelnuts, available in split, whole, and diamond-cut.

The  market growth and forecasting report also includes detailed analyses of the competitive landscape of the market and information about 10 market companies, including:

GM Group, Lanka Guardian Commodities, PT Boymaxwell Indojaya Grup Inc, PT Makmur Kusuma Lestari, PT Swastika International, PT. Raja Putra Manggala, PT. Ruby Privatindo, Sandstone International Co. Ltd., SHRI GANESH PRASAD TRADERS, SUN IMPEX INTERNATIONAL FOODS LLC, Sutraco Group, and The CAMPCO Ltd.

The market analysis and report of qualitative and quantitative analysis of companies has been conducted to help clients understand the wider business environment as well as the strengths and weaknesses of key market players. Data is qualitatively analyzed to categorize companies as pure play, category-focused, industry-focused, and diversified; it is quantitatively analyzed to categorize companies as dominant, leading, strong, tentative, and weak.

Segment Overview

The research report forecasts market growth by revenue and provides an analysis of the latest trends and growth opportunities from 2018 to 2028. 

  • Product Outlook
    • Red areca nuts
    • White areca nuts
  • Type Outlook
    • Whole areca nuts
    • Process areca nuts

APAC Areca Nuts Market Scope

Report Coverage

Details

Page number

139

Base year

2023

Historic period

2018-2022

Forecast period

2024-2028

Growth momentum & CAGR

Accelerate at a CAGR of 6.59%

Market Growth 2024-2028

USD 3.94 billion

Market structure

Fragmented

YoY growth 2023-2024(%)

5.97

Competitive landscape

Leading Companies, Market Positioning of Companies, Competitive Strategies, and Industry Risks

Key companies profiled

Aikam Enterprises, CV. RASDI and CO., Elias Export Import Ltd., GM Group, Lanka Guardian Commodities, PT Boymaxwell Indojaya Grup Inc, PT Makmur Kusuma Lestari, PT Swastika International, PT. Raja Putra Manggala, PT. Ruby Privatindo, Sandstone International Co. Ltd., SHRI GANESH PRASAD TRADERS, SUN IMPEX INTERNATIONAL FOODS LLC, Sutraco Group, and The CAMPCO Ltd.

Market dynamics

Parent market analysis, Market growth inducers and obstacles, Fast-growing and slow-growing segment analysis, COVID-19 impact and recovery analysis and future consumer dynamics, and Market condition analysis for the forecast period.

Customization purview

If our report has not included the data that you are looking for, you can reach out to our analysts and get segments customized.

BUY NOW Full Report and Discover more

What are the Key Data Covered in this APAC Areca Nuts Market Research Report?

  • CAGR of the market during the forecast period
  • Detailed information on factors that will drive the growth of the APAC - Areca Nuts Market between 2024 and 2028
  • Precise estimation of the market size and its contribution to the market in focus on the parent market
  • Accurate predictions about upcoming market trends and analysis and changes in consumer behavior
  • Growth of the market across APAC
  • Thorough analysis of the market’s competitive landscape and detailed information about companies
  • Comprehensive market research and growth analysis of factors that will challenge the growth of market companies

We can help! Our analysts can customize this market research report to meet your requirements. Get in touch

1 Executive Summary

  • 1.1 Market overview
    • Exhibit 01: Executive Summary – Chart on Market Overview
    • Exhibit 02: Executive Summary – Data Table on Market Overview
    • Exhibit 03: Executive Summary – Chart on Country Market Characteristics
    • Exhibit 04: Executive Summary – Chart on Market by Geography
    • Exhibit 05: Executive Summary – Chart on Market Segmentation by Product
    • Exhibit 06: Executive Summary – Chart on Market Segmentation by Type
    • Exhibit 07: Executive Summary – Chart on Incremental Growth
    • Exhibit 08: Executive Summary – Data Table on Incremental Growth
    • Exhibit 09: Executive Summary – Chart on Vendor Market Positioning

2 Market Landscape

  • 2.1 Market ecosystem
    • Exhibit 10: Parent market
    • Exhibit 11: Market Characteristics

3 Market Sizing

  • 3.1 Market definition
    • Exhibit 12: Offerings of vendors included in the market definition
  • 3.2 Market segment analysis
    • Exhibit 13: Market segments
  • 3.3 Market size 2023
    • 3.4 Market outlook: Forecast for 2023-2028
      • Exhibit 14: Chart on APAC - Market size and forecast 2023-2028 ($ billion)
      • Exhibit 15: Data Table on Regional - Market size and forecast 2023-2028 ($ billion)
      • Exhibit 16: Chart on APAC: Year-over-year growth 2023-2028 (%)
      • Exhibit 17: Data Table on Regional - Market size and forecast 2023-2028 ($ billion)

    4 Historic Market Size

    • 4.1 Areca nuts market in APAC 2018 - 2022
      • Exhibit 18: Historic Market Size – Data Table on areca nuts market in APAC 2018 - 2022 ($ billion)
    • 4.2 Product Segment Analysis 2018 - 2022
      • Exhibit 19: Historic Market Size – Product Segment 2018 - 2022 ($ billion)
    • 4.3 Type Segment Analysis 2018 - 2022
      • Exhibit 20: Historic Market Size – Type Segment 2018 - 2022 ($ billion)
    • 4.4 Geography Segment Analysis 2018 - 2022
      • Exhibit 21: Historic Market Size – Geography Segment 2018 - 2022 ($ billion)

    5 Five Forces Analysis

    • 5.1 Five forces summary
      • Exhibit 22: Five forces analysis - Comparison between 2023 and 2028
    • 5.2 Bargaining power of buyers
      • Exhibit 23: Chart on Bargaining power of buyers – Impact of key factors 2023 and 2028
    • 5.3 Bargaining power of suppliers
      • Exhibit 24: Bargaining power of suppliers – Impact of key factors in 2023 and 2028
    • 5.4 Threat of new entrants
      • Exhibit 25: Threat of new entrants – Impact of key factors in 2023 and 2028
    • 5.5 Threat of substitutes
      • Exhibit 26: Threat of substitutes – Impact of key factors in 2023 and 2028
    • 5.6 Threat of rivalry
      • Exhibit 27: Threat of rivalry – Impact of key factors in 2023 and 2028
    • 5.7 Market condition
      • Exhibit 28: Chart on Market condition - Five forces 2023 and 2028

    6 Market Segmentation by Product

    • 6.1 Market segments
      • Exhibit 29: Chart on Product - Market share 2023-2028 (%)
      • Exhibit 30: Data Table on Product - Market share 2023-2028 (%)
    • 6.2 Comparison by Product
      • Exhibit 31: Chart on Comparison by Product
      • Exhibit 32: Data Table on Comparison by Product
    • 6.3 Red areca nuts - Market size and forecast 2023-2028
      • Exhibit 33: Chart on Red areca nuts - Market size and forecast 2023-2028 ($ billion)
      • Exhibit 34: Data Table on Red areca nuts - Market size and forecast 2023-2028 ($ billion)
      • Exhibit 35: Chart on Red areca nuts - Year-over-year growth 2023-2028 (%)
      • Exhibit 36: Data Table on Red areca nuts - Year-over-year growth 2023-2028 (%)
    • 6.4 White areca nuts - Market size and forecast 2023-2028
      • Exhibit 37: Chart on White areca nuts - Market size and forecast 2023-2028 ($ billion)
      • Exhibit 38: Data Table on White areca nuts - Market size and forecast 2023-2028 ($ billion)
      • Exhibit 39: Chart on White areca nuts - Year-over-year growth 2023-2028 (%)
      • Exhibit 40: Data Table on White areca nuts - Year-over-year growth 2023-2028 (%)
    • 6.5 Market opportunity by Product
      • Exhibit 41: Market opportunity by Product ($ billion)
      • Exhibit 42: Data Table on Market opportunity by Product ($ billion)

    7 Market Segmentation by Type

    • 7.1 Market segments
      • Exhibit 43: Chart on Type - Market share 2023-2028 (%)
      • Exhibit 44: Data Table on Type - Market share 2023-2028 (%)
    • 7.2 Comparison by Type
      • Exhibit 45: Chart on Comparison by Type
      • Exhibit 46: Data Table on Comparison by Type
    • 7.3 Whole areca nuts - Market size and forecast 2023-2028
      • Exhibit 47: Chart on Whole areca nuts - Market size and forecast 2023-2028 ($ billion)
      • Exhibit 48: Data Table on Whole areca nuts - Market size and forecast 2023-2028 ($ billion)
      • Exhibit 49: Chart on Whole areca nuts - Year-over-year growth 2023-2028 (%)
      • Exhibit 50: Data Table on Whole areca nuts - Year-over-year growth 2023-2028 (%)
    • 7.4 Process areca nuts - Market size and forecast 2023-2028
      • Exhibit 51: Chart on Process areca nuts - Market size and forecast 2023-2028 ($ billion)
      • Exhibit 52: Data Table on Process areca nuts - Market size and forecast 2023-2028 ($ billion)
      • Exhibit 53: Chart on Process areca nuts - Year-over-year growth 2023-2028 (%)
      • Exhibit 54: Data Table on Process areca nuts - Year-over-year growth 2023-2028 (%)
    • 7.5 Market opportunity by Type
      • Exhibit 55: Market opportunity by Type ($ billion)
      • Exhibit 56: Data Table on Market opportunity by Type ($ billion)

    8 Customer Landscape

    • 8.1 Customer landscape overview
      • Exhibit 57: Analysis of price sensitivity, lifecycle, customer purchase basket, adoption rates, and purchase criteria

    9 Geographic Landscape

    • 9.1 Geographic segmentation
      • Exhibit 58: Chart on Market share by geography - 2023-2028 (%)
      • Exhibit 59: Data Table on Market share by geography - 2023-2028 (%)
    • 9.2 Geographic comparison
      • Exhibit 60: Chart on Geographic comparison
      • Exhibit 61: Data Table on Geographic comparison
    • 9.3 India - Market size and forecast 2023-2028
      • Exhibit 62: Chart on India - Market size and forecast 2023-2028 ($ billion)
      • Exhibit 63: Data Table on India - Market size and forecast 2023-2028 ($ billion)
      • Exhibit 64: Chart on India - Year-over-year growth 2023-2028 (%)
      • Exhibit 65: Data Table on India - Year-over-year growth 2023-2028 (%)
    • 9.4 China - Market size and forecast 2023-2028
      • Exhibit 66: Chart on China - Market size and forecast 2023-2028 ($ billion)
      • Exhibit 67: Data Table on China - Market size and forecast 2023-2028 ($ billion)
      • Exhibit 68: Chart on China - Year-over-year growth 2023-2028 (%)
      • Exhibit 69: Data Table on China - Year-over-year growth 2023-2028 (%)
    • 9.5 Bangladesh - Market size and forecast 2023-2028
      • Exhibit 70: Chart on Bangladesh - Market size and forecast 2023-2028 ($ billion)
      • Exhibit 71: Data Table on Bangladesh - Market size and forecast 2023-2028 ($ billion)
      • Exhibit 72: Chart on Bangladesh - Year-over-year growth 2023-2028 (%)
      • Exhibit 73: Data Table on Bangladesh - Year-over-year growth 2023-2028 (%)
    • 9.6 Thailand - Market size and forecast 2023-2028
      • Exhibit 74: Chart on Thailand - Market size and forecast 2023-2028 ($ billion)
      • Exhibit 75: Data Table on Thailand - Market size and forecast 2023-2028 ($ billion)
      • Exhibit 76: Chart on Thailand - Year-over-year growth 2023-2028 (%)
      • Exhibit 77: Data Table on Thailand - Year-over-year growth 2023-2028 (%)
    • 9.7 Rest of APAC - Market size and forecast 2023-2028
      • Exhibit 78: Chart on Rest of APAC - Market size and forecast 2023-2028 ($ billion)
      • Exhibit 79: Data Table on Rest of APAC - Market size and forecast 2023-2028 ($ billion)
      • Exhibit 80: Chart on Rest of APAC - Year-over-year growth 2023-2028 (%)
      • Exhibit 81: Data Table on Rest of APAC - Year-over-year growth 2023-2028 (%)
    • 9.8 Market opportunity by geography
      • Exhibit 82: Market opportunity by geography ($ billion)
      • Exhibit 83: Data Table on Market opportunity by geography ($ billion)

    10 Drivers, Challenges, and Trends

    • 10.1 Market drivers
      • 10.2 Market challenges
        • 10.3 Impact of drivers and challenges
          • Exhibit 84: Impact of drivers and challenges in 2023 and 2028
        • 10.4 Market trends

          11 Vendor Landscape

          • 11.1 Overview
            • 11.2 Vendor landscape
              • Exhibit 85: Overview on Criticality of inputs and Factors of differentiation
            • 11.3 Landscape disruption
              • Exhibit 86: Overview on factors of disruption
            • 11.4 Industry risks
              • Exhibit 87: Impact of key risks on business

            12 Vendor Analysis

            • 12.1 Vendors covered
              • Exhibit 88: Vendors covered
            • 12.2 Market positioning of vendors
              • Exhibit 89: Matrix on vendor position and classification
            • 12.3 Aikam Enterprises
              • Exhibit 90: Aikam Enterprises - Overview
              • Exhibit 91: Aikam Enterprises - Product / Service
              • Exhibit 92: Aikam Enterprises - Key offerings
            • 12.4 CV. RASDI and CO.
              • Exhibit 93: CV. RASDI and CO. - Overview
              • Exhibit 94: CV. RASDI and CO. - Product / Service
              • Exhibit 95: CV. RASDI and CO. - Key offerings
            • 12.5 Elias Export Import Ltd.
              • Exhibit 96: Elias Export Import Ltd. - Overview
              • Exhibit 97: Elias Export Import Ltd. - Product / Service
              • Exhibit 98: Elias Export Import Ltd. - Key offerings
            • 12.6 GM Group
              • Exhibit 99: GM Group - Overview
              • Exhibit 100: GM Group - Product / Service
              • Exhibit 101: GM Group - Key offerings
            • 12.7 Lanka Guardian Commodities
              • Exhibit 102: Lanka Guardian Commodities - Overview
              • Exhibit 103: Lanka Guardian Commodities - Product / Service
              • Exhibit 104: Lanka Guardian Commodities - Key offerings
            • 12.8 PT Boymaxwell Indojaya Grup Inc
              • Exhibit 105: PT Boymaxwell Indojaya Grup Inc - Overview
              • Exhibit 106: PT Boymaxwell Indojaya Grup Inc - Product / Service
              • Exhibit 107: PT Boymaxwell Indojaya Grup Inc - Key offerings
            • 12.9 PT Makmur Kusuma Lestari
              • Exhibit 108: PT Makmur Kusuma Lestari - Overview
              • Exhibit 109: PT Makmur Kusuma Lestari - Product / Service
              • Exhibit 110: PT Makmur Kusuma Lestari - Key offerings
            • 12.10 PT Swastika International
              • Exhibit 111: PT Swastika International - Overview
              • Exhibit 112: PT Swastika International - Product / Service
              • Exhibit 113: PT Swastika International - Key offerings
            • 12.11 PT. Raja Putra Manggala
              • Exhibit 114: PT. Raja Putra Manggala - Overview
              • Exhibit 115: PT. Raja Putra Manggala - Product / Service
              • Exhibit 116: PT. Raja Putra Manggala - Key offerings
            • 12.12 PT. Ruby Privatindo
              • Exhibit 117: PT. Ruby Privatindo - Overview
              • Exhibit 118: PT. Ruby Privatindo - Product / Service
              • Exhibit 119: PT. Ruby Privatindo - Key offerings
            • 12.13 Sandstone International Co. Ltd.
              • Exhibit 120: Sandstone International Co. Ltd. - Overview
              • Exhibit 121: Sandstone International Co. Ltd. - Product / Service
              • Exhibit 122: Sandstone International Co. Ltd. - Key offerings
            • 12.14 SHRI GANESH PRASAD TRADERS
              • Exhibit 123: SHRI GANESH PRASAD TRADERS - Overview
              • Exhibit 124: SHRI GANESH PRASAD TRADERS - Product / Service
              • Exhibit 125: SHRI GANESH PRASAD TRADERS - Key offerings
            • 12.15 SUN IMPEX INTERNATIONAL FOODS LLC
              • Exhibit 126: SUN IMPEX INTERNATIONAL FOODS LLC - Overview
              • Exhibit 127: SUN IMPEX INTERNATIONAL FOODS LLC - Product / Service
              • Exhibit 128: SUN IMPEX INTERNATIONAL FOODS LLC - Key offerings
            • 12.16 Sutraco Group
              • Exhibit 129: Sutraco Group - Overview
              • Exhibit 130: Sutraco Group - Product / Service
              • Exhibit 131: Sutraco Group - Key offerings
            • 12.17 The CAMPCO Ltd.
              • Exhibit 132: The CAMPCO Ltd. - Overview
              • Exhibit 133: The CAMPCO Ltd. - Product / Service
              • Exhibit 134: The CAMPCO Ltd. - Key offerings

            13 Appendix

            • 13.1 Scope of the report
              • 13.2 Inclusions and exclusions checklist
                • Exhibit 135: Inclusions checklist
                • Exhibit 136: Exclusions checklist
              • 13.3 Currency conversion rates for US$
                • Exhibit 137: Currency conversion rates for US$
              • 13.4 Research methodology
                • Exhibit 138: Research methodology
                • Exhibit 139: Validation techniques employed for market sizing
                • Exhibit 140: Information sources
              • 13.5 List of abbreviations
                • Exhibit 141: List of abbreviations

              Research Methodology

              Technavio presents a detailed picture of the market by way of study, synthesis, and summation of data from multiple sources. The analysts have presented the various facets of the market with a particular focus on identifying the key industry influencers. The data thus presented is comprehensive, reliable, and the result of extensive research, both primary and secondary.

              INFORMATION SOURCES

              Primary sources

              • Manufacturers and suppliers
              • Channel partners
              • Industry experts
              • Strategic decision makers

              Secondary sources

              • Industry journals and periodicals
              • Government data
              • Financial reports of key industry players
              • Historical data
              • Press releases

              DATA ANALYSIS

              Data Synthesis

              • Collation of data
              • Estimation of key figures
              • Analysis of derived insights

              Data Validation

              • Triangulation with data models
              • Reference against proprietary databases
              • Corroboration with industry experts

              REPORT WRITING

              Qualitative

              • Market drivers
              • Market challenges
              • Market trends
              • Five forces analysis

              Quantitative

              • Market size and forecast
              • Market segmentation
              • Geographical insights
              • Competitive landscape

              Interested in this report?

              Get your sample now to see our research methodology and insights!

              Download Now

              Frequently Asked Questions

              Areca Nutsin APAC market growth will increase by $ 3.94 bn during 2024-2028 .

              The Areca Nutsin APAC market is expected to grow at a CAGR of 6.59% during 2024-2028 .

              Areca Nutsin APAC market is segmented by Product( Red areca nuts, White areca nuts) Type( Whole areca nuts, Process areca nuts, Bangladesh, Rest of APAC)

              Aikam Enterprises, CV. RASDI and CO., Elias Export Import Ltd., GM Group, Lanka Guardian Commodities, PT Boymaxwell Indojaya Grup Inc, PT Makmur Kusuma Lestari, PT Swastika International, PT. Raja Putra Manggala, PT. Ruby Privatindo, Sandstone International Co. Ltd., SHRI GANESH PRASAD TRADERS, SUN IMPEX INTERNATIONAL FOODS LLC, Sutraco Group, The CAMPCO Ltd. are a few of the key vendors in the Areca Nutsin APAC market.

              APAC will register the highest growth rate of 100% among the other regions. Therefore, the Areca Nutsin APAC market in APAC is expected to garner significant business opportunities for the vendors during the forecast period.

              India, China, Bangladesh, Thailand, Rest of APAC

              • Increasing alternative uses of areca nutsAreca nuts have found widescale applications as an alternative constituent in various industries. This is one of the major reasons behind the growth in demand and popularity of areca nuts in APAC. Areca nuts are used as a major ingredient in the preparation of products such as tea. For example is the driving factor this market.
              • a start-up based in India whose product portfolio includes areca tea in flavors such as ginger is the driving factor this market.
              • lemon is the driving factor this market.
              • mint is the driving factor this market.
              • and others. Furthermore is the driving factor this market.
              • the product has become widely popular in India and is even exported to countries like Russia is the driving factor this market.
              • the UK is the driving factor this market.
              • and Australia. Some of the other important alternative uses of areca nuts are provided below: Tannins are obtained as a byproduct after the processing of immature areca nuts is the driving factor this market.
              • which are predominantly used for masticatory purposes. Furthermore is the driving factor this market.
              • tannins are used in dyeing clothes is the driving factor this market.
              • tanning leather is the driving factor this market.
              • coloring foods is the driving factor this market.
              • and others. The husk of the areca nuts finds widescale application in the preparation of paperboards is the driving factor this market.
              • cushions is the driving factor this market.
              • hardboards is the driving factor this market.
              • and non-woven fabrics. The areca nut leaf sheath can be used in the manufacturing of plyboards is the driving factor this market.
              • tea chests is the driving factor this market.
              • throwaway cups is the driving factor this market.
              • and plates. The areca nuts contain 8%-12% fat is the driving factor this market.
              • which can be duly extracted and used for confectionery purposes. This refined fat is harder than cocoa butter and can be used for blending. Therefore is the driving factor this market.
              • the increasing number of alternative uses of areca nuts is expected to drive the growth of the areca nuts market in APAC during the forecast period. is the driving factor this market.

              The Areca Nutsin APAC market vendors should focus on grabbing business opportunities from the Red areca nuts segment as it accounted for the largest market share in the base year.