
US Artificial Lift Systems Market Size 2026-2030
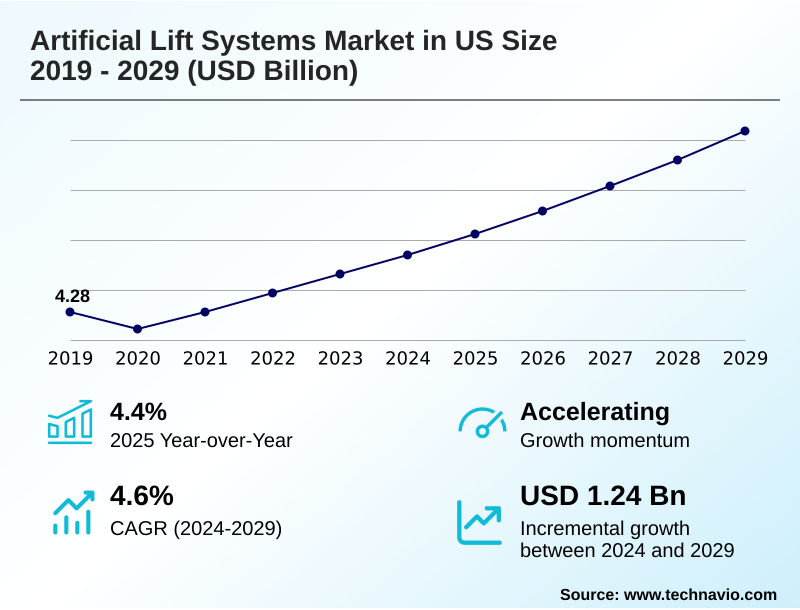
The us artificial lift systems market size is valued to increase by USD 1.28 billion, at a CAGR of 4.6% from 2025 to 2030. Increasing number of mature oilfields will drive the us artificial lift systems market.
Major Market Trends & Insights
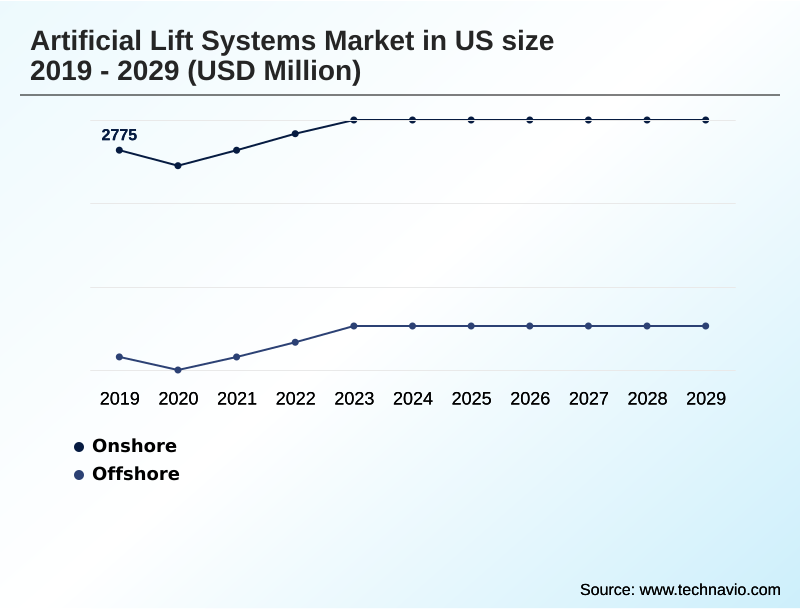
- By Application - Onshore segment was valued at USD 3.05 billion in 2024
- By Type - ESP systems segment accounted for the largest market revenue share in 2024
Market Size & Forecast
- Market Opportunities: USD 2.23 billion
- Market Future Opportunities: USD 1.28 billion
- CAGR from 2025 to 2030 : 4.6%
Market Summary
- The artificial lift systems market in US is fundamentally shaped by the dual demands of sustaining output from a vast inventory of mature oilfields and optimizing production from unconventional shale plays. As natural reservoir pressure declines, these systems become essential for economic viability.
- The market is characterized by a strong push toward technological advancement, particularly in digitalization and automation, to enhance efficiency and reduce operational costs. For instance, an operator in the Permian Basin leverages predictive maintenance analytics fed by a downhole sensor array to forecast a potential failure in an electric submersible pump (ESP).
- This allows for a planned intervention, preventing catastrophic failure and saving hundreds of thousands in lost production revenue and emergency repair costs. This scenario highlights the shift from reactive maintenance to proactive, data-driven well lifecycle management.
- Technical challenges, such as handling abrasive solids from hydraulic fracturing fluid and managing high gas-to-oil ratios, continue to drive innovation in pump design and materials science, including the use of abrasion-resistant materials and advanced gas handling devices to ensure wellbore integrity.
What will be the Size of the US Artificial Lift Systems Market during the forecast period?
Get Key Insights on Market Forecast (PDF) Get Free Sample
How is the US Artificial Lift Systems Market Segmented?
The us artificial lift systems industry research report provides comprehensive data (region-wise segment analysis), with forecasts and estimates in "USD million" for the period 2026-2030, as well as historical data from 2020-2024 for the following segments.
- Application
- Onshore
- Offshore
- Type
- ESP systems
- RLP systems
- PCP systems
- Others
- Component
- Pump
- Motor
- Cable systems
- Controller
- Others
- Geography
- North America
- US
- North America
By Application Insights
The onshore segment is estimated to witness significant growth during the forecast period.
The onshore segment dominates the artificial lift systems market in US, driven by vast unconventional plays where horizontal well pumping is standard.
These wells exhibit steep decline curves, with output often decreasing by up to 80% in the first two years, making early artificial lift installation essential for economic viability.
Demand is high for diverse technologies, from the rod lift pump (RLP) in mature wells to the high-volume electric submersible pump (ESP) in new shale completions. A key focus is on well lifecycle management, adapting systems as conditions change.
The relentless pursuit of efficiency has spurred adoption of the pump-off controller and production optimization software to reduce costs and maximize recovery from these complex assets.
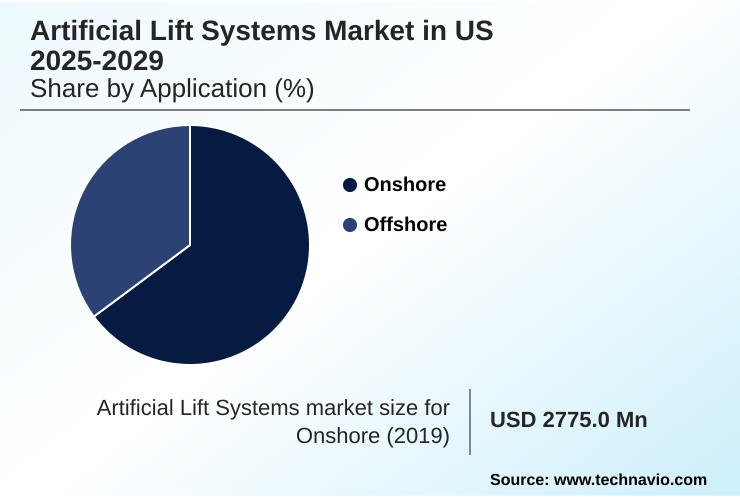
The Onshore segment was valued at USD 3.05 billion in 2024 and showed a gradual increase during the forecast period.
Market Dynamics
Our researchers analyzed the data with 2025 as the base year, along with the key drivers, trends, and challenges. A holistic analysis of drivers will help companies refine their marketing strategies to gain a competitive advantage.
- Strategic decision-making in the artificial lift systems market in us is increasingly complex, moving beyond simple hardware selection to a holistic analysis of operational economics. E&P companies now rigorously evaluate the total cost of ownership in artificial lift, comparing options such as pcp versus esp for viscous crude or assessing the viability of plunger lift for marginal gas wells.
- The technical nuances are critical; selecting esp systems for high gas-to-oil ratios requires advanced gas handling capabilities to prevent system failure. Similarly, improving esp run life in abrasive wells, where the impact of proppant on pump longevity is a major concern, involves specifying components with superior wear resistance, which can improve operational uptime by over 25% compared to standard models.
- Rod lift optimization for mature wells now heavily relies on automating pump-off control in rod lift systems to maximize efficiency. Furthermore, the push for ESG compliance is driving demand for surface equipment footprint reduction techniques and the use of variable speed drive for energy savings.
- This comprehensive approach, which includes digital oilfield integration for artificial lift and addresses challenges like managing fluid dynamics in unconventional wells, is essential to mitigate the high cost of artificial lift system failure.
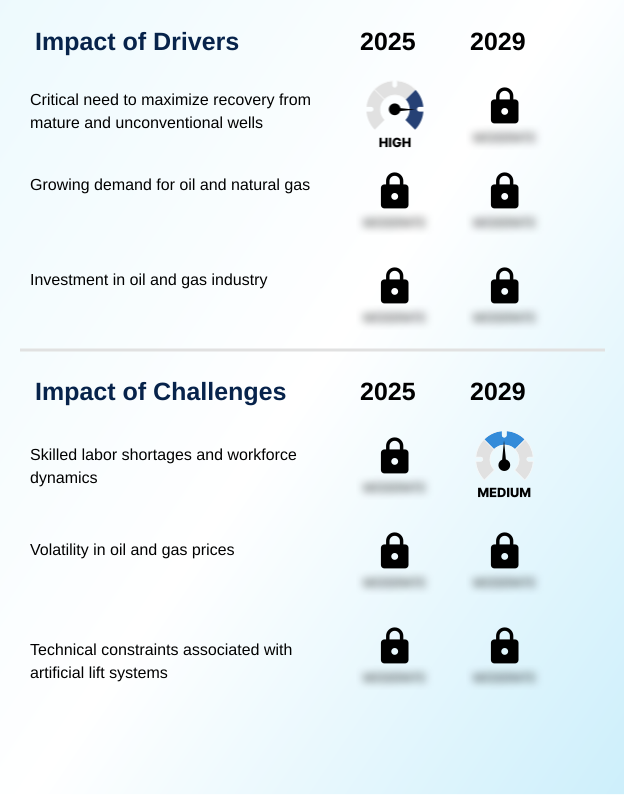
What are the key market drivers leading to the rise in the adoption of US Artificial Lift Systems Industry?
- A key market driver is the increasing number of mature oilfields, which necessitates the use of artificial lift systems to sustain production as natural reservoir pressure declines.
- Market growth is fundamentally driven by the vast number of mature wells requiring artificial lift and the rapid development of unconventional resources.
- The production profile of shale wells, with steep decline curves, accelerates the need for artificial lift installation to within the first year of operation. This has amplified demand for both established and advanced systems.
- The imperative for production optimization has led to the adoption of technologies that can reduce operational expenditures by over 15% through predictive maintenance.
- Solutions are increasingly tailored for harsh environments, demanding robust frac sand handling capability and advanced horizontal well pumping technologies.
What are the market trends shaping the US Artificial Lift Systems Industry?
- The integration of digitalization and automation represents a transformational market trend, shifting the focus from discrete mechanical hardware to intelligent, data-driven production platforms.
- A transformative trend is the pervasive integration of digitalization and automation, creating intelligent production platforms. This shift is driven by the need to manage unconventional wells, where production can decline by 70% in the first two years, necessitating advanced remote well monitoring. Deployment of predictive maintenance analytics can increase system uptime significantly.
- By using a multistage centrifugal pump coupled with real-time data from a downhole electric motor, operators are achieving production gains of up to 10%. This data-driven approach, central to total cost of ownership (TCO) calculations, optimizes performance and moves the industry beyond reactive repairs to proactive asset management.
What challenges does the US Artificial Lift Systems Industry face during its growth?
- The inherent volatility of crude oil prices represents a primary challenge, directly influencing capital expenditure and operational budgets across the exploration and production sector.
- The market faces significant hurdles from crude oil price volatility, which directly impacts capital spending on new installations. Technical challenges in unconventional reservoirs, such as high gas-to-oil ratio management and severe equipment erosion, are persistent. Premature equipment failures in these harsh environments can elevate intervention costs by over 40%, making reliability a critical concern.
- Furthermore, increasing ESG pressures demand more energy-efficient solutions. For example, some systems can be major consumers of electrical power, prompting a drive for innovations like the electrical submersible progressing cavity pump (ESPCP) that offer higher efficiency.
Exclusive Technavio Analysis on Customer Landscape
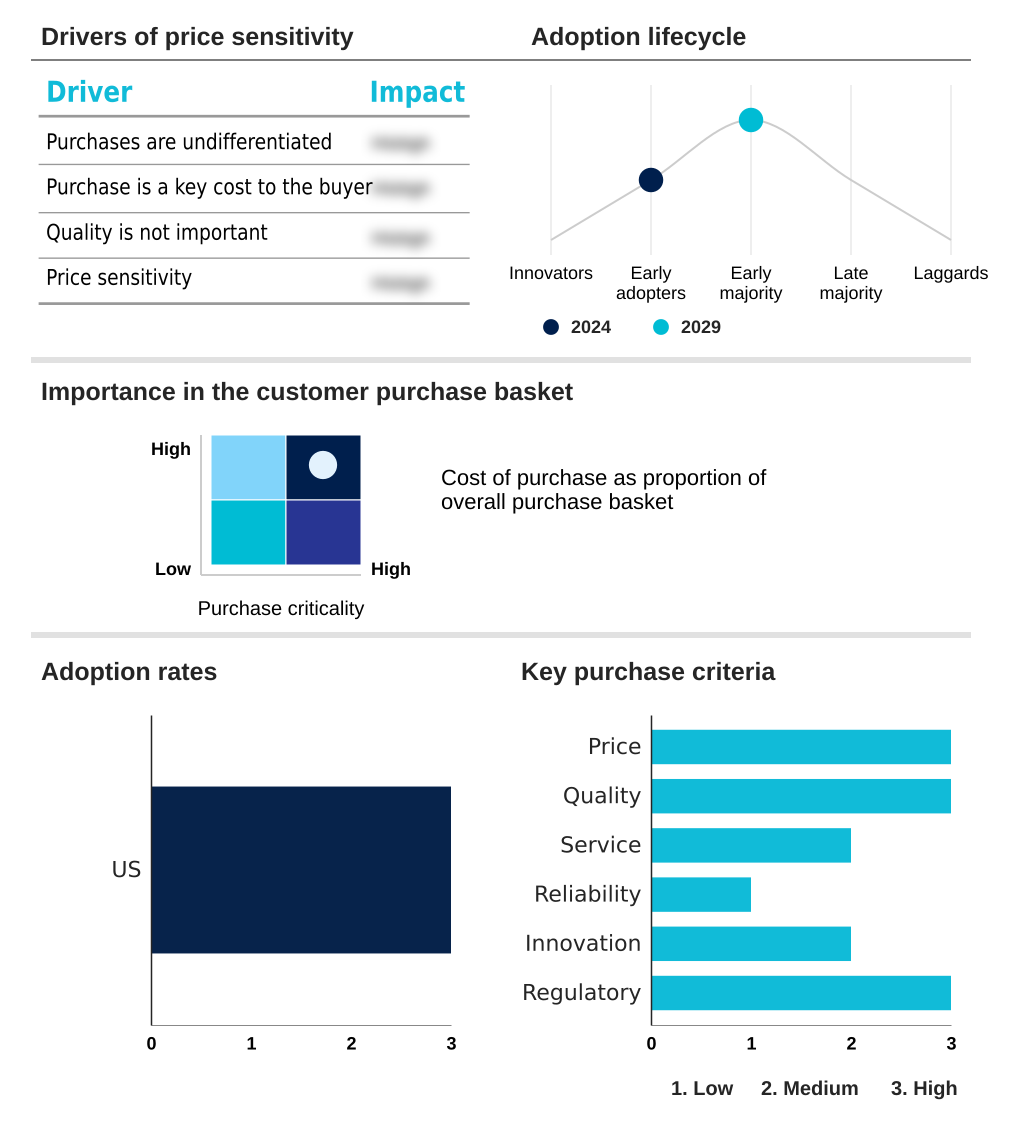
The us artificial lift systems market forecasting report includes the adoption lifecycle of the market, covering from the innovator’s stage to the laggard’s stage. It focuses on adoption rates in different regions based on penetration. Furthermore, the us artificial lift systems market report also includes key purchase criteria and drivers of price sensitivity to help companies evaluate and develop their market growth analysis strategies.
Customer Landscape of US Artificial Lift Systems Industry
Competitive Landscape
Companies are implementing various strategies, such as strategic alliances, us artificial lift systems market forecast, partnerships, mergers and acquisitions, geographical expansion, and product/service launches, to enhance their presence in the industry.
AccessESP - Analyzes rigless, retrievable electrical submersible pump systems that simplify deployment and reduce intervention costs, enhancing operational efficiency in artificial lift applications.
The industry research and growth report includes detailed analyses of the competitive landscape of the market and information about key companies, including:
- AccessESP
- Baker Hughes Co.
- Borets International Ltd.
- ChampionX Corp.
- DNOW Inc.
- Dover Corp.
- Flowserve Corp.
- General Electric Co.
- Halliburton Co.
- JJ Tech
- NOV Inc.
- Novomet Group
- Occidental Petroleum Corp.
- Schlumberger Ltd.
- Tenaris SA
- Valiant Artificial Lift Solutions LLC
- Weatherford International Plc
Qualitative and quantitative analysis of companies has been conducted to help clients understand the wider business environment as well as the strengths and weaknesses of key industry players. Data is qualitatively analyzed to categorize companies as pure play, category-focused, industry-focused, and diversified; it is quantitatively analyzed to categorize companies as dominant, leading, strong, tentative, and weak.
Recent Development and News in Us artificial lift systems market
- In October 2024, NETZSCH launched a hermetically sealed enhancement for its NEMO progressing cavity pumps, aimed at improving safety by eliminating the risk of toxic liquid and gas leakage.
- In November 2024, Halliburton Co. announced a strategic partnership to embed advanced AI-driven predictive analytics into its Summit ESP System, focusing on increasing equipment run-life in unconventional wells.
- In January 2025, production commenced at the Whale field in the US Gulf of Mexico, a deepwater project relying on highly sophisticated artificial lift technologies to operate in depths exceeding 8,600 feet.
- In March 2025, the Global Energy Monitor Organization's report on rising offshore discoveries highlighted increased demand for high-reliability artificial lift systems from US-based technology providers for global deepwater projects.
Dive into Technavio’s robust research methodology, blending expert interviews, extensive data synthesis, and validated models for unparalleled US Artificial Lift Systems Market insights. See full methodology.
| Market Scope | |
|---|---|
| Page number | 198 |
| Base year | 2025 |
| Historic period | 2020-2024 |
| Forecast period | 2026-2030 |
| Growth momentum & CAGR | Accelerate at a CAGR of 4.6% |
| Market growth 2026-2030 | USD 1275.5 million |
| Market structure | Fragmented |
| YoY growth 2025-2026(%) | 4.4% |
| Key countries | US |
| Competitive landscape | Leading Companies, Market Positioning of Companies, Competitive Strategies, and Industry Risks |
Research Analyst Overview
- The artificial lift systems market in us is undergoing a strategic evolution, compelling operators to adopt sophisticated technologies to maximize asset value. The integration of a downhole sensor array with an intelligent surface controller is no longer a niche capability but a core component of modern well lifecycle management.
- This shift is evident in the adoption of the permanent magnet motor and advanced variable speed drive (VSD), which together can reduce system energy consumption by over 25%, directly impacting operational expenditures. Boardroom decisions are increasingly influenced by the need to balance CAPEX with long-term reliability, driving demand for solutions featuring abrasion-resistant materials and superior gas handling devices.
- The selection of a gas lift system, rod lift pump (RLP), or progressing cavity pump (PCP) is now part of a larger optimization strategy. Technologies like the pump-off controller and robust downhole power cable are crucial for maintaining wellbore integrity and extending the life of assets, particularly when dealing with challenging hydraulic fracturing fluid and complex sucker rod string dynamics.
What are the Key Data Covered in this US Artificial Lift Systems Market Research and Growth Report?
-
What is the expected growth of the US Artificial Lift Systems Market between 2026 and 2030?
-
USD 1.28 billion, at a CAGR of 4.6%
-
-
What segmentation does the market report cover?
-
The report is segmented by Application (Onshore, and Offshore), Type (ESP systems, RLP systems, PCP systems, and Others), Component (Pump, Motor, Cable systems, Controller, and Others) and Geography (North America)
-
-
Which regions are analyzed in the report?
-
North America
-
-
What are the key growth drivers and market challenges?
-
Increasing number of mature oilfields, Impact of crude oil price volatility
-
-
Who are the major players in the US Artificial Lift Systems Market?
-
AccessESP, Baker Hughes Co., Borets International Ltd., ChampionX Corp., DNOW Inc., Dover Corp., Flowserve Corp., General Electric Co., Halliburton Co., JJ Tech, NOV Inc., Novomet Group, Occidental Petroleum Corp., Schlumberger Ltd., Tenaris SA, Valiant Artificial Lift Solutions LLC and Weatherford International Plc
-
Market Research Insights
- Market dynamics are increasingly shaped by a focus on maximizing recovery while minimizing operational expenditures, a trend accelerated by the unique production profiles of unconventional wells where output can decline by up to 80% in the first two years.
- This has spurred the adoption of intelligent technologies; for example, deploying an electrical submersible progressing cavity pump (ESPCP) with advanced controls has demonstrated production rate increases of up to 10% in specific applications. Operators are prioritizing total cost of ownership (TCO) over initial capital costs, favoring integrated systems that leverage production optimization software and remote well monitoring.
- This strategic shift improves the pump operational envelope and supports superior downhole fluid analysis, enhancing asset performance throughout its lifecycle.
We can help! Our analysts can customize this us artificial lift systems market research report to meet your requirements.
 RIA -
RIA - 
