Automotive Anti-pinch Power Window System Market Analysis, Size, and Forecast 2026-2030: APAC (Japan, China, and India), Europe (UK, Germany, and France), North America (US, Canada, and Mexico), Middle East and Africa (UAE, Saudi Arabia, and South Africa), South America (Brazil and Argentina), and Rest of World (ROW)

Automotive Anti-pinch Power Window System Market Analysis, Size, and Forecast 2026-2030:
APAC (Japan, China, and India), Europe (UK, Germany, and France), North America (US, Canada, and Mexico), Middle East and Africa (UAE, Saudi Arabia, and South Africa), South America (Brazil and Argentina), and Rest of World (ROW)

Published: Dec 2025 292 Pages SKU: IRTNTR44082

Market Overview at a Glance

$4.62 B
Market Opportunity
14%
CAGR 2025 - 2030
38.4%
APAC Growth
$3.40 B
Passenger vehicles segment 2024

Automotive Anti-pinch Power Window System Market Size 2026-2030

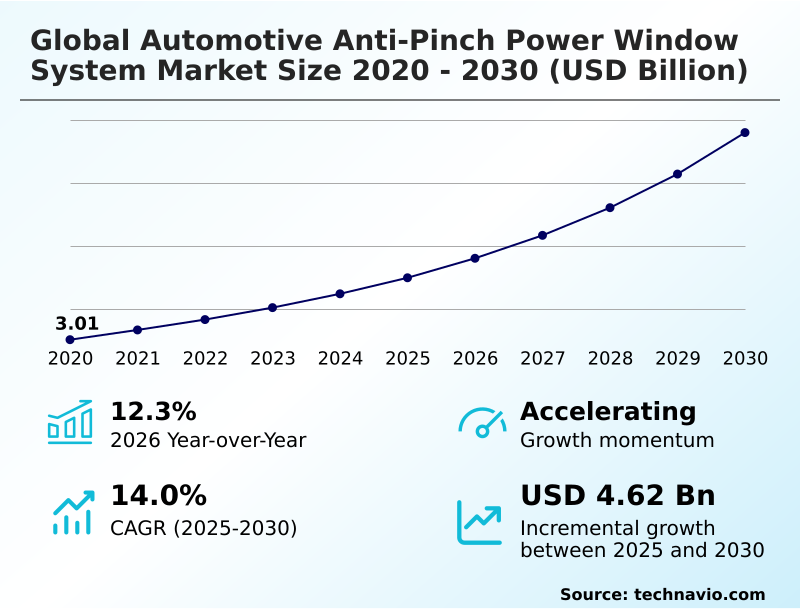
The automotive anti-pinch power window system market size is valued to increase by USD 4.62 billion, at a CAGR of 14% from 2025 to 2030. Increasing safety systems in automotive industry will drive the automotive anti-pinch power window system market.

Major Market Trends & Insights

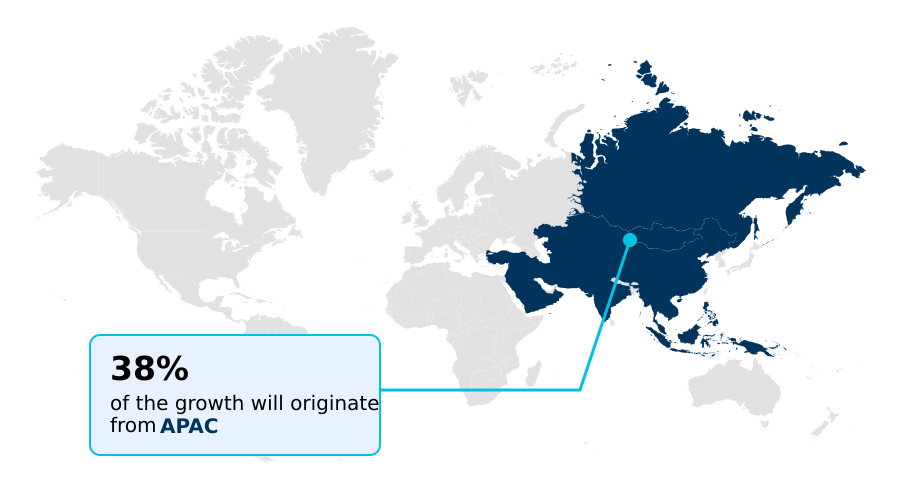
  • APAC dominated the market and accounted for a 38.4% growth during the forecast period.
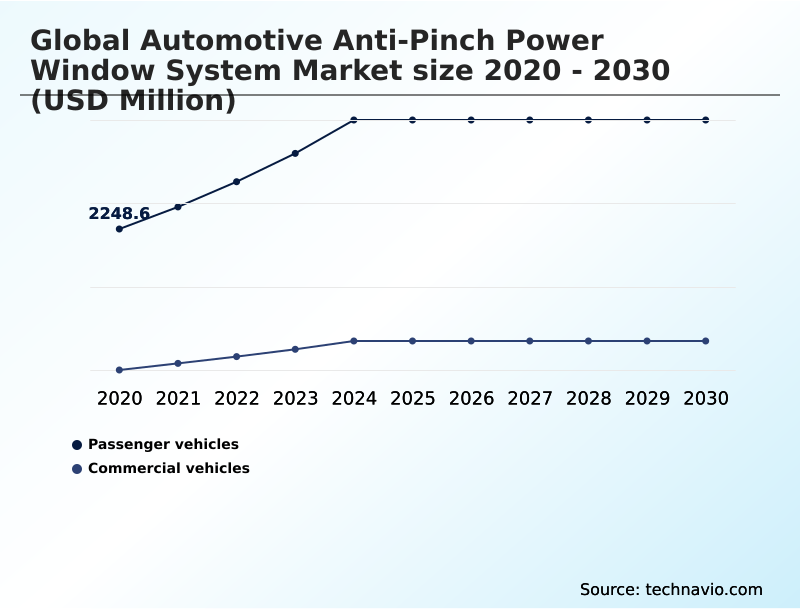
  • By Vehicle Type - Passenger vehicles segment was valued at USD 3.40 billion in 2024
  • By Channel - OEM segment accounted for the largest market revenue share in 2024

Market Size & Forecast

  • Market Opportunities: USD 6.59 billion
  • Market Future Opportunities: USD 4.62 billion
  • CAGR from 2025 to 2030 : 14%

Market Summary

What will be the Size of the Automotive Anti-pinch Power Window System Market during the forecast period?

Get Key Insights on Market Forecast (PDF) Request Free Sample

How is the Automotive Anti-pinch Power Window System Market Segmented?

The automotive anti-pinch power window system industry research report provides comprehensive data (region-wise segment analysis), with forecasts and estimates in "USD million" for the period 2026-2030, as well as historical data from 2020-2024 for the following segments.

  • Vehicle type
    • Passenger vehicles
    • Commercial vehicles
  • Channel
    • OEM
    • Aftermarket
  • Application
    • Front windows
    • Rear windows
    • Sunroof
  • Geography
    • APAC
      • Japan
      • China
      • India
    • Europe
      • UK
      • Germany
      • France
    • North America
      • US
      • Canada
      • Mexico
    • Middle East and Africa
      • UAE
      • Saudi Arabia
      • South Africa
    • South America
      • Brazil
      • Argentina
    • Rest of World (ROW)

By Vehicle Type Insights

The passenger vehicles segment is estimated to witness significant growth during the forecast period.

Request Free Sample

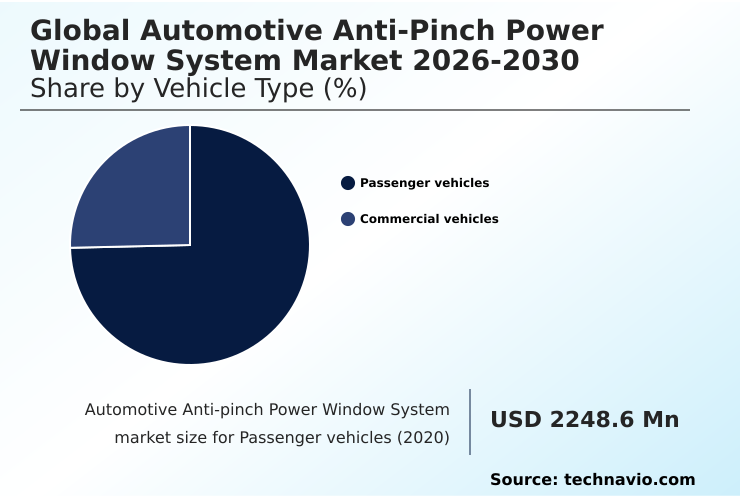
The Passenger vehicles segment was valued at USD 3.40 billion in 2024 and showed a gradual increase during the forecast period.

Request Free Sample

Regional Analysis

APAC is estimated to contribute 38.4% to the growth of the global market during the forecast period.Technavio’s analysts have elaborately explained the regional trends and drivers that shape the market during the forecast period.

See How Automotive Anti-pinch Power Window System Market Demand is Rising in APAC Request Free Sample

Market Dynamics

Our researchers analyzed the data with 2025 as the base year, along with the key drivers, trends, and challenges. A holistic analysis of drivers will help companies refine their marketing strategies to gain a competitive advantage.

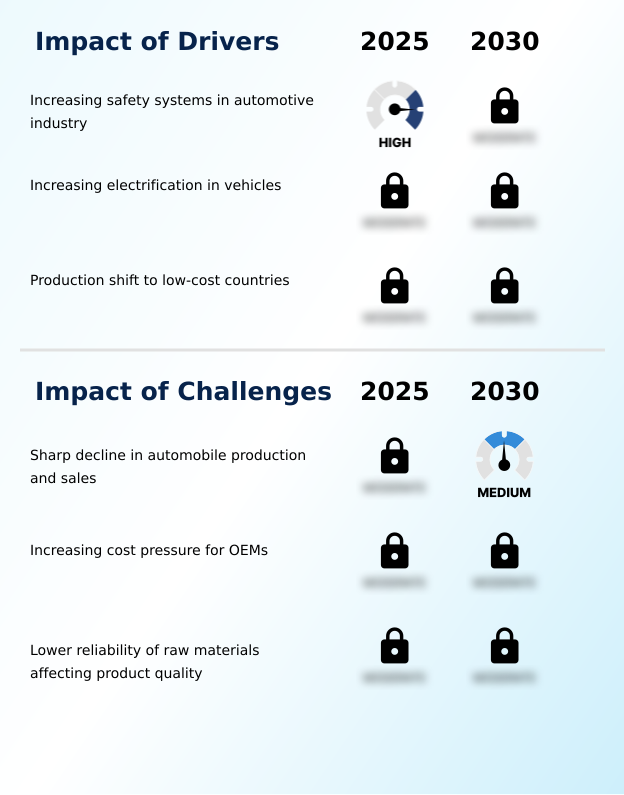
What are the key market drivers leading to the rise in the adoption of Automotive Anti-pinch Power Window System Industry?

What are the market trends shaping the Automotive Anti-pinch Power Window System Industry?

What challenges does the Automotive Anti-pinch Power Window System Industry face during its growth?

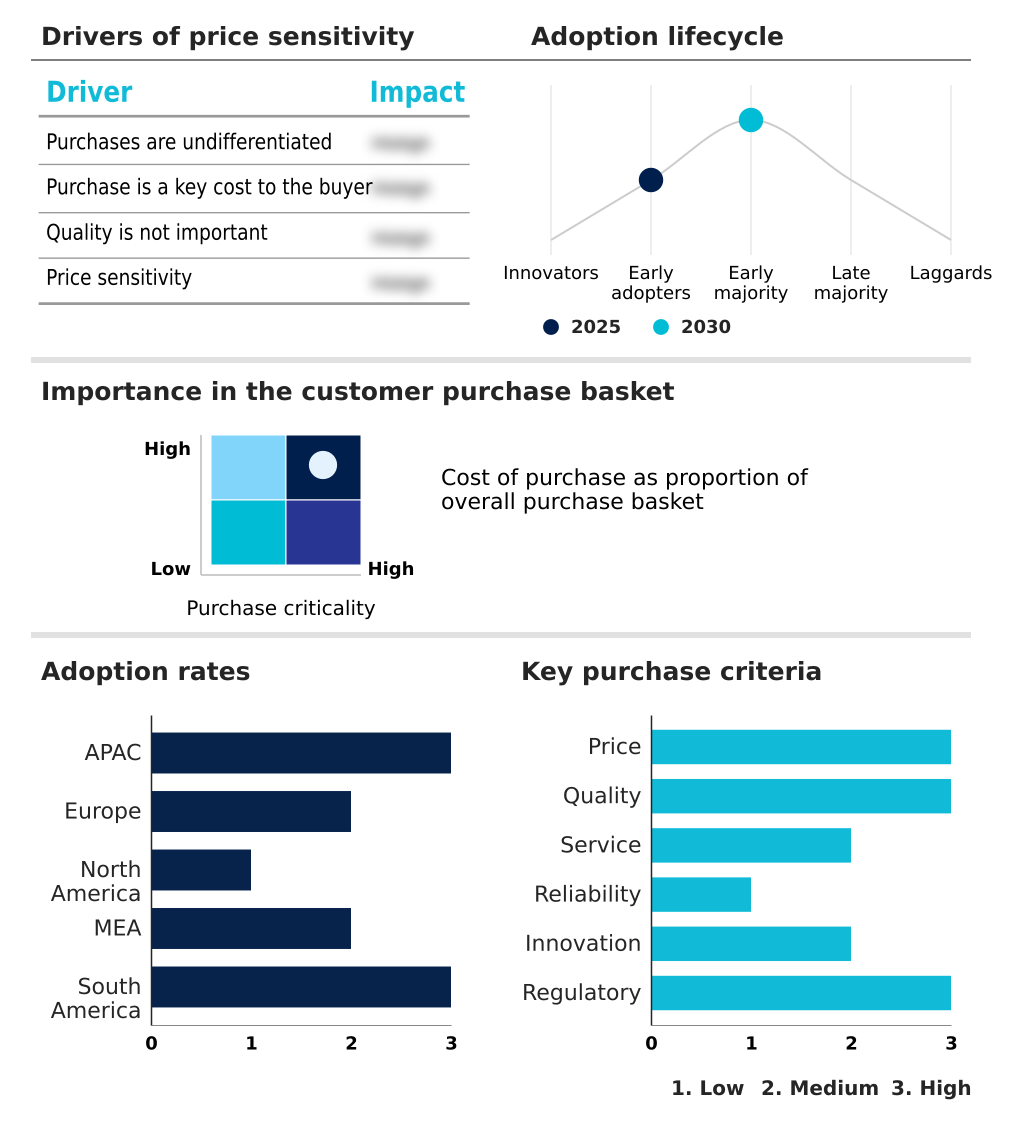
Exclusive Technavio Analysis on Customer Landscape

The automotive anti-pinch power window system market forecasting report includes the adoption lifecycle of the market, covering from the innovator’s stage to the laggard’s stage. It focuses on adoption rates in different regions based on penetration. Furthermore, the automotive anti-pinch power window system market report also includes key purchase criteria and drivers of price sensitivity to help companies evaluate and develop their market growth analysis strategies.

Customer Landscape of Automotive Anti-pinch Power Window System Industry

Competitive Landscape

Companies are implementing various strategies, such as strategic alliances, automotive anti-pinch power window system market forecast, partnerships, mergers and acquisitions, geographical expansion, and product/service launches, to enhance their presence in the industry.

Acsysteme -

The industry research and growth report includes detailed analyses of the competitive landscape of the market and information about key companies, including:

  • Acsysteme
  • Brose Fahrzeugteile SE and Co. KG
  • Continental AG
  • DENSO Corp.
  • Grupo Antolin Irausa SA
  • Inteva Products LLC
  • Johnson Electric Holdings Ltd.
  • Leopold Kostal GmbH and Co KG
  • LITE ON Technology Corp.
  • Mabuchi Motor Co. Ltd.
  • Magna International Inc.
  • Microchip Technology Inc.
  • Mitsuba Corp.
  • Nidec Corp.
  • NXP Semiconductors NV
  • Panasonic Holdings Corp.
  • Robert Bosch GmbH
  • Stoneridge Inc.
  • Texas Instruments Inc.
  • Valeo SA

Qualitative and quantitative analysis of companies has been conducted to help clients understand the wider business environment as well as the strengths and weaknesses of key industry players. Data is qualitatively analyzed to categorize companies as pure play, category-focused, industry-focused, and diversified; it is quantitatively analyzed to categorize companies as dominant, leading, strong, tentative, and weak.

Recent Development and News in Automotive anti-pinch power window system market

Dive into Technavio’s robust research methodology, blending expert interviews, extensive data synthesis, and validated models for unparalleled Automotive Anti-pinch Power Window System Market insights. See full methodology.

Market Scope
Page number 292
Base year 2025
Historic period 2020-2024
Forecast period 2026-2030
Growth momentum & CAGR Accelerate at a CAGR of 14%
Market growth 2026-2030 USD 4615.7 million
Market structure Fragmented
YoY growth 2025-2026(%) 12.3%
Key countries Japan, China, India, South Korea, Australia, Indonesia, UK, Germany, France, Italy, Spain, The Netherlands, US, Canada, Mexico, UAE, Saudi Arabia, South Africa, Israel, Turkey, Brazil, Argentina and Chile
Competitive landscape Leading Companies, Market Positioning of Companies, Competitive Strategies, and Industry Risks

Request Free Sample

Research Analyst Overview

What are the Key Data Covered in this Automotive Anti-pinch Power Window System Market Research and Growth Report?

  • What is the expected growth of the Automotive Anti-pinch Power Window System Market between 2026 and 2030?

    • USD 4.62 billion, at a CAGR of 14%

  • What segmentation does the market report cover?

    • The report is segmented by Vehicle Type (Passenger vehicles, and Commercial vehicles), Channel (OEM, and Aftermarket), Application (Front windows, Rear windows, and Sunroof) and Geography (APAC, Europe, North America, Middle East and Africa, South America)

  • Which regions are analyzed in the report?

    • APAC, Europe, North America, Middle East and Africa and South America

  • What are the key growth drivers and market challenges?

    • Increasing safety systems in automotive industry, Sharp decline in automobile production and sales

  • Who are the major players in the Automotive Anti-pinch Power Window System Market?

    • Acsysteme, Brose Fahrzeugteile SE and Co. KG, Continental AG, DENSO Corp., Grupo Antolin Irausa SA, Inteva Products LLC, Johnson Electric Holdings Ltd., Leopold Kostal GmbH and Co KG, LITE ON Technology Corp., Mabuchi Motor Co. Ltd., Magna International Inc., Microchip Technology Inc., Mitsuba Corp., Nidec Corp., NXP Semiconductors NV, Panasonic Holdings Corp., Robert Bosch GmbH, Stoneridge Inc., Texas Instruments Inc. and Valeo SA

Market Research Insights

We can help! Our analysts can customize this automotive anti-pinch power window system market research report to meet your requirements.

Get in touch

1. Executive Summary

1.1 Market overview

Executive Summary - Chart on Market Overview
Executive Summary - Data Table on Market Overview
Executive Summary - Chart on Global Market Characteristics
Executive Summary - Chart on Market by Geography
Executive Summary - Chart on Market Segmentation by Vehicle Type
Executive Summary - Chart on Market Segmentation by Channel
Executive Summary - Chart on Market Segmentation by Application
Executive Summary - Chart on Incremental Growth
Executive Summary - Data Table on Incremental Growth
Executive Summary - Chart on Company Market Positioning

2. Technavio Analysis

2.1 Analysis of price sensitivity, lifecycle, customer purchase basket, adoption rates, and purchase criteria

2.2 Criticality of inputs and Factors of differentiation

Chart on Overview on criticality of inputs and factors of differentiation

2.3 Factors of disruption

Chart on Overview on factors of disruption

2.4 Impact of drivers and challenges

Chart on Impact of drivers and challenges in 2025 and 2030

3. Market Landscape

3.1 Market ecosystem

Chart on Parent Market
Data Table on - Parent Market

3.2 Market characteristics

Chart on Market characteristics analysis

3.3 Value chain analysis

Chart on Value chain analysis

4. Market Sizing

4.1 Market definition

Data Table on Offerings of companies included in the market definition

4.2 Market segment analysis

Market segments

4.3 Market size 2025

4.4 Market outlook: Forecast for 2025-2030

Chart on Global - Market size and forecast 2025-2030 ($ million)
Data Table on Global - Market size and forecast 2025-2030 ($ million)
Chart on Global Market: Year-over-year growth 2025-2030 (%)
Data Table on Global Market: Year-over-year growth 2025-2030 (%)

5. Historic Market Size

5.1 Global Automotive Anti-Pinch Power Window System Market 2020 - 2024

Historic Market Size - Data Table on Global Automotive Anti-Pinch Power Window System Market 2020 - 2024 ($ million)

5.2 Vehicle Type segment analysis 2020 - 2024

Historic Market Size - Vehicle Type Segment 2020 - 2024 ($ million)

5.3 Channel segment analysis 2020 - 2024

Historic Market Size - Channel Segment 2020 - 2024 ($ million)

5.4 Application segment analysis 2020 - 2024

Historic Market Size - Application Segment 2020 - 2024 ($ million)

5.5 Geography segment analysis 2020 - 2024

Historic Market Size - Geography Segment 2020 - 2024 ($ million)

5.6 Country segment analysis 2020 - 2024

Historic Market Size - Country Segment 2020 - 2024 ($ million)

6. Qualitative Analysis

6.1 The AI impact on Global Automotive Anti-pinch Power Window System Market

7. Five Forces Analysis

7.1 Five forces summary

Five forces analysis - Comparison between 2025 and 2030

7.2 Bargaining power of buyers

Bargaining power of buyers - Impact of key factors 2025 and 2030

7.3 Bargaining power of suppliers

Bargaining power of suppliers - Impact of key factors in 2025 and 2030

7.4 Threat of new entrants

Threat of new entrants - Impact of key factors in 2025 and 2030

7.5 Threat of substitutes

Threat of substitutes - Impact of key factors in 2025 and 2030

7.6 Threat of rivalry

Threat of rivalry - Impact of key factors in 2025 and 2030

7.7 Market condition

Chart on Market condition - Five forces 2025 and 2030

8. Market Segmentation by Vehicle Type

8.1 Market segments

Chart on Vehicle Type - Market share 2025-2030 (%)
Data Table on Vehicle Type - Market share 2025-2030 (%)

8.2 Comparison by Vehicle Type

Chart on Comparison by Vehicle Type
Data Table on Comparison by Vehicle Type

8.3 Passenger vehicles - Market size and forecast 2025-2030

Chart on Passenger vehicles - Market size and forecast 2025-2030 ($ million)
Data Table on Passenger vehicles - Market size and forecast 2025-2030 ($ million)
Chart on Passenger vehicles - Year-over-year growth 2025-2030 (%)
Data Table on Passenger vehicles - Year-over-year growth 2025-2030 (%)

8.4 Commercial vehicles - Market size and forecast 2025-2030

Chart on Commercial vehicles - Market size and forecast 2025-2030 ($ million)
Data Table on Commercial vehicles - Market size and forecast 2025-2030 ($ million)
Chart on Commercial vehicles - Year-over-year growth 2025-2030 (%)
Data Table on Commercial vehicles - Year-over-year growth 2025-2030 (%)

8.5 Market opportunity by Vehicle Type

Market opportunity by Vehicle Type ($ million)
Data Table on Market opportunity by Vehicle Type ($ million)

9. Market Segmentation by Channel

9.1 Market segments

Chart on Channel - Market share 2025-2030 (%)
Data Table on Channel - Market share 2025-2030 (%)

9.2 Comparison by Channel

Chart on Comparison by Channel
Data Table on Comparison by Channel

9.3 OEM - Market size and forecast 2025-2030

Chart on OEM - Market size and forecast 2025-2030 ($ million)
Data Table on OEM - Market size and forecast 2025-2030 ($ million)
Chart on OEM - Year-over-year growth 2025-2030 (%)
Data Table on OEM - Year-over-year growth 2025-2030 (%)

9.4 Aftermarket - Market size and forecast 2025-2030

Chart on Aftermarket - Market size and forecast 2025-2030 ($ million)
Data Table on Aftermarket - Market size and forecast 2025-2030 ($ million)
Chart on Aftermarket - Year-over-year growth 2025-2030 (%)
Data Table on Aftermarket - Year-over-year growth 2025-2030 (%)

9.5 Market opportunity by Channel

Market opportunity by Channel ($ million)
Data Table on Market opportunity by Channel ($ million)

10. Market Segmentation by Application

10.1 Market segments

Chart on Application - Market share 2025-2030 (%)
Data Table on Application - Market share 2025-2030 (%)

10.2 Comparison by Application

Chart on Comparison by Application
Data Table on Comparison by Application

10.3 Front windows - Market size and forecast 2025-2030

Chart on Front windows - Market size and forecast 2025-2030 ($ million)
Data Table on Front windows - Market size and forecast 2025-2030 ($ million)
Chart on Front windows - Year-over-year growth 2025-2030 (%)
Data Table on Front windows - Year-over-year growth 2025-2030 (%)

10.4 Rear windows - Market size and forecast 2025-2030

Chart on Rear windows - Market size and forecast 2025-2030 ($ million)
Data Table on Rear windows - Market size and forecast 2025-2030 ($ million)
Chart on Rear windows - Year-over-year growth 2025-2030 (%)
Data Table on Rear windows - Year-over-year growth 2025-2030 (%)

10.5 Sunroof - Market size and forecast 2025-2030

Chart on Sunroof - Market size and forecast 2025-2030 ($ million)
Data Table on Sunroof - Market size and forecast 2025-2030 ($ million)
Chart on Sunroof - Year-over-year growth 2025-2030 (%)
Data Table on Sunroof - Year-over-year growth 2025-2030 (%)

10.6 Market opportunity by Application

Market opportunity by Application ($ million)
Data Table on Market opportunity by Application ($ million)

11. Customer Landscape

11.1 Customer landscape overview

Analysis of price sensitivity, lifecycle, customer purchase basket, adoption rates, and purchase criteria

12. Geographic Landscape

12.1 Geographic segmentation

Chart on Market share by geography 2025-2030 (%)
Data Table on Market share by geography 2025-2030 (%)

12.2 Geographic comparison

Chart on Geographic comparison
Data Table on Geographic comparison

12.3 APAC - Market size and forecast 2025-2030

Chart on APAC - Market size and forecast 2025-2030 ($ million)
Data Table on APAC - Market size and forecast 2025-2030 ($ million)
Chart on APAC - Year-over-year growth 2025-2030 (%)
Data Table on APAC - Year-over-year growth 2025-2030 (%)
Chart on Regional Comparison - APAC
Data Table on Regional Comparison - APAC

12.3.1 Japan - Market size and forecast 2025-2030

Chart on Japan - Market size and forecast 2025-2030 ($ million)
Data Table on Japan - Market size and forecast 2025-2030 ($ million)
Chart on Japan - Year-over-year growth 2025-2030 (%)
Data Table on Japan - Year-over-year growth 2025-2030 (%)

12.3.2 China - Market size and forecast 2025-2030

Chart on China - Market size and forecast 2025-2030 ($ million)
Data Table on China - Market size and forecast 2025-2030 ($ million)
Chart on China - Year-over-year growth 2025-2030 (%)
Data Table on China - Year-over-year growth 2025-2030 (%)

12.3.3 India - Market size and forecast 2025-2030

Chart on India - Market size and forecast 2025-2030 ($ million)
Data Table on India - Market size and forecast 2025-2030 ($ million)
Chart on India - Year-over-year growth 2025-2030 (%)
Data Table on India - Year-over-year growth 2025-2030 (%)

12.3.4 South Korea - Market size and forecast 2025-2030

Chart on South Korea - Market size and forecast 2025-2030 ($ million)
Data Table on South Korea - Market size and forecast 2025-2030 ($ million)
Chart on South Korea - Year-over-year growth 2025-2030 (%)
Data Table on South Korea - Year-over-year growth 2025-2030 (%)

12.3.5 Australia - Market size and forecast 2025-2030

Chart on Australia - Market size and forecast 2025-2030 ($ million)
Data Table on Australia - Market size and forecast 2025-2030 ($ million)
Chart on Australia - Year-over-year growth 2025-2030 (%)
Data Table on Australia - Year-over-year growth 2025-2030 (%)

12.3.6 Indonesia - Market size and forecast 2025-2030

Chart on Indonesia - Market size and forecast 2025-2030 ($ million)
Data Table on Indonesia - Market size and forecast 2025-2030 ($ million)
Chart on Indonesia - Year-over-year growth 2025-2030 (%)
Data Table on Indonesia - Year-over-year growth 2025-2030 (%)

12.4 Europe - Market size and forecast 2025-2030

Chart on Europe - Market size and forecast 2025-2030 ($ million)
Data Table on Europe - Market size and forecast 2025-2030 ($ million)
Chart on Europe - Year-over-year growth 2025-2030 (%)
Data Table on Europe - Year-over-year growth 2025-2030 (%)
Chart on Regional Comparison - Europe
Data Table on Regional Comparison - Europe

12.4.1 UK - Market size and forecast 2025-2030

Chart on UK - Market size and forecast 2025-2030 ($ million)
Data Table on UK - Market size and forecast 2025-2030 ($ million)
Chart on UK - Year-over-year growth 2025-2030 (%)
Data Table on UK - Year-over-year growth 2025-2030 (%)

12.4.2 Germany - Market size and forecast 2025-2030

Chart on Germany - Market size and forecast 2025-2030 ($ million)
Data Table on Germany - Market size and forecast 2025-2030 ($ million)
Chart on Germany - Year-over-year growth 2025-2030 (%)
Data Table on Germany - Year-over-year growth 2025-2030 (%)

12.4.3 France - Market size and forecast 2025-2030

Chart on France - Market size and forecast 2025-2030 ($ million)
Data Table on France - Market size and forecast 2025-2030 ($ million)
Chart on France - Year-over-year growth 2025-2030 (%)
Data Table on France - Year-over-year growth 2025-2030 (%)

12.4.4 Italy - Market size and forecast 2025-2030

Chart on Italy - Market size and forecast 2025-2030 ($ million)
Data Table on Italy - Market size and forecast 2025-2030 ($ million)
Chart on Italy - Year-over-year growth 2025-2030 (%)
Data Table on Italy - Year-over-year growth 2025-2030 (%)

12.4.5 Spain - Market size and forecast 2025-2030

Chart on Spain - Market size and forecast 2025-2030 ($ million)
Data Table on Spain - Market size and forecast 2025-2030 ($ million)
Chart on Spain - Year-over-year growth 2025-2030 (%)
Data Table on Spain - Year-over-year growth 2025-2030 (%)

12.4.6 The Netherlands - Market size and forecast 2025-2030

Chart on The Netherlands - Market size and forecast 2025-2030 ($ million)
Data Table on The Netherlands - Market size and forecast 2025-2030 ($ million)
Chart on The Netherlands - Year-over-year growth 2025-2030 (%)
Data Table on The Netherlands - Year-over-year growth 2025-2030 (%)

12.5 North America - Market size and forecast 2025-2030

Chart on North America - Market size and forecast 2025-2030 ($ million)
Data Table on North America - Market size and forecast 2025-2030 ($ million)
Chart on North America - Year-over-year growth 2025-2030 (%)
Data Table on North America - Year-over-year growth 2025-2030 (%)
Chart on Regional Comparison - North America
Data Table on Regional Comparison - North America

12.5.1 US - Market size and forecast 2025-2030

Chart on US - Market size and forecast 2025-2030 ($ million)
Data Table on US - Market size and forecast 2025-2030 ($ million)
Chart on US - Year-over-year growth 2025-2030 (%)
Data Table on US - Year-over-year growth 2025-2030 (%)

12.5.2 Canada - Market size and forecast 2025-2030

Chart on Canada - Market size and forecast 2025-2030 ($ million)
Data Table on Canada - Market size and forecast 2025-2030 ($ million)
Chart on Canada - Year-over-year growth 2025-2030 (%)
Data Table on Canada - Year-over-year growth 2025-2030 (%)

12.5.3 Mexico - Market size and forecast 2025-2030

Chart on Mexico - Market size and forecast 2025-2030 ($ million)
Data Table on Mexico - Market size and forecast 2025-2030 ($ million)
Chart on Mexico - Year-over-year growth 2025-2030 (%)
Data Table on Mexico - Year-over-year growth 2025-2030 (%)

12.6 Middle East and Africa - Market size and forecast 2025-2030

Chart on Middle East and Africa - Market size and forecast 2025-2030 ($ million)
Data Table on Middle East and Africa - Market size and forecast 2025-2030 ($ million)
Chart on Middle East and Africa - Year-over-year growth 2025-2030 (%)
Data Table on Middle East and Africa - Year-over-year growth 2025-2030 (%)
Chart on Regional Comparison - Middle East and Africa
Data Table on Regional Comparison - Middle East and Africa

12.6.1 UAE - Market size and forecast 2025-2030

Chart on UAE - Market size and forecast 2025-2030 ($ million)
Data Table on UAE - Market size and forecast 2025-2030 ($ million)
Chart on UAE - Year-over-year growth 2025-2030 (%)
Data Table on UAE - Year-over-year growth 2025-2030 (%)

12.6.2 Saudi Arabia - Market size and forecast 2025-2030

Chart on Saudi Arabia - Market size and forecast 2025-2030 ($ million)
Data Table on Saudi Arabia - Market size and forecast 2025-2030 ($ million)
Chart on Saudi Arabia - Year-over-year growth 2025-2030 (%)
Data Table on Saudi Arabia - Year-over-year growth 2025-2030 (%)

12.6.3 South Africa - Market size and forecast 2025-2030

Chart on South Africa - Market size and forecast 2025-2030 ($ million)
Data Table on South Africa - Market size and forecast 2025-2030 ($ million)
Chart on South Africa - Year-over-year growth 2025-2030 (%)
Data Table on South Africa - Year-over-year growth 2025-2030 (%)

12.6.4 Israel - Market size and forecast 2025-2030

Chart on Israel - Market size and forecast 2025-2030 ($ million)
Data Table on Israel - Market size and forecast 2025-2030 ($ million)
Chart on Israel - Year-over-year growth 2025-2030 (%)
Data Table on Israel - Year-over-year growth 2025-2030 (%)

12.6.5 Turkey - Market size and forecast 2025-2030

Chart on Turkey - Market size and forecast 2025-2030 ($ million)
Data Table on Turkey - Market size and forecast 2025-2030 ($ million)
Chart on Turkey - Year-over-year growth 2025-2030 (%)
Data Table on Turkey - Year-over-year growth 2025-2030 (%)

12.7 South America - Market size and forecast 2025-2030

Chart on South America - Market size and forecast 2025-2030 ($ million)
Data Table on South America - Market size and forecast 2025-2030 ($ million)
Chart on South America - Year-over-year growth 2025-2030 (%)
Data Table on South America - Year-over-year growth 2025-2030 (%)
Chart on Regional Comparison - South America
Data Table on Regional Comparison - South America

12.7.1 Brazil - Market size and forecast 2025-2030

Chart on Brazil - Market size and forecast 2025-2030 ($ million)
Data Table on Brazil - Market size and forecast 2025-2030 ($ million)
Chart on Brazil - Year-over-year growth 2025-2030 (%)
Data Table on Brazil - Year-over-year growth 2025-2030 (%)

12.7.2 Argentina - Market size and forecast 2025-2030

Chart on Argentina - Market size and forecast 2025-2030 ($ million)
Data Table on Argentina - Market size and forecast 2025-2030 ($ million)
Chart on Argentina - Year-over-year growth 2025-2030 (%)
Data Table on Argentina - Year-over-year growth 2025-2030 (%)

12.7.3 Chile - Market size and forecast 2025-2030

Chart on Chile - Market size and forecast 2025-2030 ($ million)
Data Table on Chile - Market size and forecast 2025-2030 ($ million)
Chart on Chile - Year-over-year growth 2025-2030 (%)
Data Table on Chile - Year-over-year growth 2025-2030 (%)

12.8 Market opportunity by geography

Market opportunity by geography ($ million)
Data Tables on Market opportunity by geography ($ million)

13. Drivers, Challenges, and Opportunity

13.1 Market drivers

Increasing safety systems in automotive industry
Increasing electrification in vehicles
Production shift to low-cost countries

13.2 Market challenges

Sharp decline in automobile production and sales
Increasing cost pressure for OEMs
Lower reliability of raw materials affecting product quality

13.3 Impact of drivers and challenges

Impact of drivers and challenges in 2025 and 2030

13.4 Market opportunities

Single motor for anti-pinch power window and soft-close door systems
Integration with gesture recognition system
Increasing popularity of additive manufacturing in automotive industry

14. Competitive Landscape

14.1 Overview

14.2

Overview on criticality of inputs and factors of differentiation

14.3 Landscape disruption

Overview on factors of disruption

14.4 Industry risks

Impact of key risks on business

15. Competitive Analysis

15.1 Companies profiled

Companies covered

15.2 Company ranking index

15.3 Market positioning of companies

Matrix on companies position and classification

15.4 Acsysteme

Acsysteme - Overview
Acsysteme - Product / Service
Acsysteme - Key offerings
SWOT

15.5 Brose Fahrzeugteile SE and Co. KG

Brose Fahrzeugteile SE and Co. KG - Overview
Brose Fahrzeugteile SE and Co. KG - Product / Service
Brose Fahrzeugteile SE and Co. KG - Key offerings
SWOT

15.6 Continental AG

Continental AG - Overview
Continental AG - Business segments
Continental AG - Key news
Continental AG - Key offerings
Continental AG - Segment focus
SWOT

15.7 DENSO Corp.

DENSO Corp. - Overview
DENSO Corp. - Business segments
DENSO Corp. - Key news
DENSO Corp. - Key offerings
DENSO Corp. - Segment focus
SWOT

15.8 Grupo Antolin Irausa SA

Grupo Antolin Irausa SA - Overview
Grupo Antolin Irausa SA - Product / Service
Grupo Antolin Irausa SA - Key offerings
SWOT

15.9 Inteva Products LLC

Inteva Products LLC - Overview
Inteva Products LLC - Product / Service
Inteva Products LLC - Key news
Inteva Products LLC - Key offerings
SWOT

15.10 Leopold Kostal GmbH and Co KG

Leopold Kostal GmbH and Co KG - Overview
Leopold Kostal GmbH and Co KG - Product / Service
Leopold Kostal GmbH and Co KG - Key offerings
SWOT

15.11 LITE ON Technology Corp.

LITE ON Technology Corp. - Overview
LITE ON Technology Corp. - Business segments
LITE ON Technology Corp. - Key news
LITE ON Technology Corp. - Key offerings
LITE ON Technology Corp. - Segment focus
SWOT

15.12 Magna International Inc.

Magna International Inc. - Overview
Magna International Inc. - Business segments
Magna International Inc. - Key news
Magna International Inc. - Key offerings
Magna International Inc. - Segment focus
SWOT

15.13 Microchip Technology Inc.

Microchip Technology Inc. - Overview
Microchip Technology Inc. - Business segments
Microchip Technology Inc. - Key news
Microchip Technology Inc. - Key offerings
Microchip Technology Inc. - Segment focus
SWOT

15.14 Mitsuba Corp.

Mitsuba Corp. - Overview
Mitsuba Corp. - Business segments
Mitsuba Corp. - Key offerings
Mitsuba Corp. - Segment focus
SWOT

15.15 NXP Semiconductors NV

NXP Semiconductors NV - Overview
NXP Semiconductors NV - Product / Service
NXP Semiconductors NV - Key offerings
SWOT

15.16 Panasonic Holdings Corp.

Panasonic Holdings Corp. - Overview
Panasonic Holdings Corp. - Business segments
Panasonic Holdings Corp. - Key news
Panasonic Holdings Corp. - Key offerings
Panasonic Holdings Corp. - Segment focus
SWOT

15.17 Robert Bosch GmbH

Robert Bosch GmbH - Overview
Robert Bosch GmbH - Product / Service
Robert Bosch GmbH - Key news
Robert Bosch GmbH - Key offerings
SWOT

15.18 Valeo SA

Valeo SA - Overview
Valeo SA - Business segments
Valeo SA - Key news
Valeo SA - Key offerings
Valeo SA - Segment focus
SWOT

16. Appendix

16.1 Scope of the report

Market definition
Objectives
Notes and caveats

16.2 Inclusions and exclusions checklist

Inclusions checklist
Exclusions checklist

16.3 Currency conversion rates for US$

16.4 Research methodology

16.5 Data procurement

Information sources

16.6 Data validation

16.7 Validation techniques employed for market sizing

16.8 Data synthesis

16.9 360 degree market analysis

16.10 List of abbreviations

Research Methodology

Technavio presents a detailed picture of the market by way of study, synthesis, and summation of data from multiple sources. The analysts have presented the various facets of the market with a particular focus on identifying the key industry influencers. The data thus presented is comprehensive, reliable, and the result of extensive research, both primary and secondary.

INFORMATION SOURCES

Primary sources

  • Manufacturers and suppliers
  • Channel partners
  • Industry experts
  • Strategic decision makers

Secondary sources

  • Industry journals and periodicals
  • Government data
  • Financial reports of key industry players
  • Historical data
  • Press releases

DATA ANALYSIS

Data Synthesis

  • Collation of data
  • Estimation of key figures
  • Analysis of derived insights

Data Validation

  • Triangulation with data models
  • Reference against proprietary databases
  • Corroboration with industry experts

REPORT WRITING

Qualitative

  • Market drivers
  • Market challenges
  • Market trends
  • Five forces analysis

Quantitative

  • Market size and forecast
  • Market segmentation
  • Geographical insights
  • Competitive landscape

Interested in this report?

Get your sample now to see our research methodology and insights!

Download Now

Frequently Asked Questions

Automotive Anti-pinch Power Window System market growth will increase by USD 4615.7 million during 2026-2030 .

The Automotive Anti-pinch Power Window System market is expected to grow at a CAGR of 14% during 2026-2030 .

Automotive Anti-pinch Power Window System market is segmented by Vehicle type (Passenger vehicles, Commercial vehicles) Channel (OEM, Aftermarket) Application (Front windows, Rear windows, Sunroof)

Acsysteme, Brose Fahrzeugteile SE and Co. KG, Continental AG, DENSO Corp., Grupo Antolin Irausa SA, Inteva Products LLC, Johnson Electric Holdings Ltd., Leopold Kostal GmbH and Co KG, LITE ON Technology Corp., Mabuchi Motor Co. Ltd., Magna International Inc., Microchip Technology Inc., Mitsuba Corp., Nidec Corp., NXP Semiconductors NV, Panasonic Holdings Corp., Robert Bosch GmbH, Stoneridge Inc., Texas Instruments Inc., Valeo SA are a few of the key vendors in the Automotive Anti-pinch Power Window System market.

APAC will register the highest growth rate of 38.4% among the other regions. Therefore, the Automotive Anti-pinch Power Window System market in APAC is expected to garner significant business opportunities for the vendors during the forecast period.

Japan, China, India, South Korea, Australia, Indonesia, UK, Germany, France, Italy, Spain, The Netherlands, US, Canada, Mexico, UAE, Saudi Arabia, South Africa, Israel, Turkey, Brazil, Argentina, Chile

  • Increasing safety systems in automotive industry is the driving factor this market.

The Automotive Anti-pinch Power Window System market vendors should focus on grabbing business opportunities from the Vehicle type segment as it accounted for the largest market share in the base year.