Automotive Diecast Scale Model Market Analysis North America, Europe, APAC, South America, Middle East and Africa - US, Japan, Germany, France, UK - Size and Forecast 2024-2028

Automotive Diecast Scale Model Market Analysis North America, Europe, APAC, South America, Middle East and Africa - US, Japan, Germany, France, UK - Size and Forecast 2024-2028

Published: Mar 2024 157 Pages SKU: IRTNTR43399

Market Overview at a Glance

$1.52 B
Market Opportunity
5.94%
CAGR
5.76
YoY growth 2023-2024(%)

Automotive Diecast Scale Model Market Size 2024-2028

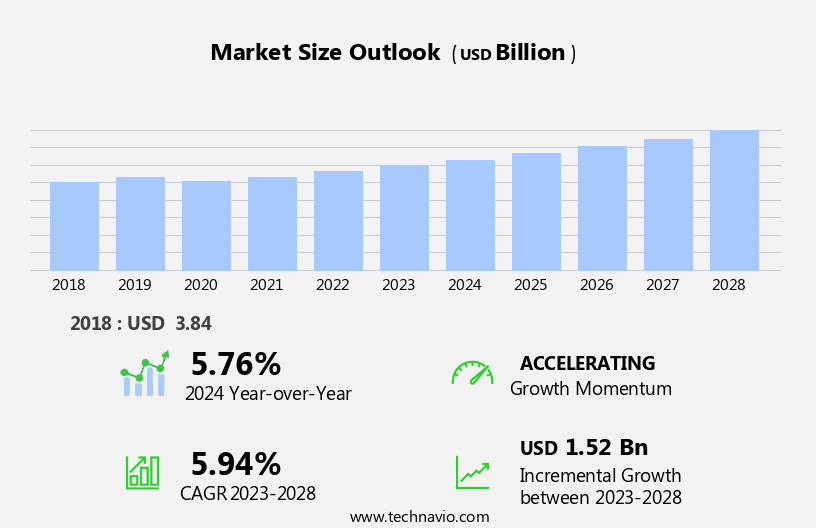
The automotive diecast scale model market size is forecast to increase by USD 1.52 trillion billion at a CAGR of 5.94% between 2023 and 2028.

  • The diecast scale model market exhibits significant growth potential, driven by several key trends. The high resale value of certain diecast models, particularly those representing vintage or limited-edition cars, continues to be a major market growth factor. Moreover, the rising focus on preservation and legacy revival among car enthusiasts is fueling demand for these collectibles. Consumer-specific cost constraints, however, pose a challenge to market growth. Despite this, the market is expected to witness steady expansion due to the enduring appeal of diecast models among automotive enthusiasts.
  • What will be the Size of the Automotive Diecast Scale Model Market During the Forecast Period?

    Automotive Diecast Scale Model Market Size

     Request Free Sample

  • The market encompasses the production and sale of replica versions of collectable automobiles in miniature form. This market caters to car enthusiasts seeking high-quality items that mirror the design, functionality, and aesthetics of their favorite automobiles. Production processes involve meticulous attention to detail, utilizing advanced technologies and materials such as lightweight chassis made of aluminum alloys. The market spans various sectors, including luxury vehicles, vintage models, and heritage cars. Collectors and hobbyists often prioritize authenticity and accuracy, driving demand for intricately detailed models. The application analysis of automotive diecast scale models extends beyond mere collectibles, with uses in automotive parts manufacturing, marketing, and educational purposes.
  • Key driving factors include the growing popularity of car culture and the increasing interest in electric vehicles. The collector's sector continues to thrive, with collector clubs and model display events fostering a vibrant community. EPA regulations and the shift towards sustainable materials, such as lightweight metals, also impact the market's direction. Overall, the market is a dynamic and evolving industry, catering to the diverse needs and passions of car enthusiasts worldwide.
  • How is this Automotive Diecast Scale Model Industry segmented and which is the largest segment?

    The automotive diecast scale model industry research report provides comprehensive data (region-wise segment analysis), with forecasts and estimates in "USD billion" for the period 2024-2028, as well as historical data from 2018-2022 for the following segments.

    • Type
      • Cars
      • Bikes
    • End-user
      • Collectors
      • Non-collectors
    • Material
      • Metal
      • Resin
      • Plastic
      • Alloy
      • Composite
    • License Type
      • License
      • Licensed
      • Unlicensed
      • Custom
    • Geography
      • North America
        • US
      • Europe
        • Germany
        • UK
        • France
      • APAC
        • Japan
      • South America
        • Middle East and Africa

        By Type Insights

        • The cars segment is estimated to witness significant growth during the forecast period.

        The market is experiencing growth due to increasing demand for both smaller and larger-scale models. While smaller models are often considered toy-quality items for children's play, such as slot racing, the cars segment is expected to expand significantly. Moreover, the vintage automobile sector is driving growth In the market, with collectors seeking authentic and licensed replica versions of luxury vehicles, such as the Bburago Ferrari SF 90 Stradale Signature Edition 1/18 and GT Spirit Mercedes Benz AMG S 63 Limited Edition Diamond White Bright 1/18. Production processes have advanced to include high-quality items with intricate detailing, appealing to collectors. The market also caters to automotive parts enthusiasts, offering lightweight chassis, electric vehicles, and heritage models.

        Sales channels include model display events, online retailers, and collector clubs. Consumer spending on these items is influenced by EPA regulations encouraging the use of lightweight metals, such as aluminum alloys, in production processes. Revenue generation In the market is subject to market competition and product authenticity.

        Automotive Diecast Scale Model Market Size

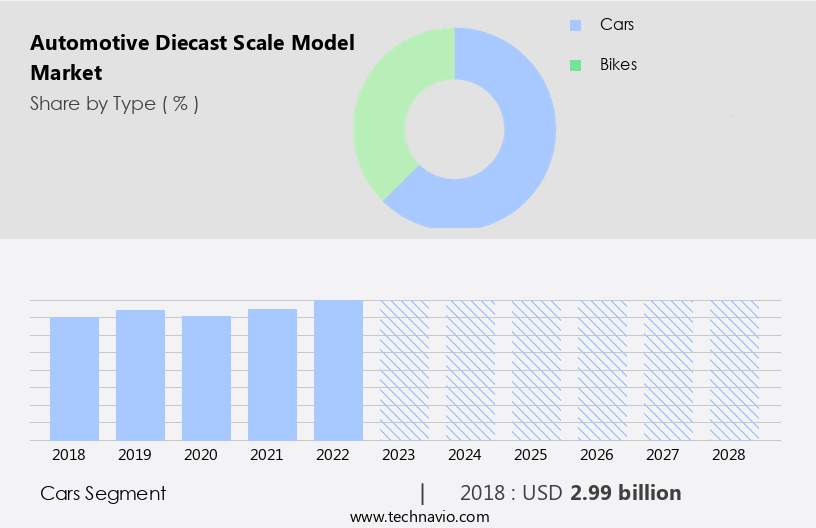
        Get a glance at the  Automotive Diecast Scale Model Industry report of share of various segments Request Free Sample

        The Cars segment was valued at USD 2.99 trillion billion in 2018 and showed a gradual increase during the forecast period.
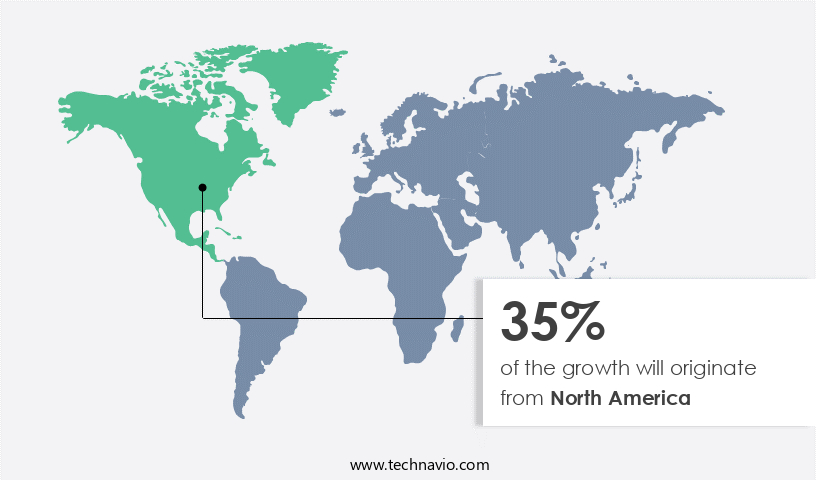
        Regional Analysis

        • North America is estimated to contribute 35% to the growth of the global market during the forecast period.

        Technavio’s analysts have elaborately explained the regional trends and drivers that shape the market during the forecast period.

        Automotive Diecast Scale Model Market Share by Geography

        For more insights on the market share of various regions, Request Free Sample

        The North American market for automotive diecast scale models is primarily driven by the United States, where consumers prioritize model quality and reliability. Collectors seek exclusivity, leading to a higher demand for premium models, despite moderate price sensitivity. Established brands benefit from this trend due to increased revenue generation. A significant collector community in North America, particularly In the US, fuels the demand for these models. The production process involves die-cast components, lightweight chassis, and high-quality items, including replica versions of luxury vehicles, automotive parts, vintage vehicles, and heritage models. EPA regulations encourage the use of lightweight metals, such as aluminum alloys, in manufacturing.

        Sales channels include model display events, online retailers, and collector clubs. Consumer spending on automotive diecast scale models continues to grow, with recyclability offering an added advantage. Market competition is intense, with emphasis on product authenticity and innovation.

        Market Dynamics

        Our  researchers analyzed the data with 2023 as the base year, along with the key drivers, trends, and challenges. A holistic analysis of drivers will help companies refine their marketing strategies to gain a competitive advantage.

        What are the key market drivers leading to the rise In the adoption of Automotive Diecast Scale Model Industry?

        Potential high resale value of certain diecast scale model is the key driver of the market.

      • The market caters to collectors of high-quality replica versions of collectable automobiles. Production processes for these models involve intricate detailing and the use of lightweight chassis, such as aluminum alloys, to maintain authenticity. The collector's sector's demand for luxury vehicles, electric vehicles, heritage models, and vintage vehicles drives revenue generation in this market. Diecast components are essential for these models, with model display events offering opportunities for collectors to showcase their prized possessions. Consumer spending on these models is influenced by product authenticity, sales channels, and EPA regulations regarding the use of lightweight metals in production. Diecast scale models are valuable collectibles due to their limited availability and the accrued appreciation cost from the base price.
      • Collectors aim to maximize the potential resale value of their collectibles, making the appreciation premium an essential factor. Market competition is fierce, with collectors seeking authentic and high-quality items from reputable manufacturers. The collectible automotive parts industry complements the Automotive Diecast market, offering opportunities for cross-promotion and expansion. The recyclability of diecast models also adds to their appeal, making them an eco-friendly alternative for car enthusiasts. Overall, the Automotive Diecast market is a niche but significant sector, catering to the unique needs and desires of collectors worldwide.
      • What are the market trends shaping the Automotive Diecast Scale Model Industry?

        Rising focus on preservation and legacy revival among car enthusiasts is the upcoming market trend.

      • Diecast scale models are highly sought-after collectibles In the automotive industry, catering to car enthusiasts' appreciation for automotive history and iconic vehicles. These meticulously crafted replicas capture the essence of classic designs and limited-edition releases, providing a tangible representation of automotive heritage. Diecast models are produced using various production processes, ensuring high-quality items that showcase intricate detail and authenticity. The collector's sector thrives on these collectibles, with a focus on luxury vehicles, automotive parts, and vintage models. Diecast components, including lightweight chassis and electric vehicles, are increasingly popular. Heritage models and collector clubs drive demand, with consumer spending on these items generating significant revenue.
      • Market competition is fierce, with manufacturers prioritizing product authenticity and sales channels to reach enthusiasts. EPA regulations and the adoption of lightweight metals, such as aluminum alloys, further influence the market. Model display events offer collectors a platform to showcase their collections, while the recyclability of diecast models adds to their appeal. Overall, diecast scale models serve as cherished items for car enthusiasts, reflecting their passion for automobiles and the industry's rich history.
      • What challenges does the Automotive Diecast Scale Model Industry face during its growth?

        Consumer-specific cost constraints is a key challenge affecting the industry growth.

      • The market experiences growth driven by car enthusiasts' demand for collectable automobiles in replica versions. Production processes for these high-quality items involve intricate detailing and the use of advanced materials like lightweight chassis made of aluminum alloys and electric vehicles. However, consumer spending is influenced by financial constraints, which may hinder the market's expansion due to the premium pricing associated with these models. Collectors and hobbyists continue to seek authenticity and attend model display events to showcase their die-cast collections. EPA regulations also impact the market, as manufacturers adapt to using recyclable materials and lightweight metals to meet sustainability standards.
      • Market competition remains fierce, with manufacturers focusing on product authenticity and sales channels to reach a broader audience. Despite cost constraints, the market continues to generate revenue and cater to the needs of collectors and car enthusiasts.
      • Exclusive Customer Landscape

        The automotive diecast scale model market forecasting report includes the adoption lifecycle of the market, covering from the innovator’s stage to the laggard’s stage. It focuses on adoption rates in different regions based on penetration. Furthermore, the automotive diecast scale model market report also includes key purchase criteria and drivers of price sensitivity to help companies evaluate and develop their market growth analysis strategies.
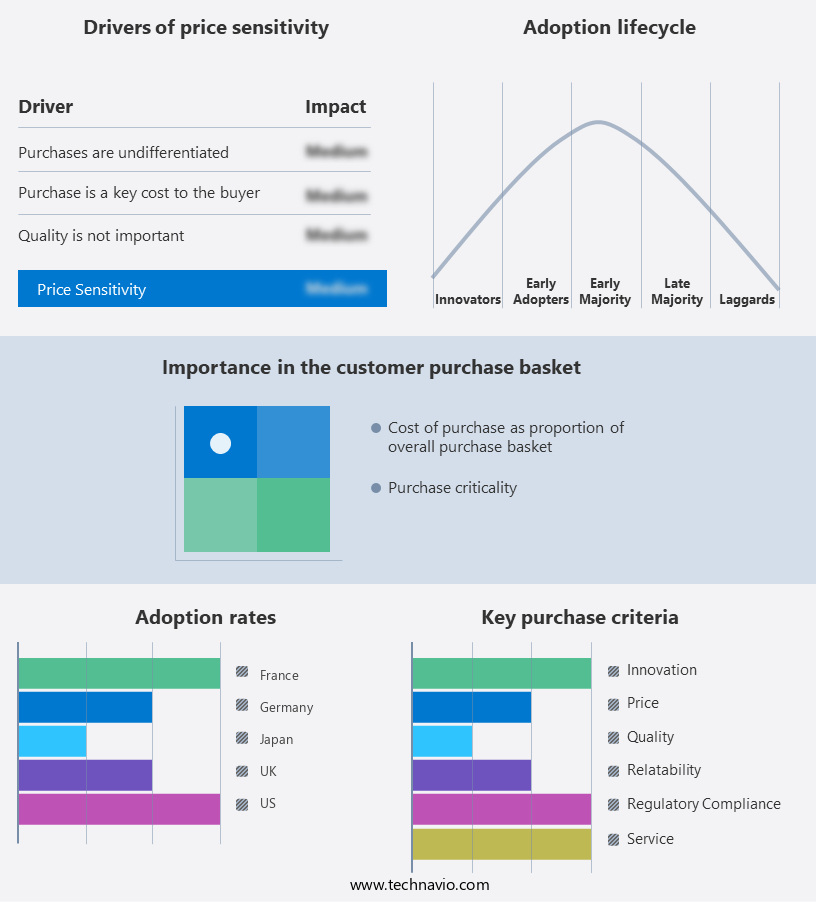
        Automotive Diecast Scale Model Market Share by Geography

         Customer Landscape

        Key Companies & Market Insights

        Companies are implementing various strategies, such as strategic alliances, automotive diecast scale model market forecast, partnerships, mergers and acquisitions, geographical expansion, and product/service launches, to enhance their presence In the industry.

        ACME Trading Co. - The company specializes In the distribution of authentic automotive diecast scale models, featuring renowned brands such as Alfa Romeo, Arrow Mclaren, and Aston Martin. These collectible replicas encompass iconic vehicles like the Alfa Romeo 8C 2300 Monza, Arrow Mclaren SP, and Aston Martin DB5 Vantage. With a commitment to accuracy and detail, these models cater to enthusiasts and collectors seeking high-quality representations of their favorite automobiles.

        The industry research and growth report includes detailed analyses of the competitive landscape of the market and information about key companies, including:

        • ACME Trading Co.
        • Amalgam Collection
        • Auto World Store
        • AUTOart
        • AutoCult GmbH
        • Automania India
        • Automodello
        • Corgi Model Club
        • Ducal LLC
        • GreenLight LLC
        • Hamleys of London Ltd.
        • KYOSHO Corp.
        • Mattel Inc.
        • May Cheong Group
        • Model Car World GmbH
        • Motormax Toy Factory Ltd.
        • Scale Arts India
        • Simba Dickie Group GmbH
        • Spark Models
        • Sun Star Models Development Ltd.
        • Welly Die Casting Factory Ltd.
        • Minimax Import and Export Co. Ltd.
        • Norev

        Qualitative and quantitative analysis of companies has been conducted to help clients understand the wider business environment as well as the strengths and weaknesses of key industry players. Data is qualitatively analyzed to categorize companies as pure play, category-focused, industry-focused, and diversified; it is quantitatively analyzed to categorize companies as dominant, leading, strong, tentative, and weak.

        Research Analyst Overview

        The market encompasses the production and distribution of replica versions of collectable automobiles. These intricately detailed models cater to car enthusiasts seeking authentic representations of their favorite vehicles. The market is driven by several factors, including the collector's sector's continued interest in luxury vehicles and heritage models. Production processes for these high-quality items involve meticulous attention to detail, often utilizing lightweight chassis and die-cast components made from various metals, such as aluminum alloys. The integration of electric vehicles into the market adds a modern twist, as collectors seek sustainable alternatives to traditional gasoline-powered models. The automotive parts industry plays a significant role In the diecast scale model market, with many manufacturers collaborating to create accurate and authentic replicas.

        The collaboration ensures product authenticity and enhances the overall consumer experience. Consumer spending In the market is influenced by various driving factors, including the desire for unique and rare items, nostalgia, and the appeal of owning a miniature version of a desirable vehicle. Collector clubs and model display events further fuel demand, providing platforms for enthusiasts to showcase their collections and connect with like-minded individuals. EPA regulations and the focus on recyclability have led to advancements In the production processes, with manufacturers exploring more sustainable materials and manufacturing methods. This not only benefits the environment but also adds value to the market by catering to the growing demand for eco-friendly products.

        The market competition is fierce, with numerous players vying for market share. Manufacturers differentiate themselves through product quality, innovation, and customer service. Revenue generation is achieved through various sales channels, including direct-to-consumer sales, retail stores, and online marketplaces. In conclusion, the market is a dynamic and evolving industry driven by the passion and dedication of car enthusiasts. The market's continued growth is fueled by innovation, collaboration, and a focus on sustainability, ensuring its relevance and appeal to collectors and enthusiasts worldwide.

        Market Scope

        Report Coverage

        Details

        Page number

        157

        Base year

        2023

        Historic period

        2018-2022

        Forecast period

        2024-2028

        Growth momentum & CAGR

        Accelerate at a CAGR of 5.94%

        Market growth 2024-2028

        USD 1.52 billion

        Market structure

        Fragmented

        YoY growth 2023-2024(%)

        5.76

        Key countries

        US, Japan, Germany, France, and UK

        Competitive landscape

        Leading Companies, Market Positioning of Companies, Competitive Strategies, and Industry Risks

        Request Free Sample

        What are the Key Data Covered in this Automotive Diecast Scale Model Market Research and Growth Report?

        • CAGR of the Automotive Diecast Scale Model industry during the forecast period
        • Detailed information on factors that will drive the growth and forecasting between 2024 and 2028
        • Precise estimation of the size of the market and its contribution of the industry in focus to the parent market
        • Accurate predictions about upcoming growth and trends and changes in consumer behaviour
        • Growth of the market across North America, Europe, APAC, South America, and Middle East and Africa
        • Thorough analysis of the market’s competitive landscape and detailed information about companies
        • Comprehensive analysis of factors that will challenge the automotive diecast scale model market growth of industry companies

        We can help! Our analysts can customize this automotive diecast scale model market research report to meet your requirements.

        Get in touch


        1 Executive Summary

        • 1.1 Market overview
          • Exhibit 01: Executive Summary – Chart on Market Overview
          • Exhibit 02: Executive Summary – Data Table on Market Overview
          • Exhibit 03: Executive Summary – Chart on Global Market Characteristics
          • Exhibit 04: Executive Summary – Chart on Market by Geography
          • Exhibit 05: Executive Summary – Chart on Market Segmentation by Type
          • Exhibit 06: Executive Summary – Chart on Market Segmentation by End-user
          • Exhibit 07: Executive Summary – Chart on Incremental Growth
          • Exhibit 08: Executive Summary – Data Table on Incremental Growth
          • Exhibit 09: Executive Summary – Chart on Vendor Market Positioning

        2 Market Landscape

        • 2.1 Market ecosystem
          • Exhibit 10: Parent market
          • Exhibit 11: Market Characteristics

        3 Market Sizing

        • 3.1 Market definition
          • Exhibit 12: Offerings of vendors included in the market definition
        • 3.2 Market segment analysis
          • Exhibit 13: Market segments
        • 3.3 Market size 2023
          • 3.4 Market outlook: Forecast for 2023-2028
            • Exhibit 14: Chart on Global - Market size and forecast 2023-2028 ($ million)
            • Exhibit 15: Data Table on Global - Market size and forecast 2023-2028 ($ million)
            • Exhibit 16: Chart on Global Market: Year-over-year growth 2023-2028 (%)
            • Exhibit 17: Data Table on Global Market: Year-over-year growth 2023-2028 (%)

          4 Historic Market Size

          • 4.1 Global automotive diecast scale model market 2018 - 2022
            • Exhibit 18: Historic Market Size – Data Table on global automotive diecast scale model market 2018 - 2022 ($ million)
          • 4.2 Type Segment Analysis 2018 - 2022
            • Exhibit 19: Historic Market Size – Type Segment 2018 - 2022 ($ million)
          • 4.3 End-user Segment Analysis 2018 - 2022
            • Exhibit 20: Historic Market Size – End-user Segment 2018 - 2022 ($ million)
          • 4.4 Geography Segment Analysis 2018 - 2022
            • Exhibit 21: Historic Market Size – Geography Segment 2018 - 2022 ($ million)
          • 4.5 Country Segment Analysis 2018 - 2022
            • Exhibit 22: Historic Market Size – Country Segment 2018 - 2022 ($ million)
          • 4.6 Global automotive diecast scale model market by Product Segment 2018 - 2022
            • Exhibit 23: Market Size (value) - Data Table on Global automotive diecast scale model market by Product Segment 2018 - 2022 ($ million)

          5 Five Forces Analysis

          • 5.1 Five forces summary
            • Exhibit 24: Five forces analysis - Comparison between 2023 and 2028
          • 5.2 Bargaining power of buyers
            • Exhibit 25: Chart on Bargaining power of buyers – Impact of key factors 2023 and 2028
          • 5.3 Bargaining power of suppliers
            • Exhibit 26: Bargaining power of suppliers – Impact of key factors in 2023 and 2028
          • 5.4 Threat of new entrants
            • Exhibit 27: Threat of new entrants – Impact of key factors in 2023 and 2028
          • 5.5 Threat of substitutes
            • Exhibit 28: Threat of substitutes – Impact of key factors in 2023 and 2028
          • 5.6 Threat of rivalry
            • Exhibit 29: Threat of rivalry – Impact of key factors in 2023 and 2028
          • 5.7 Market condition
            • Exhibit 30: Chart on Market condition - Five forces 2023 and 2028

          6 Market Segmentation by Type

          • 6.1 Market segments
            • Exhibit 31: Chart on Type - Market share 2023-2028 (%)
            • Exhibit 32: Data Table on Type - Market share 2023-2028 (%)
          • 6.2 Comparison by Type
            • Exhibit 33: Chart on Comparison by Type
            • Exhibit 34: Data Table on Comparison by Type
          • 6.3 Cars - Market size and forecast 2023-2028
            • Exhibit 35: Chart on Cars - Market size and forecast 2023-2028 ($ million)
            • Exhibit 36: Data Table on Cars - Market size and forecast 2023-2028 ($ million)
            • Exhibit 37: Chart on Cars - Year-over-year growth 2023-2028 (%)
            • Exhibit 38: Data Table on Cars - Year-over-year growth 2023-2028 (%)
          • 6.4 Bikes - Market size and forecast 2023-2028
            • Exhibit 39: Chart on Bikes - Market size and forecast 2023-2028 ($ million)
            • Exhibit 40: Data Table on Bikes - Market size and forecast 2023-2028 ($ million)
            • Exhibit 41: Chart on Bikes - Year-over-year growth 2023-2028 (%)
            • Exhibit 42: Data Table on Bikes - Year-over-year growth 2023-2028 (%)
          • 6.5 Market opportunity by Type
            • Exhibit 43: Market opportunity by Type ($ million)
            • Exhibit 44: Data Table on Market opportunity by Type ($ million)

          7 Market Segmentation by End-user

          • 7.1 Market segments
            • Exhibit 45: Chart on End-user - Market share 2023-2028 (%)
            • Exhibit 46: Data Table on End-user - Market share 2023-2028 (%)
          • 7.2 Comparison by End-user
            • Exhibit 47: Chart on Comparison by End-user
            • Exhibit 48: Data Table on Comparison by End-user
          • 7.3 Collectors - Market size and forecast 2023-2028
            • Exhibit 49: Chart on Collectors - Market size and forecast 2023-2028 ($ million)
            • Exhibit 50: Data Table on Collectors - Market size and forecast 2023-2028 ($ million)
            • Exhibit 51: Chart on Collectors - Year-over-year growth 2023-2028 (%)
            • Exhibit 52: Data Table on Collectors - Year-over-year growth 2023-2028 (%)
          • 7.4 Non-collectors - Market size and forecast 2023-2028
            • Exhibit 53: Chart on Non-collectors - Market size and forecast 2023-2028 ($ million)
            • Exhibit 54: Data Table on Non-collectors - Market size and forecast 2023-2028 ($ million)
            • Exhibit 55: Chart on Non-collectors - Year-over-year growth 2023-2028 (%)
            • Exhibit 56: Data Table on Non-collectors - Year-over-year growth 2023-2028 (%)
          • 7.5 Market opportunity by End-user
            • Exhibit 57: Market opportunity by End-user ($ million)
            • Exhibit 58: Data Table on Market opportunity by End-user ($ million)

          8 Market Segmentation by Material

          • 8.1 Market segments
            • Chart on Material - Market share (2023-2028) (%)
            • Data Table on Material - Market share (2023-2028) (%)
          • 8.2 Comparison by Material
            • Chart on Comparison by Material
            • Data Table on Comparison by Material
          • 8.3 Metal - Market size and forecast (2023-2028)
            • Chart on Metal - Market size and forecast (2023-2028) ($ million)
            • Data Table on Metal - Market size and forecast (2023-2028) ($ million)
            • Chart on Metal - Year-over-year growth (2023-2028) (%)
            • Data Table on Metal - Year-over-year growth (2023-2028) (%)
          • 8.4 Resin - Market size and forecast (2023-2028)
            • Chart on Resin - Market size and forecast (2023-2028) ($ million)
            • Data Table on Resin - Market size and forecast (2023-2028) ($ million)
            • Chart on Resin - Year-over-year growth (2023-2028) (%)
            • Data Table on Resin - Year-over-year growth (2023-2028) (%)
          • 8.5 Plastic - Market size and forecast (2023-2028)
            • Chart on Plastic - Market size and forecast (2023-2028) ($ million)
            • Data Table on Plastic - Market size and forecast (2023-2028) ($ million)
            • Chart on Plastic - Year-over-year growth (2023-2028) (%)
            • Data Table on Plastic - Year-over-year growth (2023-2028) (%)
          • 8.6 Alloy - Market size and forecast (2023-2028)
            • Chart on Alloy - Market size and forecast (2023-2028) ($ million)
            • Data Table on Alloy - Market size and forecast (2023-2028) ($ million)
            • Chart on Alloy - Year-over-year growth (2023-2028) (%)
            • Data Table on Alloy - Year-over-year growth (2023-2028) (%)
          • 8.7 Composite - Market size and forecast (2023-2028)
            • Chart on Composite - Market size and forecast (2023-2028) ($ million)
            • Data Table on Composite - Market size and forecast (2023-2028) ($ million)
            • Chart on Composite - Year-over-year growth (2023-2028) (%)
            • Data Table on Composite - Year-over-year growth (2023-2028) (%)
          • 8.8 Market opportunity by Material
            • Market opportunity by $segment_name ($ million)
            • Data Table on Market opportunity by $segment_name ($ million)

          9 Market Segmentation by License Type

          • 9.1 Market segments
            • Chart on License Type - Market share (2023-2028) (%)
            • Data Table on License Type - Market share (2023-2028) (%)
          • 9.2 Comparison by License Type
            • Chart on Comparison by License Type
            • Data Table on Comparison by License Type
          • 9.3 License - Market size and forecast (2023-2028)
            • Chart on License - Market size and forecast (2023-2028) ($ million)
            • Data Table on License - Market size and forecast (2023-2028) ($ million)
            • Chart on License - Year-over-year growth (2023-2028) (%)
            • Data Table on License - Year-over-year growth (2023-2028) (%)
          • 9.4 Licensed - Market size and forecast (2023-2028)
            • Chart on Licensed - Market size and forecast (2023-2028) ($ million)
            • Data Table on Licensed - Market size and forecast (2023-2028) ($ million)
            • Chart on Licensed - Year-over-year growth (2023-2028) (%)
            • Data Table on Licensed - Year-over-year growth (2023-2028) (%)
          • 9.5 Unlicensed - Market size and forecast (2023-2028)
            • Chart on Unlicensed - Market size and forecast (2023-2028) ($ million)
            • Data Table on Unlicensed - Market size and forecast (2023-2028) ($ million)
            • Chart on Unlicensed - Year-over-year growth (2023-2028) (%)
            • Data Table on Unlicensed - Year-over-year growth (2023-2028) (%)
          • 9.6 Custom - Market size and forecast (2023-2028)
            • Chart on Custom - Market size and forecast (2023-2028) ($ million)
            • Data Table on Custom - Market size and forecast (2023-2028) ($ million)
            • Chart on Custom - Year-over-year growth (2023-2028) (%)
            • Data Table on Custom - Year-over-year growth (2023-2028) (%)
          • 9.7 Market opportunity by License Type
            • Market opportunity by $segment_name ($ million)
            • Data Table on Market opportunity by $segment_name ($ million)

          8 Customer Landscape

          • 8.1 Customer landscape overview
            • Exhibit 59: Analysis of price sensitivity, lifecycle, customer purchase basket, adoption rates, and purchase criteria

          9 Geographic Landscape

          • 9.1 Geographic segmentation
            • Exhibit 60: Chart on Market share by geography 2023-2028 (%)
            • Exhibit 61: Data Table on Market share by geography 2023-2028 (%)
          • 9.2 Geographic comparison
            • Exhibit 62: Chart on Geographic comparison
            • Exhibit 63: Data Table on Geographic comparison
          • 9.3 North America - Market size and forecast 2023-2028
            • Exhibit 64: Chart on North America - Market size and forecast 2023-2028 ($ million)
            • Exhibit 65: Data Table on North America - Market size and forecast 2023-2028 ($ million)
            • Exhibit 66: Chart on North America - Year-over-year growth 2023-2028 (%)
            • Exhibit 67: Data Table on North America - Year-over-year growth 2023-2028 (%)
          • 9.4 Europe - Market size and forecast 2023-2028
            • Exhibit 68: Chart on Europe - Market size and forecast 2023-2028 ($ million)
            • Exhibit 69: Data Table on Europe - Market size and forecast 2023-2028 ($ million)
            • Exhibit 70: Chart on Europe - Year-over-year growth 2023-2028 (%)
            • Exhibit 71: Data Table on Europe - Year-over-year growth 2023-2028 (%)
          • 9.5 APAC - Market size and forecast 2023-2028
            • Exhibit 72: Chart on APAC - Market size and forecast 2023-2028 ($ million)
            • Exhibit 73: Data Table on APAC - Market size and forecast 2023-2028 ($ million)
            • Exhibit 74: Chart on APAC - Year-over-year growth 2023-2028 (%)
            • Exhibit 75: Data Table on APAC - Year-over-year growth 2023-2028 (%)
          • 9.6 South America - Market size and forecast 2023-2028
            • Exhibit 76: Chart on South America - Market size and forecast 2023-2028 ($ million)
            • Exhibit 77: Data Table on South America - Market size and forecast 2023-2028 ($ million)
            • Exhibit 78: Chart on South America - Year-over-year growth 2023-2028 (%)
            • Exhibit 79: Data Table on South America - Year-over-year growth 2023-2028 (%)
          • 9.7 Middle East and Africa - Market size and forecast 2023-2028
            • Exhibit 80: Chart on Middle East and Africa - Market size and forecast 2023-2028 ($ million)
            • Exhibit 81: Data Table on Middle East and Africa - Market size and forecast 2023-2028 ($ million)
            • Exhibit 82: Chart on Middle East and Africa - Year-over-year growth 2023-2028 (%)
            • Exhibit 83: Data Table on Middle East and Africa - Year-over-year growth 2023-2028 (%)
          • 9.8 US - Market size and forecast 2023-2028
            • Exhibit 84: Chart on US - Market size and forecast 2023-2028 ($ million)
            • Exhibit 85: Data Table on US - Market size and forecast 2023-2028 ($ million)
            • Exhibit 86: Chart on US - Year-over-year growth 2023-2028 (%)
            • Exhibit 87: Data Table on US - Year-over-year growth 2023-2028 (%)
          • 9.9 Germany - Market size and forecast 2023-2028
            • Exhibit 88: Chart on Germany - Market size and forecast 2023-2028 ($ million)
            • Exhibit 89: Data Table on Germany - Market size and forecast 2023-2028 ($ million)
            • Exhibit 90: Chart on Germany - Year-over-year growth 2023-2028 (%)
            • Exhibit 91: Data Table on Germany - Year-over-year growth 2023-2028 (%)
          • 9.10 France - Market size and forecast 2023-2028
            • Exhibit 92: Chart on France - Market size and forecast 2023-2028 ($ million)
            • Exhibit 93: Data Table on France - Market size and forecast 2023-2028 ($ million)
            • Exhibit 94: Chart on France - Year-over-year growth 2023-2028 (%)
            • Exhibit 95: Data Table on France - Year-over-year growth 2023-2028 (%)
          • 9.11 UK - Market size and forecast 2023-2028
            • Exhibit 96: Chart on UK - Market size and forecast 2023-2028 ($ million)
            • Exhibit 97: Data Table on UK - Market size and forecast 2023-2028 ($ million)
            • Exhibit 98: Chart on UK - Year-over-year growth 2023-2028 (%)
            • Exhibit 99: Data Table on UK - Year-over-year growth 2023-2028 (%)
          • 9.12 Japan - Market size and forecast 2023-2028
            • Exhibit 100: Chart on Japan - Market size and forecast 2023-2028 ($ million)
            • Exhibit 101: Data Table on Japan - Market size and forecast 2023-2028 ($ million)
            • Exhibit 102: Chart on Japan - Year-over-year growth 2023-2028 (%)
            • Exhibit 103: Data Table on Japan - Year-over-year growth 2023-2028 (%)
          • 9.13 Market opportunity by geography
            • Exhibit 104: Market opportunity by geography ($ million)
            • Exhibit 105: Data Tables on Market opportunity by geography ($ million)

          10 Drivers, Challenges, and Trends

          • 10.1 Market drivers
            • 10.2 Market challenges
              • 10.3 Impact of drivers and challenges
                • Exhibit 106: Impact of drivers and challenges in 2023 and 2028
              • 10.4 Market trends

                11 Vendor Landscape

                • 11.1 Overview
                  • 11.2 Vendor landscape
                    • Exhibit 107: Overview on Criticality of inputs and Factors of differentiation
                  • 11.3 Landscape disruption
                    • Exhibit 108: Overview on factors of disruption
                  • 11.4 Industry risks
                    • Exhibit 109: Impact of key risks on business

                  12 Vendor Analysis

                  • 12.1 Vendors covered
                    • Exhibit 110: Vendors covered
                  • 12.2 Market positioning of vendors
                    • Exhibit 111: Matrix on vendor position and classification
                  • 12.3 Amalgam Collection
                    • Exhibit 112: Amalgam Collection - Overview
                    • Exhibit 113: Amalgam Collection - Product / Service
                    • Exhibit 114: Amalgam Collection - Key offerings
                  • 12.4 Auto World Store
                    • Exhibit 115: Auto World Store - Overview
                    • Exhibit 116: Auto World Store - Product / Service
                    • Exhibit 117: Auto World Store - Key offerings
                  • 12.5 Automodello
                    • Exhibit 118: Automodello - Overview
                    • Exhibit 119: Automodello - Product / Service
                    • Exhibit 120: Automodello - Key offerings
                  • 12.6 Corgi Model Club
                    • Exhibit 121: Corgi Model Club - Overview
                    • Exhibit 122: Corgi Model Club - Product / Service
                    • Exhibit 123: Corgi Model Club - Key offerings
                  • 12.7 Ducal LLC
                    • Exhibit 124: Ducal LLC - Overview
                    • Exhibit 125: Ducal LLC - Product / Service
                    • Exhibit 126: Ducal LLC - Key offerings
                  • 12.8 GreenLight LLC
                    • Exhibit 127: GreenLight LLC - Overview
                    • Exhibit 128: GreenLight LLC - Product / Service
                    • Exhibit 129: GreenLight LLC - Key offerings
                  • 12.9 Hamleys of London Ltd.
                    • Exhibit 130: Hamleys of London Ltd. - Overview
                    • Exhibit 131: Hamleys of London Ltd. - Product / Service
                    • Exhibit 132: Hamleys of London Ltd. - Key offerings
                  • 12.10 KYOSHO Corp.
                    • Exhibit 133: KYOSHO Corp. - Overview
                    • Exhibit 134: KYOSHO Corp. - Product / Service
                    • Exhibit 135: KYOSHO Corp. - Key offerings
                  • 12.11 Mattel Inc.
                    • Exhibit 136: Mattel Inc. - Overview
                    • Exhibit 137: Mattel Inc. - Business segments
                    • Exhibit 138: Mattel Inc. - Key news
                    • Exhibit 139: Mattel Inc. - Key offerings
                    • Exhibit 140: Mattel Inc. - Segment focus
                  • 12.12 May Cheong Group
                    • Exhibit 141: May Cheong Group - Overview
                    • Exhibit 142: May Cheong Group - Product / Service
                    • Exhibit 143: May Cheong Group - Key offerings
                  • 12.13 Motormax Toy Factory Ltd.
                    • Exhibit 144: Motormax Toy Factory Ltd. - Overview
                    • Exhibit 145: Motormax Toy Factory Ltd. - Product / Service
                    • Exhibit 146: Motormax Toy Factory Ltd. - Key offerings
                  • 12.14 Norev
                    • Exhibit 147: Norev - Overview
                    • Exhibit 148: Norev - Product / Service
                    • Exhibit 149: Norev - Key offerings
                  • 12.15 Simba Dickie Group GmbH
                    • Exhibit 150: Simba Dickie Group GmbH - Overview
                    • Exhibit 151: Simba Dickie Group GmbH - Product / Service
                    • Exhibit 152: Simba Dickie Group GmbH - Key offerings
                  • 12.16 Spark Models
                    • Exhibit 153: Spark Models - Overview
                    • Exhibit 154: Spark Models - Product / Service
                    • Exhibit 155: Spark Models - Key offerings
                  • 12.17 Welly Die Casting Factory Ltd.
                    • Exhibit 156: Welly Die Casting Factory Ltd. - Overview
                    • Exhibit 157: Welly Die Casting Factory Ltd. - Product / Service
                    • Exhibit 158: Welly Die Casting Factory Ltd. - Key offerings

                  13 Appendix

                  • 13.1 Scope of the report
                    • 13.2 Inclusions and exclusions checklist
                      • Exhibit 159: Inclusions checklist
                      • Exhibit 160: Exclusions checklist
                    • 13.3 Currency conversion rates for US$
                      • Exhibit 161: Currency conversion rates for US$
                    • 13.4 Research methodology
                      • Exhibit 162: Research methodology
                      • Exhibit 163: Validation techniques employed for market sizing
                      • Exhibit 164: Information sources
                    • 13.5 List of abbreviations
                      • Exhibit 165: List of abbreviations

                    Research Methodology

                    Technavio presents a detailed picture of the market by way of study, synthesis, and summation of data from multiple sources. The analysts have presented the various facets of the market with a particular focus on identifying the key industry influencers. The data thus presented is comprehensive, reliable, and the result of extensive research, both primary and secondary.

                    INFORMATION SOURCES

                    Primary sources

                    • Manufacturers and suppliers
                    • Channel partners
                    • Industry experts
                    • Strategic decision makers

                    Secondary sources

                    • Industry journals and periodicals
                    • Government data
                    • Financial reports of key industry players
                    • Historical data
                    • Press releases

                    DATA ANALYSIS

                    Data Synthesis

                    • Collation of data
                    • Estimation of key figures
                    • Analysis of derived insights

                    Data Validation

                    • Triangulation with data models
                    • Reference against proprietary databases
                    • Corroboration with industry experts

                    REPORT WRITING

                    Qualitative

                    • Market drivers
                    • Market challenges
                    • Market trends
                    • Five forces analysis

                    Quantitative

                    • Market size and forecast
                    • Market segmentation
                    • Geographical insights
                    • Competitive landscape

                    Interested in this report?

                    Get your sample now to see our research methodology and insights!

                    Download Now

                    Frequently Asked Questions

                    Automotive Diecast Scale Model market growth will increase by $ 1.52 bn during 2024-2028.

                    The Automotive Diecast Scale Model market is expected to grow at a CAGR of 5.94% during 2024-2028.

                    Automotive Diecast Scale Model market is segmented by Type( Cars, Bikes) End-user( Collectors, Non-collectors)

                    ACME Trading Co., Amalgam Collection, Auto World Store, AUTOart, AutoCult GmbH, Automania India, Automodello, Corgi Model Club, Ducal LLC, GreenLight LLC, Hamleys of London Ltd., KYOSHO Corp., Mattel Inc., May Cheong Group, Model Car World GmbH, Motormax Toy Factory Ltd., Scale Arts India, Simba Dickie Group GmbH, Spark Models, Sun Star Models Development Ltd., Welly Die Casting Factory Ltd., Minimax Import and Export Co. Ltd., Norev are a few of the key vendors in the Automotive Diecast Scale Model market.

                    North America will register the highest growth rate of 35% among the other regions. Therefore, the Automotive Diecast Scale Model market in North America is expected to garner significant business opportunities for the vendors during the forecast period.

                    US, Japan, Germany, France, UK

                    • Potential high resale value of certain diecast scale modelAutomotive diecast scale models are akin to other usual collector items due to their uniqueness. However is the driving factor this market.
                    • limited availability and unviable shipping involving a few units raise product costs. For instance is the driving factor this market.
                    • an AUTOart model costs $200 due to high shipping charges. The few diecast model collectors that have purchased AUTOart models see high resale values for the products as they are available in limited numbers. The resale value of a diecast scale model becomes premium with accrued appreciation cost from the base price of the model if its exclusivity and demand increase. This suggests every collector would want to maximize the potential resale value of their collectible(s) is the driving factor this market.
                    • which necessitates an increase in appreciation premium. Hence is the driving factor this market.
                    • many serial collectors or professional agencies purchase collectible diecast models only to sell them at premium prices under favorable situations. This factor is expected to boost the growth of the global automotive diecast scale model market during the forecast period. is the driving factor this market.

                    The Automotive Diecast Scale Model market vendors should focus on grabbing business opportunities from the Cars segment as it accounted for the largest market share in the base year.