Automotive Paintless Dent Removal Tools Market Size 2024-2028
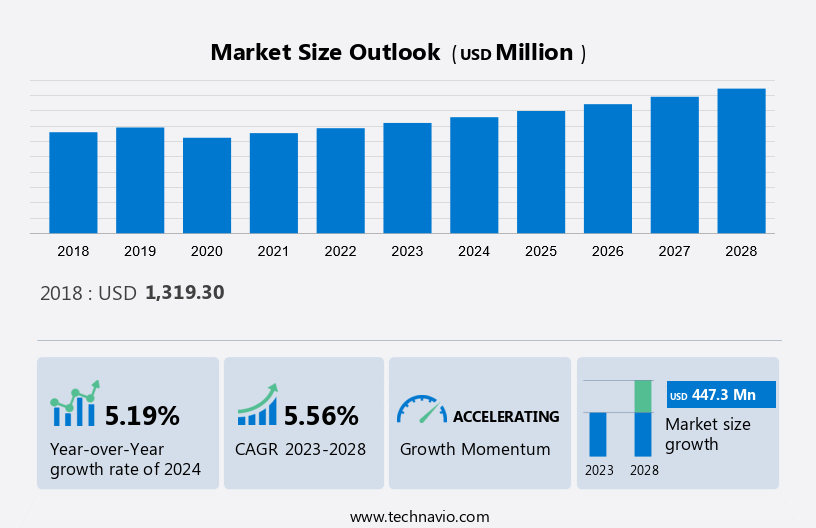
The automotive paintless dent removal tools market size is forecast to increase by USD 447.3 million at a CAGR of 5.56% between 2023 and 2028. The market is experiencing significant growth, driven by several key factors. One of the primary growth drivers is the low cost of PDR tools compared to traditional body shop repairs. This cost-effective solution appeals to both consumers and automotive service providers. Additionally, power tools and service players are incorporating strategic business growth initiatives, such as expanding their product offerings and enhancing their service capabilities. However, it is essential to acknowledge the limitations of PDR tools, as they may not be effective in certain cases, such as extensive dents or creases that require body filler or paint touch-ups. With most DIY PDR tools, it is not easy to remove dents sustained in the places of heavy sheet metal work. Despite this challenge, the market is expected to continue its upward trajectory, fueled by the increasing demand for efficient, cost-effective, and eco-friendly automotive repair solutions.
What will be the size of the Market During the Forecast Period?
To learn more about this report, View Report Sample
Market Dynamics
The market encompasses a range of specialized instruments used to remove dents from vehicle surfaces without invasive methods. These tools include leverage bars, hammers, suction cups, and dent removal rods. The non-invasive nature of PDR methods helps maintain paint surface integrity, reducing repair times and costs, and preserving the resale value of vehicles. PDR tools are essential for auto body repair shops and professional PDR services. DIY repair kits are also available for autonomous vehicle owners. The design and material durability of these tools are crucial factors in their effectiveness and longevity. However, it's important to consider the environmental impact of PDR tools. Some tools may generate toxic waste or release volatile organic compounds. Therefore, tool manufacturers and users must prioritize eco-friendly designs and practices. E-commerce is a significant contributor in the Automotive PDR Tools market, offering a range of high-quality, durable tools for both professional and DIY use. Repair glue is another essential accessory used in PDR processes to help secure panels and ensure a successful repair. Overall, the Automotive PDR Tools market continues to evolve, offering innovative solutions for efficient and cost-effective dent repairing services. Our researchers analyzed the data with 2023 as the base year, along with the key drivers, trends, and challenges. A holistic analysis of drivers will help companies refine their marketing strategies to gain a competitive advantage.
Key Market Driver
The low cost of PDR tools is driving growth in automotive paintless dent removal. Automotive PDR tools have benefited also for used car owners in terms of the time and money saved by using them. The auto dent repair tools are user-friendly and can be used in a simple, stressless way. In addition to these benefits, there are other factors that are driving the growth of the automotive maintenance and repair services market.
Moreover, the automotive PDR tools available in the market are affordable. An important factor in influencing consumers' awareness has been the price drop and increasing availability of distribution channels, such as e-commerce websites. This will consequently lead to the growth in demand for automotive PDR tools during the forecast period.
Significant Market Trends
The incorporation of business growth strategies by PDR tools and service players is a key trend in the market. Different strategies and methods of making their products marketable are being used by the players active in the worldwide automobile PDR tools market. The prominent players operating in the market have been incorporating different strategies to streamline their businesses.
Moreover, they are also expected to be used as a platform for providing real-time visibility of its business processes with needed scalability and flexibility in order to promote jobs related to the PDR. Such developments are expected to drive the demand for automotive PDR tools, which in turn, are anticipated to drive the growth of the market in focus during the forecast period.
Major Market Challenge
The ineffectiveness of PDR tools in certain cases is a major challenge in the market. Automotive PDR tools are planned to provide cost-effective dent removal and efficiency. They can be successful in the paintless removal of small dents and dings, which are the most common forms of dents sustained by a vehicle.
However, these tools, especially the DIY ones, may not be effective in the removal of certain damages. Hence, such instances where DIY PDR tools are not effective in dent removal challenge the growth of the global automotive PDR tools market during the forecast period.
Market Customer Landscape
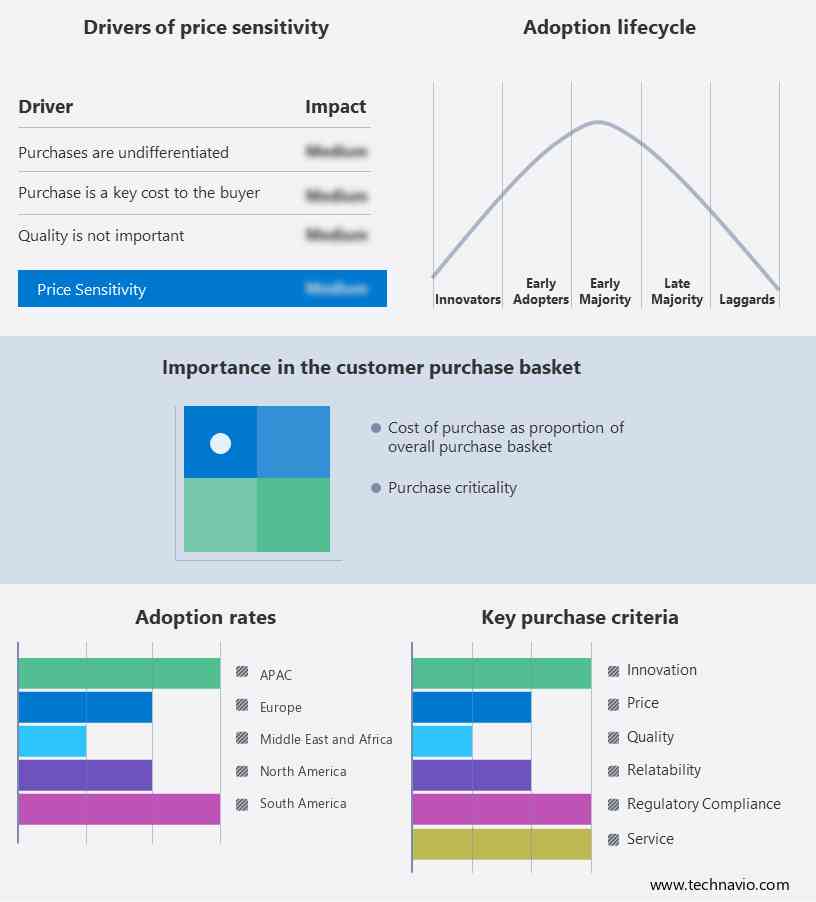
The market research report includes the adoption lifecycle of the market, covering from the innovator's stage to the laggard's stage. It focuses on adoption rates in different regions based on penetration. Furthermore, the report also includes key purchase criteria and drivers of price sensitivity to help companies evaluate and develop their growth strategies.
Market Customer Landscape
Who are the Major Market Companies?
Companies are implementing various strategies, such as strategic alliances, partnerships, mergers and acquisitions, geographical expansion, and product/service launches, to enhance their presence in the market.
B and D Innovative Tools - The company offers automotive paintless dent removal tools such as dent rods, door hangers, whale tails, and line board reflectors.
The research report also includes detailed analyses of the competitive landscape of the market and information about 12 market companies, including:
- Chervon Holdings Ltd.
- Dent Magic Tools Inc.
- HBC systems AS
- MIT AUTOMOBILE
- PDR Finesse Tools Inc.
- ROTAR Machinery Industrial Co. Ltd.
- Stanners Equipment Ltd.
- The Tool Connection Ltd.
- Trigo Group
- Ultra Dent Tools Inc.
- VEVOR
Qualitative and quantitative analysis of companies has been conducted to help clients understand the wider business environment as well as the strengths and weaknesses of key market players. Data is qualitatively analyzed to categorize companies as pure play, category-focused, industry-focused, and diversified; it is quantitatively analyzed to categorize companies as dominant, leading, strong, tentative, and weak.
What is the Largest-Growing Segment in the Market?
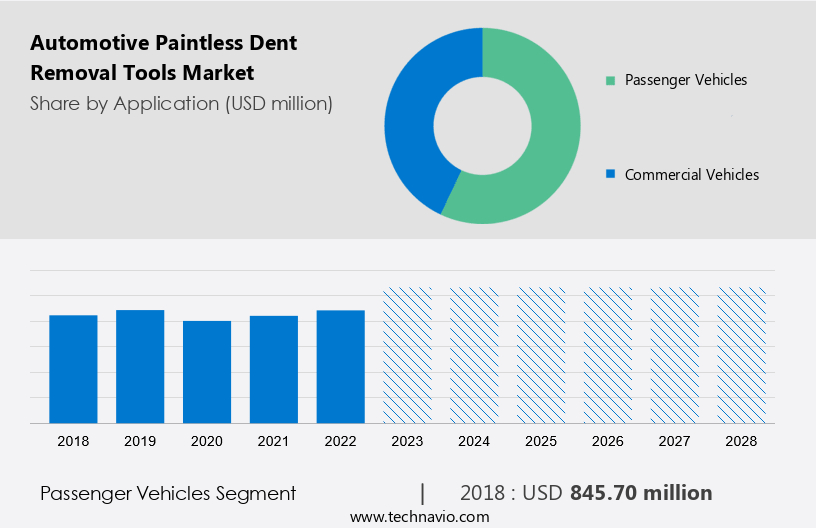
The passenger vehicles segment is estimated to witness significant growth during the forecast period. The market caters to the demand for restoring vehicle surfaces with non-invasive methods, ensuring paint surface integrity during auto body repair. Specialized instruments, such as leverage bars, hammers, suction cups, and dent removal rods, are essential for this process. These tools allow for efficient and cost-effective dent removal, enhancing the resale value of the vehicle.
Get a glance at the market contribution of various segments View the PDF Sample
The passenger vehicles segment was the largest segment and was valued at USD 845.70 million in 2018. Material science plays a crucial role in the design and development of these tools, with ergonomic designs and eco-friendly, DIY-friendly features becoming increasingly popular. Cutting-edge technologies like virtual reality and augmented reality are being integrated into PDR tools to improve repair efficiency and accuracy. The market for automotive PDR tools is driven by the growing number of passenger vehicles, particularly high-end luxury cars, and the increasing frequency of accidents and collisions. Hence, such factors are fuelling the growth of this segment during the forecast period.
Which are the Key Regions for the Market?
For more insights on the market share of various regions Download PDF Sample now!
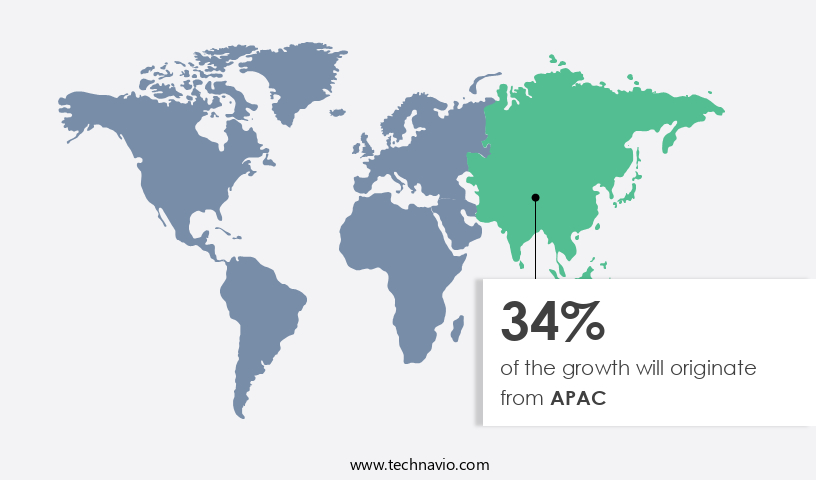
APAC is estimated to contribute 34% to the growth of the global market during the forecast period. Technavio's analysts have elaborately explained the regional trends and drivers that shape the market during the forecast period. North America has a large number of commercial vehicles, and they account for about half of the total in-use vehicles in the region. The automotive PDR tools market in North America is expected to grow during the forecast period primarily because of the increased preference for sports sedans, muscle cars, and high-performance vehicles, together with the presence of a number of players in the North American automotive PDR tool market. In addition, the LCVs segment accounts for the majority of sales across this region. Therefore, the automotive market dynamics in the region also fuel the growth of the market during the forecast period.
Segment Overview
The market research report provides comprehensive data (region wise segment analysis), with forecasts and estimates in "USD million" for the period 2024 to 2028, as well as historical data from 2018 to 2022 for the following segments.
- Type Outlook
- Pullers
- Tool kits
- Others
- Application Outlook
- Passenger vehicles
- Commercial vehicles
- Region Outlook
- North America
- The U.S.
- Canada
- Europe
- The U.K.
- Germany
- France
- Rest of Europe
- APAC
- China
- India
- Middle East & Africa
- Saudi Arabia
- South Africa
- Rest of the Middle East & Africa
- South America
- Chile
- Argentina
- Brazil
- North America
Market Analyst Overview
Non-Invasive Solutions for Enhancing Vehicle Surfaces Automotive Paintless Dent Removal (PDR) tools have gained significant popularity in the auto body repair industry due to their ability to restore vehicle surfaces without invasive methods. These specialized instruments include leverage bars, hammers, suction cups, and dent removal rods, which are designed to gently manipulate the metal back to its original shape. The market for PDR tools is thriving, with an increasing focus on repair efficiency, user-friendly kits, and eco-friendliness. Ergonomic designs and cutting-edge technologies, such as virtual and augmented reality, are also being leveraged to enhance the repair experience. Eco-friendliness and sustainability are essential factors in the development of PDR tools. Recycled-material tools and energy-saving techniques are being adopted to minimize toxic waste and volatile organic compounds. PDR tools cater to both DIY repair enthusiasts and professional services. DIY-friendly kits offer cost-effective solutions for vehicle owners, while professional PDR services provide high-quality repairs using specialized tools. Low-cost PDR workshops and body shops offer affordable repair options, making PDR an attractive alternative to traditional body shop repairs. The market for PDR tools is expected to grow, driven by the increasing demand for efficient, cost-effective, and eco-friendly repair solutions. In conclusion, the automotive PDR tools market is a dynamic and innovative industry that continues to evolve, offering non-invasive, cost-effective, and eco-friendly solutions for repairing dents on vehicle surfaces.
|
Market Scope |
|
|
Report Coverage |
Details |
|
Page number |
157 |
|
Base year |
2023 |
|
Historic period |
2018 - 2022 |
|
Forecast period |
2024-2028 |
|
Growth momentum & CAGR |
Accelerate at a CAGR of 5.56% |
|
Market growth 2024-2028 |
USD 447.3 million |
|
Market structure |
Concentrated |
|
YoY growth 2023-2024(%) |
5.19 |
|
Regional analysis |
North America, APAC, Europe, South America, and Middle East and Africa |
|
Performing market contribution |
APAC at 34% |
|
Key countries |
US, China, Germany, France, and Japan |
|
Competitive landscape |
Leading Companies, Market Positioning of Companies, Competitive Strategies, and Industry Risks |
|
Key companies profiled |
B and D Innovative Tools, Chervon Holdings Ltd., Dent Magic Tools Inc., HBC systems AS, MIT AUTOMOBILE, PDR Finesse Tools Inc., ROTAR Machinery Industrial Co. Ltd., Stanners Equipment Ltd., The Tool Connection Ltd., Trigo Group, Ultra Dent Tools Inc., and VEVOR |
|
Market dynamics |
Parent market analysis, market growth analysis, market research and growth, market forecasting, market report, market forecast, Market growth inducers and obstacles, Fast-growing and slow-growing segment analysis, Market growth and Forecasting, COVID 19 impact and recovery analysis and future consumer dynamics, Market condition analysis for forecast period |
|
Customization purview |
If our report has not included the data that you are looking for, you can reach out to our analysts and get segments customized. |
What are the Key Data Covered in this Market Research Report?
- CAGR of the market during the forecast period
- Detailed information on factors that will drive the growth of the market between 2023 and 2028.
- Precise estimation of the market in focus on the parent market
- Accurate predictions about upcoming trends and changes in consumer behavior
- Growth of the market industry across North America, APAC, Europe, South America, and the Middle East and Africa
- A thorough analysis of the market's competitive landscape and detailed information about companies
- Comprehensive analysis of factors that will challenge the growth of market companies
We can help! Our analysts can customize this market research report to meet your requirements.
 RIA -
RIA - 
