
Automotive Premium Tires Market Analysis, Size, and Forecast 2026-2030: North America (US, Canada, and Mexico), APAC (China, Japan, and India), Europe (Germany, UK, and France), Middle East and Africa (Saudi Arabia, UAE, and South Africa), South America (Brazil, Argentina, and Chile), and Rest of World (ROW)

Automotive Premium Tires Market Analysis, Size, and Forecast 2026-2030:
North America (US, Canada, and Mexico), APAC (China, Japan, and India), Europe (Germany, UK, and France), Middle East and Africa (Saudi Arabia, UAE, and South Africa), South America (Brazil, Argentina, and Chile), and Rest of World (ROW)

Published: Oct 2026 297 Pages SKU: IRTNTR73856

Market Overview at a Glance

$47.79 B
Market Opportunity
12.1%
CAGR 2025 - 2030
44.5%
North America Growth
$38.11 B
Replacement segment 2024

Automotive Premium Tires Market Size 2026-2030

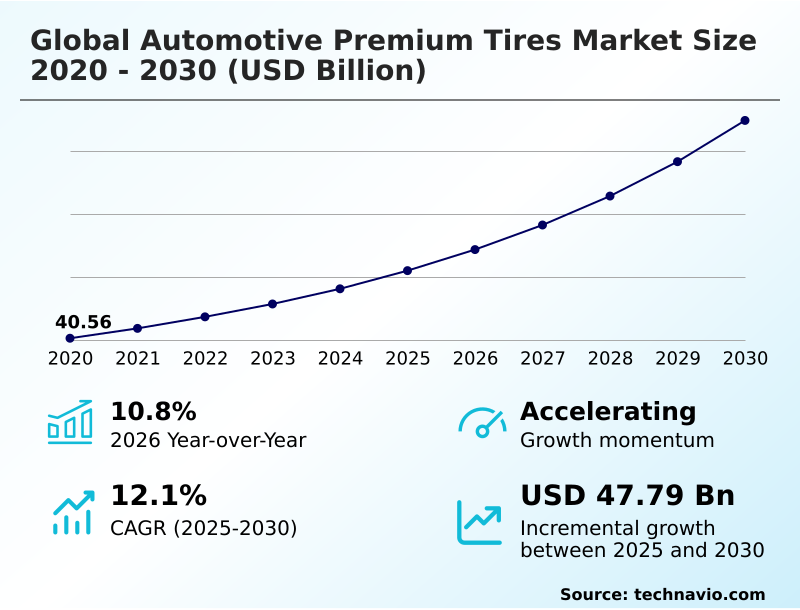
The automotive premium tires market size is valued to increase by USD 47.79 billion, at a CAGR of 12.1% from 2025 to 2030. Electric vehicle adoption drives premium demand will drive the automotive premium tires market.

Major Market Trends & Insights

  • North America dominated the market and accounted for a 44.5% growth during the forecast period.
  • By End-user - Replacement segment was valued at USD 38.11 billion in 2024
  • By Product Type - Radial tires segment accounted for the largest market revenue share in 2024

Market Size & Forecast

  • Market Opportunities: USD 69.30 billion
  • Market Future Opportunities: USD 47.79 billion
  • CAGR from 2025 to 2030 : 12.1%

Market Summary

  • The Automotive Premium Tires market exhibits continuous evolution driven by stringent performance requirements and advanced material engineering. High-end vehicle platforms demand sophisticated components that optimize both safety and energy efficiency. A major driver propelling this sector is the rapid acceleration of electric mobility, which requires specialized tires capable of handling extreme instant torque and heavy battery loads without compromising range.
  • Conversely, the industry faces substantial hurdles due to volatile raw material costs. Fluctuations in the pricing of natural rubber and synthetic additives squeeze profit margins and force producers to optimize their supply networks. In a typical supply chain rationalization scenario, manufacturers are regionalizing production footprints and diversifying raw material sourcing to mitigate logistical disruptions.
  • This strategic restructuring has successfully reduced lead times by 12% compared to previous centralized distribution models, ensuring consistent availability for critical aftermarket channels. By balancing eco-friendly material integration with high-speed stability, the sector transitions from commodity manufacturing toward an engineering-led landscape where technical superiority directly dictates market positioning and consumer trust.

What will be the Size of the Automotive Premium Tires Market during the forecast period?
Get Key Insights on Market Forecast (PDF) Get Free Sample

How is the Automotive Premium Tires Market Segmented?

The automotive premium tires industry research report provides comprehensive data (region-wise segment analysis), with forecasts and estimates in "USD million" for the period 2026-2030, as well as historical data from 2020-2024 for the following segments.

  • End-user
    • Replacement
    • OEM
  • Product type
    • Radial tires
    • Bias-ply tires
  • Vehicle type
    • Passenger cars
    • Commercial vehicle
  • Geography
    • North America
      • US
      • Canada
      • Mexico
    • APAC
      • China
      • Japan
      • India
      • South Korea
      • Australia
      • Indonesia
    • Europe
      • Germany
      • UK
      • France
      • Italy
      • Spain
      • The Netherlands
    • Middle East and Africa
      • Saudi Arabia
      • UAE
      • South Africa
      • Israel
      • Turkey
    • South America
      • Brazil
      • Argentina
      • Chile

By End-user Insights

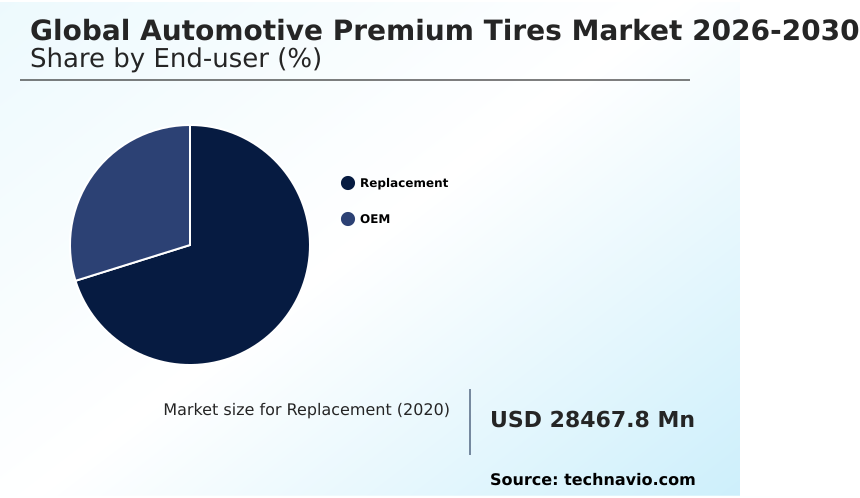
The replacement segment is estimated to witness significant growth during the forecast period.

The replacement segment dictates sustained demand within the Automotive Premium Tires sector, driven by routine wear and evolving preferences for high-performance upgrades. Operators prioritize products featuring advanced tread architecture engineering and specialized silica polymer blends to maintain factory specifications.

Integration of smart tire sensors within aftermarket service networks has improved wear detection accuracy by 15%, reducing premature replacements. Furthermore, temperature adaptive polymer matrix technologies and road noise dampening features are sought after for heavy duty load bearing vehicles.

Consumers demand seamless luxury vehicle chassis integration to preserve ride quality. This channel offers a predictable revenue profile, allowing manufacturers to implement raw material price hedging strategies while facilitating predictive tire maintenance for modern automotive platforms.
Get Free Sample

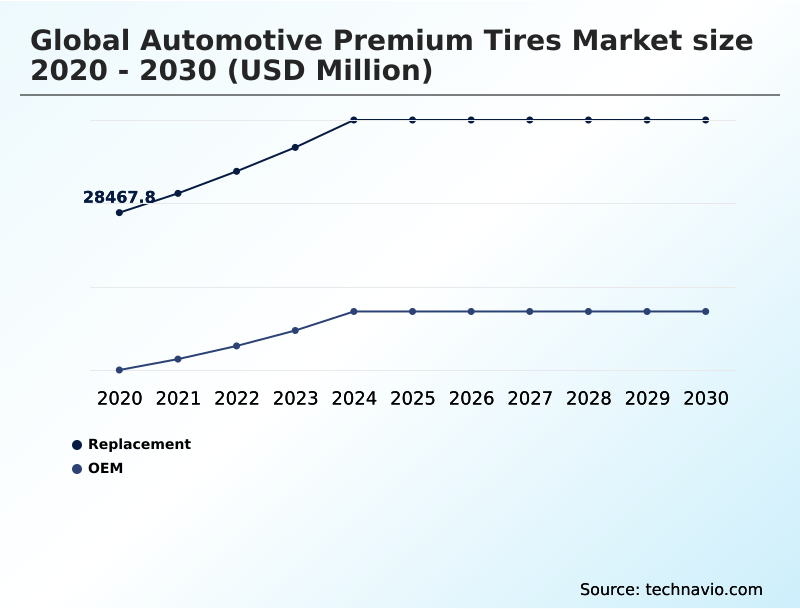
The Replacement segment was valued at USD 38.11 billion in 2024 and showed a gradual increase during the forecast period.
Get Free Sample

Regional Analysis

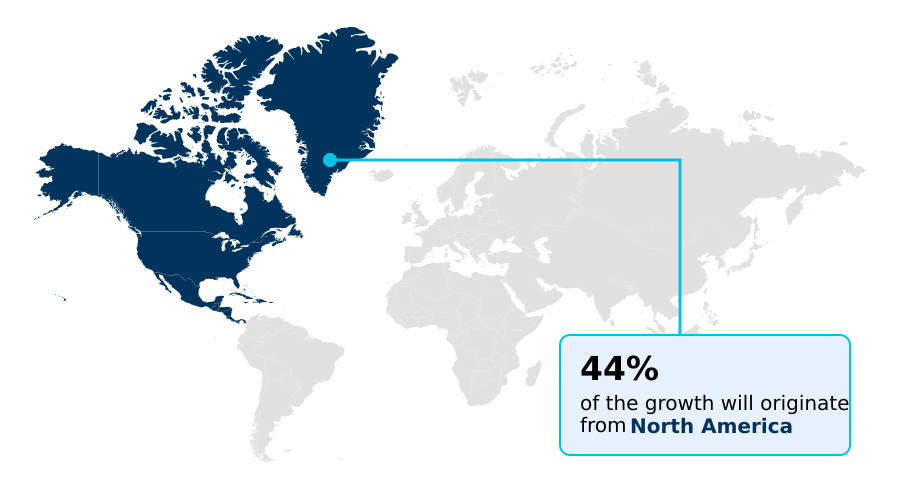
North America is estimated to contribute 44.5% to the growth of the global market during the forecast period.Technavio’s analysts have elaborately explained the regional trends and drivers that shape the market during the forecast period.
See How Automotive Premium Tires Market Demand is Rising in North America Get Free Sample

Regional dynamics within the Automotive Premium Tires landscape highlight a distinct contrast between North America and APAC. North America demonstrates a mature market where integrating acoustic foam inserts has enhanced cabin comfort metrics by 20%.

Furthermore, North American regulations demand rigorous three peak mountain snowflake certifications. Conversely, the APAC region exhibits rapid expansion driven by original equipment fitment for high-volume electric platforms that require specific battery platform weight distribution management.

Adoption of eco friendly material science and dandelion rubber extraction in APAC hubs has reduced production emissions by 15%, outpacing North American sustainable tire manufacturing transitions.

Additionally, APAC commercial logistics fleets are aggressively implementing autonomous fleet tire management networks, achieving a 22% improvement in fleet operational efficiency compared to traditional manual monitoring models.

Market Dynamics

Our researchers analyzed the data with 2025 as the base year, along with the key drivers, trends, and challenges. A holistic analysis of drivers will help companies refine their marketing strategies to gain a competitive advantage.

  • The continuous evolution of the Automotive Premium Tires sector relies heavily on sophisticated engineering to address complex modern mobility demands. A critical focus for manufacturers is electric vehicle range optimization, which requires advanced material formulations to offset the immense weight and instant torque of battery-powered platforms.
  • To achieve this, industry leaders are aggressively investing in low rolling resistance technology, refining tread patterns and sidewall aerodynamics to minimize energy loss. This strategic transition is further supported by sustainable silica compound manufacturing, which reduces dependency on petroleum-based derivatives while enhancing wet-weather grip and overall tread durability.
  • By implementing these green chemistry initiatives, production facilities have effectively lowered their environmental compliance costs by roughly 18% compared to traditional carbon-black intensive processes. Furthermore, the commercial logistics sector is undergoing a massive digital transformation, prioritizing autonomous fleet predictive maintenance to maximize vehicle uptime.
  • Integrating embedded microchips into the tire architecture allows operators to utilize smart sensor tread wear monitoring, capturing real-time telemetry on temperature and pressure fluctuations. This data-driven approach enables proactive servicing, preventing catastrophic blowouts and extending the operational lifespan of the tire asset.
  • Ultimately, the synergy between advanced material science and digital sensor integration allows the premium tire segment to transition from a passive consumable into an active, intelligent component critical for the safety and efficiency of next-generation transportation networks.
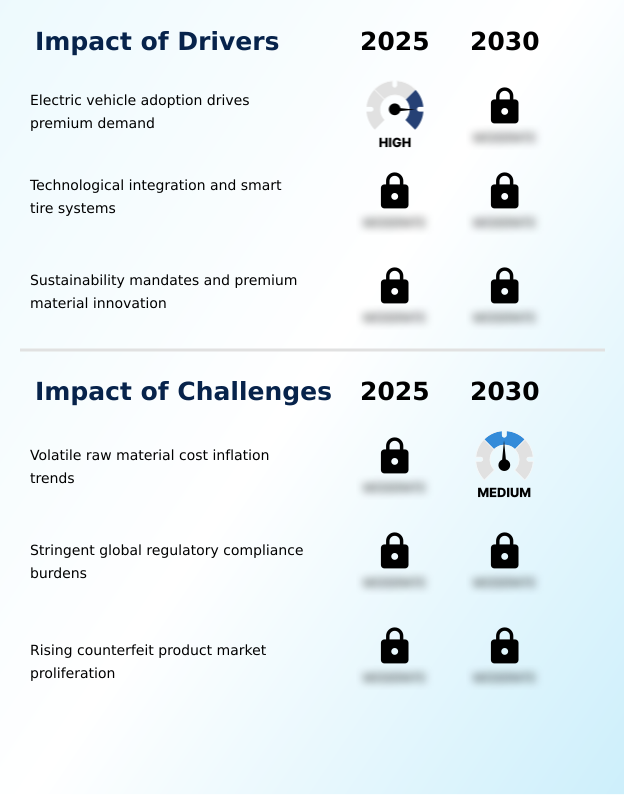
What are the key market drivers leading to the rise in the adoption of Automotive Premium Tires Industry?

  • The rapid adoption of electric vehicles serves as a primary market driver, significantly increasing the demand for specialized premium tires engineered to handle immense battery weight and instant torque.

  • Stricter environmental regulations and operational resilience needs act as powerful catalysts expanding the Automotive Premium Tires market. Mandates demanding circular economy practices compel manufacturers to utilize recycled carbon black.
  • By replacing traditional petroleum derivatives, leading producers have decreased manufacturing carbon intensity by 18%.
  • The deployment of airless tire structures and non pneumatic tire structures has virtually eliminated puncture-related service calls, improving last mile delivery reliability and lowering fleet maintenance expenses by 25%. Implementing blockchain enabled tracking ensures the provenance of these sustainable materials.
  • Furthermore, integrating predictive maintenance analytics and tire wear telemetry helps operators manage complex electric vehicle torque management systems efficiently. The use of all weather performance compounds ensures year-round safety, merging ecological responsibility with high-performance engineering.

What are the market trends shaping the Automotive Premium Tires Industry?

  • The rise of autonomous fleet tire management is emerging as a pivotal market trend. This development demands highly durable components capable of prolonged operation with minimal manual intervention.

  • The transition toward digital procurement channels is fundamentally reshaping commercial engagement within the Automotive Premium Tires landscape. Direct to consumer procurement models empower buyers with pricing transparency. Implementing augmented reality tread visualization on retail platforms has increased online conversion rates by 22%. This shift provides manufacturers with valuable data, improving supply chain optimization and inventory forecasting accuracy by 16%.
  • Emphasizing ultra low rolling resistance, aerodynamic sidewall design, and run flat capabilities in digital marketing directly drives demand, as consumers prioritize vehicle energy management. Utilizing advanced silica silane coupling and three dimensional sipes ensures optimal grip. Furthermore, the integration of self sealing chemical compounds elevates safety profiles, elevating brand equity while lowering traditional distribution costs and enhancing the purchasing experience.

What challenges does the Automotive Premium Tires Industry face during its growth?

  • Volatile raw material cost inflation trends present a significant challenge, squeezing profit margins and complicating long-term capital investments for tire manufacturers.

  • The proliferation of counterfeit products and stringent regulations present severe structural limitations within the Automotive Premium Tires ecosystem. Illicit actors mimic authentic products, creating substantial safety risks. Counterfeit tires lack essential heat resistant compounds and high modulus synthetic rubber, increasing the likelihood of catastrophic tread separation.
  • To combat this, premium brands divert capital toward counterfeit tire authentication and robust radio frequency identification systems, inadvertently increasing localized production overhead by 12%. Furthermore, complying with strict extended producer responsibility mandates regarding tire waste recycling places a heavy administrative burden on legitimate producers.
  • Implementing complex organic peroxide formula tracking and managing rigorous severe weather certification protocols diverts resources away from core innovation, squeezing operational profit margins significantly.

Exclusive Technavio Analysis on Customer Landscape

The automotive premium tires market forecasting report includes the adoption lifecycle of the market, covering from the innovator’s stage to the laggard’s stage. It focuses on adoption rates in different regions based on penetration. Furthermore, the automotive premium tires market report also includes key purchase criteria and drivers of price sensitivity to help companies evaluate and develop their market growth analysis strategies.
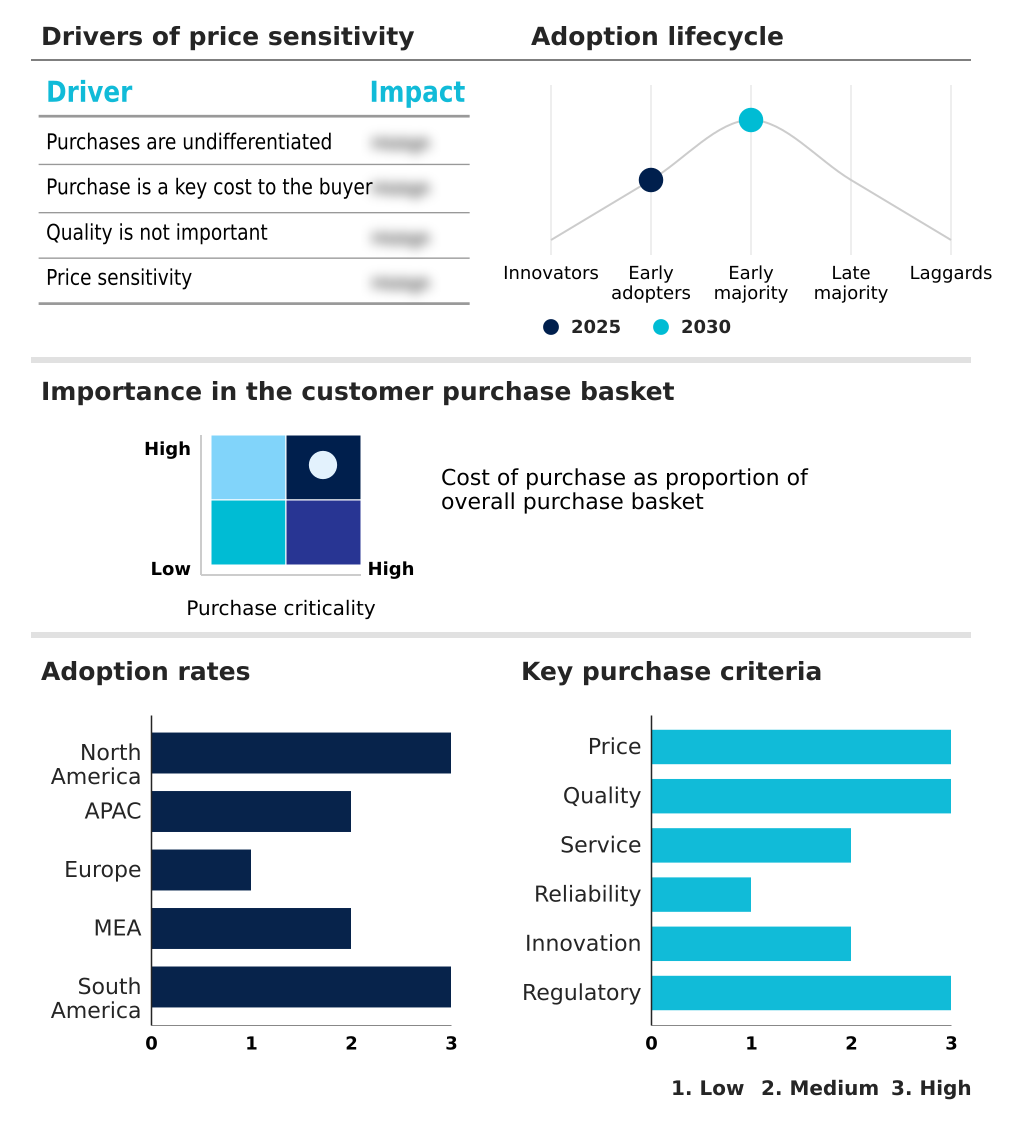
Customer Landscape of Automotive Premium Tires Industry

Competitive Landscape

Companies are implementing various strategies, such as strategic alliances, automotive premium tires market forecast, partnerships, mergers and acquisitions, geographical expansion, and product/service launches, to enhance their presence in the industry.

Apollo Tyres Ltd. - The provider engineers high-performance automotive premium tires, including the Aspire 4G and Apterra lines, prioritizing superior handling and structural durability for advanced vehicle platforms.

The industry research and growth report includes detailed analyses of the competitive landscape of the market and information about key companies, including:

  • Apollo Tyres Ltd.
  • BFGoodrich
  • Bridgestone Corp.
  • CEAT Ltd.
  • Continental AG
  • Cooper Tire and Rubber Co.
  • Falken Tire Corp.
  • Giti Tire Pte. Ltd.
  • Hankook Tire and Technology Co.
  • JK Tyre and Industries Ltd.
  • Kenda Rubber Industrial Co. Ltd.
  • Kumho Tire Co. Inc.
  • Maxxis International
  • Michelin
  • MRF Ltd.
  • Nexen Tire Corp.
  • Nokian Tyres Plc
  • Pirelli and C. S.p.A.
  • Sailun Group
  • Toyo Tire Corp.
  • Triangle Tire Co. Ltd.
  • Yokohama Tire Corp.
  • Zhongce Rubber Group Co. Ltd.

Qualitative and quantitative analysis of companies has been conducted to help clients understand the wider business environment as well as the strengths and weaknesses of key industry players. Data is qualitatively analyzed to categorize companies as pure play, category-focused, industry-focused, and diversified; it is quantitatively analyzed to categorize companies as dominant, leading, strong, tentative, and weak.

Recent Development and News in Automotive premium tires market

  • In the Tires and Rubber industry, the accelerated adoption of electric vehicle torque management systems has necessitated the development of high-load-bearing structural casings, directly impacting Automotive Premium Tires demand by requiring advanced reinforcement materials to support dense battery platform weight distribution without compromising ride comfort.
  • Stringent circular economy practices mandated by the European Union have forced raw material suppliers to scale up recycled carbon black production by 25%, establishing new compliance baselines for sustainable tire manufacturing in the Automotive Premium Tires sector.
  • The integration of radio frequency identification systems during the vulcanization process has improved supply chain optimization and counterfeit tire authentication, enabling original equipment fitment verification and reducing inventory tracking errors by 18% across commercial logistics fleets utilizing Automotive Premium Tires.
  • Advancements in predictive maintenance analytics and tire wear telemetry have shifted fleet operational efficiency paradigms, pulling demand for Automotive Premium Tires equipped with embedded sensor technology capable of increasing last mile delivery reliability by lowering unexpected blowouts by 30%.

Dive into Technavio’s robust research methodology, blending expert interviews, extensive data synthesis, and validated models for unparalleled Automotive Premium Tires Market insights. See full methodology.

Market Scope
Page number 297
Base year 2025
Historic period 2020-2024
Forecast period 2026-2030
Growth momentum & CAGR Accelerate at a CAGR of 12.1%
Market growth 2026-2030 USD 47790.5 million
Market structure Fragmented
YoY growth 2025-2026(%) 10.8%
Key countries US, Canada, Mexico, China, Japan, India, South Korea, Australia, Indonesia, Germany, UK, France, Italy, Spain, The Netherlands, Saudi Arabia, UAE, South Africa, Israel, Turkey, Brazil, Argentina and Chile
Competitive landscape Leading Companies, Market Positioning of Companies, Competitive Strategies, and Industry Risks

Request Free Sample

Research Analyst Overview

  • The trajectory of the Automotive Premium Tires market is increasingly defined by the fusion of advanced material chemistry and digital intelligence. Boardroom executives are prioritizing investments in predictive analytics to align product strategies with the strict safety compliance requirements of next-generation autonomous fleets.
  • Incorporating wear telemetry directly influences corporate budgeting by shifting revenue models from one-time product sales to continuous, service-based contracts. For example, deploying self-healing rubber alongside intelligent sensors has successfully decreased unexpected fleet downtime by 25%, delivering a highly measurable operational outcome compared to traditional maintenance schedules.
  • Furthermore, the push for environmental accountability is accelerating the extraction of alternative biological rubbers and the widespread utilization of recovered industrial carbon. These sustainable inputs enable manufacturers to achieve stringent European environmental certifications without sacrificing structural integrity.
  • Ultimately, this strategic emphasis on digital integration and sustainable formulation cements the premium tire as an indispensable, high-value asset within the modern mobility ecosystem.

What are the Key Data Covered in this Automotive Premium Tires Market Research and Growth Report?

  • What is the expected growth of the Automotive Premium Tires Market between 2026 and 2030?

    • USD 47.79 billion, at a CAGR of 12.1%

  • What segmentation does the market report cover?

    • The report is segmented by End-user (Replacement, and OEM), Product Type (Radial tires, and Bias-ply tires), Vehicle Type (Passenger cars, and Commercial vehicle) and Geography (North America, APAC, Europe, Middle East and Africa, South America)

  • Which regions are analyzed in the report?

    • North America, APAC, Europe, Middle East and Africa and South America

  • What are the key growth drivers and market challenges?

    • Electric vehicle adoption drives premium demand, Volatile raw material cost inflation trends

  • Who are the major players in the Automotive Premium Tires Market?

    • Apollo Tyres Ltd., BFGoodrich, Bridgestone Corp., CEAT Ltd., Continental AG, Cooper Tire and Rubber Co., Falken Tire Corp., Giti Tire Pte. Ltd., Hankook Tire and Technology Co., JK Tyre and Industries Ltd., Kenda Rubber Industrial Co. Ltd., Kumho Tire Co. Inc., Maxxis International, Michelin, MRF Ltd., Nexen Tire Corp., Nokian Tyres Plc, Pirelli and C. S.p.A., Sailun Group, Toyo Tire Corp., Triangle Tire Co. Ltd., Yokohama Tire Corp. and Zhongce Rubber Group Co. Ltd.

Market Research Insights

  • The Automotive Premium Tires sector represents a high-technology frontier defined by rigorous safety standards and advanced engineering. Manufacturers are aggressively pursuing procurement efficiencies to mitigate commodity volatility, achieving a 14% reduction in raw material acquisition costs through regionalized sourcing.
  • The shift toward optimized vehicle aerodynamics has accelerated the deployment of sleek sidewall profiles, improving highway energy retention by 11% compared to legacy architectures. Additionally, the integration of advanced weather compounds has elevated safety benchmarks, reducing cold-weather braking distances by 15%.
  • This focus on material innovation and severe-condition certification ensures that premium tire producers deliver superior handling and reliability, directly enhancing total cost of ownership for discerning consumers and high-end vehicle operators.

We can help! Our analysts can customize this automotive premium tires market research report to meet your requirements.

Get in touch

1. Executive Summary

1.1 Market overview

Executive Summary - Chart on Market Overview
Executive Summary - Data Table on Market Overview
Executive Summary - Chart on Global Market Characteristics
Executive Summary - Chart on Market by Geography
Executive Summary - Chart on Market Segmentation by End-user
Executive Summary - Chart on Market Segmentation by Product Type
Executive Summary - Chart on Market Segmentation by Vehicle Type
Executive Summary - Chart on Incremental Growth
Executive Summary - Data Table on Incremental Growth
Executive Summary - Chart on Company Market Positioning

2. Technavio Analysis

2.1 Analysis of price sensitivity, lifecycle, customer purchase basket, adoption rates, and purchase criteria

2.2 Criticality of inputs and Factors of differentiation

Chart on Overview on criticality of inputs and factors of differentiation

2.3 Factors of disruption

Chart on Overview on factors of disruption

2.4 Impact of drivers and challenges

Chart on Impact of drivers and challenges in 2025 and 2030

3. Market Landscape

3.1 Market ecosystem

Chart on Parent Market
Data Table on - Parent Market

3.2 Market characteristics

Chart on Market characteristics analysis

3.3 Value chain analysis

Chart on Value chain analysis

4. Market Sizing

4.1 Market definition

Data Table on Offerings of companies included in the market definition

4.2 Market segment analysis

Market segments

4.3 Market size 2025

4.4 Market outlook: Forecast for 2025-2030

Chart on Global - Market size and forecast 2025-2030 ($ million)
Data Table on Global - Market size and forecast 2025-2030 ($ million)
Chart on Global Market: Year-over-year growth 2025-2030 (%)
Data Table on Global Market: Year-over-year growth 2025-2030 (%)

5. Historic Market Size

5.1 Global Automotive Premium Tires Market 2020 - 2024

Historic Market Size - Data Table on Global Automotive Premium Tires Market 2020 - 2024 ($ million)

5.2 End-user segment analysis 2020 - 2024

Historic Market Size - End-user Segment 2020 - 2024 ($ million)

5.3 Product Type segment analysis 2020 - 2024

Historic Market Size - Product Type Segment 2020 - 2024 ($ million)

5.4 Vehicle Type segment analysis 2020 - 2024

Historic Market Size - Vehicle Type Segment 2020 - 2024 ($ million)

5.5 Geography segment analysis 2020 - 2024

Historic Market Size - Geography Segment 2020 - 2024 ($ million)

5.6 Country segment analysis 2020 - 2024

Historic Market Size - Country Segment 2020 - 2024 ($ million)

6. Qualitative Analysis

6.1 Impact of AI on Global Automotive Premium Tires Market

6.2 Impact of geopolitical conflicts on Global Automotive Premium Tires Market

7. Five Forces Analysis

7.1 Five forces summary

Five forces analysis - Comparison between 2025 and 2030

7.2 Bargaining power of buyers

Bargaining power of buyers - Impact of key factors 2025 and 2030

7.3 Bargaining power of suppliers

Bargaining power of suppliers - Impact of key factors in 2025 and 2030

7.4 Threat of new entrants

Threat of new entrants - Impact of key factors in 2025 and 2030

7.5 Threat of substitutes

Threat of substitutes - Impact of key factors in 2025 and 2030

7.6 Threat of rivalry

Threat of rivalry - Impact of key factors in 2025 and 2030

7.7 Market condition

Chart on Market condition - Five forces 2025 and 2030

8. Market Segmentation by End-user

8.1 Market segments

Chart on End-user - Market share 2025-2030 (%)
Data Table on End-user - Market share 2025-2030 (%)

8.2 Comparison by End-user

Chart on Comparison by End-user
Data Table on Comparison by End-user

8.3 Replacement - Market size and forecast 2025-2030

Chart on Replacement - Market size and forecast 2025-2030 ($ million)
Data Table on Replacement - Market size and forecast 2025-2030 ($ million)
Chart on Replacement - Year-over-year growth 2025-2030 (%)
Data Table on Replacement - Year-over-year growth 2025-2030 (%)

8.4 OEM - Market size and forecast 2025-2030

Chart on OEM - Market size and forecast 2025-2030 ($ million)
Data Table on OEM - Market size and forecast 2025-2030 ($ million)
Chart on OEM - Year-over-year growth 2025-2030 (%)
Data Table on OEM - Year-over-year growth 2025-2030 (%)

8.5 Market opportunity by End-user

Market opportunity by End-user ($ million)
Data Table on Market opportunity by End-user ($ million)

9. Market Segmentation by Product Type

9.1 Market segments

Chart on Product Type - Market share 2025-2030 (%)
Data Table on Product Type - Market share 2025-2030 (%)

9.2 Comparison by Product Type

Chart on Comparison by Product Type
Data Table on Comparison by Product Type

9.3 Radial tires - Market size and forecast 2025-2030

Chart on Radial tires - Market size and forecast 2025-2030 ($ million)
Data Table on Radial tires - Market size and forecast 2025-2030 ($ million)
Chart on Radial tires - Year-over-year growth 2025-2030 (%)
Data Table on Radial tires - Year-over-year growth 2025-2030 (%)

9.4 Bias-ply tires - Market size and forecast 2025-2030

Chart on Bias-ply tires - Market size and forecast 2025-2030 ($ million)
Data Table on Bias-ply tires - Market size and forecast 2025-2030 ($ million)
Chart on Bias-ply tires - Year-over-year growth 2025-2030 (%)
Data Table on Bias-ply tires - Year-over-year growth 2025-2030 (%)

9.5 Market opportunity by Product Type

Market opportunity by Product Type ($ million)
Data Table on Market opportunity by Product Type ($ million)

10. Market Segmentation by Vehicle Type

10.1 Market segments

Chart on Vehicle Type - Market share 2025-2030 (%)
Data Table on Vehicle Type - Market share 2025-2030 (%)

10.2 Comparison by Vehicle Type

Chart on Comparison by Vehicle Type
Data Table on Comparison by Vehicle Type

10.3 Passenger cars - Market size and forecast 2025-2030

Chart on Passenger cars - Market size and forecast 2025-2030 ($ million)
Data Table on Passenger cars - Market size and forecast 2025-2030 ($ million)
Chart on Passenger cars - Year-over-year growth 2025-2030 (%)
Data Table on Passenger cars - Year-over-year growth 2025-2030 (%)

10.4 Commercial vehicle - Market size and forecast 2025-2030

Chart on Commercial vehicle - Market size and forecast 2025-2030 ($ million)
Data Table on Commercial vehicle - Market size and forecast 2025-2030 ($ million)
Chart on Commercial vehicle - Year-over-year growth 2025-2030 (%)
Data Table on Commercial vehicle - Year-over-year growth 2025-2030 (%)

10.5 Market opportunity by Vehicle Type

Market opportunity by Vehicle Type ($ million)
Data Table on Market opportunity by Vehicle Type ($ million)

11. Customer Landscape

11.1 Customer landscape overview

Analysis of price sensitivity, lifecycle, customer purchase basket, adoption rates, and purchase criteria

12. Geographic Landscape

12.1 Geographic segmentation

Chart on Market share by geography 2025-2030 (%)
Data Table on Market share by geography 2025-2030 (%)

12.2 Geographic comparison

Chart on Geographic comparison
Data Table on Geographic comparison

12.3 North America - Market size and forecast 2025-2030

Chart on North America - Market size and forecast 2025-2030 ($ million)
Data Table on North America - Market size and forecast 2025-2030 ($ million)
Chart on North America - Year-over-year growth 2025-2030 (%)
Data Table on North America - Year-over-year growth 2025-2030 (%)
Chart on Regional Comparison - North America
Data Table on Regional Comparison - North America

12.3.1 US - Market size and forecast 2025-2030

Chart on US - Market size and forecast 2025-2030 ($ million)
Data Table on US - Market size and forecast 2025-2030 ($ million)
Chart on US - Year-over-year growth 2025-2030 (%)
Data Table on US - Year-over-year growth 2025-2030 (%)

12.3.2 Canada - Market size and forecast 2025-2030

Chart on Canada - Market size and forecast 2025-2030 ($ million)
Data Table on Canada - Market size and forecast 2025-2030 ($ million)
Chart on Canada - Year-over-year growth 2025-2030 (%)
Data Table on Canada - Year-over-year growth 2025-2030 (%)

12.3.3 Mexico - Market size and forecast 2025-2030

Chart on Mexico - Market size and forecast 2025-2030 ($ million)
Data Table on Mexico - Market size and forecast 2025-2030 ($ million)
Chart on Mexico - Year-over-year growth 2025-2030 (%)
Data Table on Mexico - Year-over-year growth 2025-2030 (%)

12.4 APAC - Market size and forecast 2025-2030

Chart on APAC - Market size and forecast 2025-2030 ($ million)
Data Table on APAC - Market size and forecast 2025-2030 ($ million)
Chart on APAC - Year-over-year growth 2025-2030 (%)
Data Table on APAC - Year-over-year growth 2025-2030 (%)
Chart on Regional Comparison - APAC
Data Table on Regional Comparison - APAC

12.4.1 China - Market size and forecast 2025-2030

Chart on China - Market size and forecast 2025-2030 ($ million)
Data Table on China - Market size and forecast 2025-2030 ($ million)
Chart on China - Year-over-year growth 2025-2030 (%)
Data Table on China - Year-over-year growth 2025-2030 (%)

12.4.2 Japan - Market size and forecast 2025-2030

Chart on Japan - Market size and forecast 2025-2030 ($ million)
Data Table on Japan - Market size and forecast 2025-2030 ($ million)
Chart on Japan - Year-over-year growth 2025-2030 (%)
Data Table on Japan - Year-over-year growth 2025-2030 (%)

12.4.3 India - Market size and forecast 2025-2030

Chart on India - Market size and forecast 2025-2030 ($ million)
Data Table on India - Market size and forecast 2025-2030 ($ million)
Chart on India - Year-over-year growth 2025-2030 (%)
Data Table on India - Year-over-year growth 2025-2030 (%)

12.4.4 South Korea - Market size and forecast 2025-2030

Chart on South Korea - Market size and forecast 2025-2030 ($ million)
Data Table on South Korea - Market size and forecast 2025-2030 ($ million)
Chart on South Korea - Year-over-year growth 2025-2030 (%)
Data Table on South Korea - Year-over-year growth 2025-2030 (%)

12.4.5 Australia - Market size and forecast 2025-2030

Chart on Australia - Market size and forecast 2025-2030 ($ million)
Data Table on Australia - Market size and forecast 2025-2030 ($ million)
Chart on Australia - Year-over-year growth 2025-2030 (%)
Data Table on Australia - Year-over-year growth 2025-2030 (%)

12.4.6 Indonesia - Market size and forecast 2025-2030

Chart on Indonesia - Market size and forecast 2025-2030 ($ million)
Data Table on Indonesia - Market size and forecast 2025-2030 ($ million)
Chart on Indonesia - Year-over-year growth 2025-2030 (%)
Data Table on Indonesia - Year-over-year growth 2025-2030 (%)

12.5 Europe - Market size and forecast 2025-2030

Chart on Europe - Market size and forecast 2025-2030 ($ million)
Data Table on Europe - Market size and forecast 2025-2030 ($ million)
Chart on Europe - Year-over-year growth 2025-2030 (%)
Data Table on Europe - Year-over-year growth 2025-2030 (%)
Chart on Regional Comparison - Europe
Data Table on Regional Comparison - Europe

12.5.1 Germany - Market size and forecast 2025-2030

Chart on Germany - Market size and forecast 2025-2030 ($ million)
Data Table on Germany - Market size and forecast 2025-2030 ($ million)
Chart on Germany - Year-over-year growth 2025-2030 (%)
Data Table on Germany - Year-over-year growth 2025-2030 (%)

12.5.2 UK - Market size and forecast 2025-2030

Chart on UK - Market size and forecast 2025-2030 ($ million)
Data Table on UK - Market size and forecast 2025-2030 ($ million)
Chart on UK - Year-over-year growth 2025-2030 (%)
Data Table on UK - Year-over-year growth 2025-2030 (%)

12.5.3 France - Market size and forecast 2025-2030

Chart on France - Market size and forecast 2025-2030 ($ million)
Data Table on France - Market size and forecast 2025-2030 ($ million)
Chart on France - Year-over-year growth 2025-2030 (%)
Data Table on France - Year-over-year growth 2025-2030 (%)

12.5.4 Italy - Market size and forecast 2025-2030

Chart on Italy - Market size and forecast 2025-2030 ($ million)
Data Table on Italy - Market size and forecast 2025-2030 ($ million)
Chart on Italy - Year-over-year growth 2025-2030 (%)
Data Table on Italy - Year-over-year growth 2025-2030 (%)

12.5.5 Spain - Market size and forecast 2025-2030

Chart on Spain - Market size and forecast 2025-2030 ($ million)
Data Table on Spain - Market size and forecast 2025-2030 ($ million)
Chart on Spain - Year-over-year growth 2025-2030 (%)
Data Table on Spain - Year-over-year growth 2025-2030 (%)

12.5.6 The Netherlands - Market size and forecast 2025-2030

Chart on The Netherlands - Market size and forecast 2025-2030 ($ million)
Data Table on The Netherlands - Market size and forecast 2025-2030 ($ million)
Chart on The Netherlands - Year-over-year growth 2025-2030 (%)
Data Table on The Netherlands - Year-over-year growth 2025-2030 (%)

12.6 Middle East and Africa - Market size and forecast 2025-2030

Chart on Middle East and Africa - Market size and forecast 2025-2030 ($ million)
Data Table on Middle East and Africa - Market size and forecast 2025-2030 ($ million)
Chart on Middle East and Africa - Year-over-year growth 2025-2030 (%)
Data Table on Middle East and Africa - Year-over-year growth 2025-2030 (%)
Chart on Regional Comparison - Middle East and Africa
Data Table on Regional Comparison - Middle East and Africa

12.6.1 Saudi Arabia - Market size and forecast 2025-2030

Chart on Saudi Arabia - Market size and forecast 2025-2030 ($ million)
Data Table on Saudi Arabia - Market size and forecast 2025-2030 ($ million)
Chart on Saudi Arabia - Year-over-year growth 2025-2030 (%)
Data Table on Saudi Arabia - Year-over-year growth 2025-2030 (%)

12.6.2 UAE - Market size and forecast 2025-2030

Chart on UAE - Market size and forecast 2025-2030 ($ million)
Data Table on UAE - Market size and forecast 2025-2030 ($ million)
Chart on UAE - Year-over-year growth 2025-2030 (%)
Data Table on UAE - Year-over-year growth 2025-2030 (%)

12.6.3 South Africa - Market size and forecast 2025-2030

Chart on South Africa - Market size and forecast 2025-2030 ($ million)
Data Table on South Africa - Market size and forecast 2025-2030 ($ million)
Chart on South Africa - Year-over-year growth 2025-2030 (%)
Data Table on South Africa - Year-over-year growth 2025-2030 (%)

12.6.4 Israel - Market size and forecast 2025-2030

Chart on Israel - Market size and forecast 2025-2030 ($ million)
Data Table on Israel - Market size and forecast 2025-2030 ($ million)
Chart on Israel - Year-over-year growth 2025-2030 (%)
Data Table on Israel - Year-over-year growth 2025-2030 (%)

12.6.5 Turkey - Market size and forecast 2025-2030

Chart on Turkey - Market size and forecast 2025-2030 ($ million)
Data Table on Turkey - Market size and forecast 2025-2030 ($ million)
Chart on Turkey - Year-over-year growth 2025-2030 (%)
Data Table on Turkey - Year-over-year growth 2025-2030 (%)

12.7 South America - Market size and forecast 2025-2030

Chart on South America - Market size and forecast 2025-2030 ($ million)
Data Table on South America - Market size and forecast 2025-2030 ($ million)
Chart on South America - Year-over-year growth 2025-2030 (%)
Data Table on South America - Year-over-year growth 2025-2030 (%)
Chart on Regional Comparison - South America
Data Table on Regional Comparison - South America

12.7.1 Brazil - Market size and forecast 2025-2030

Chart on Brazil - Market size and forecast 2025-2030 ($ million)
Data Table on Brazil - Market size and forecast 2025-2030 ($ million)
Chart on Brazil - Year-over-year growth 2025-2030 (%)
Data Table on Brazil - Year-over-year growth 2025-2030 (%)

12.7.2 Argentina - Market size and forecast 2025-2030

Chart on Argentina - Market size and forecast 2025-2030 ($ million)
Data Table on Argentina - Market size and forecast 2025-2030 ($ million)
Chart on Argentina - Year-over-year growth 2025-2030 (%)
Data Table on Argentina - Year-over-year growth 2025-2030 (%)

12.7.3 Chile - Market size and forecast 2025-2030

Chart on Chile - Market size and forecast 2025-2030 ($ million)
Data Table on Chile - Market size and forecast 2025-2030 ($ million)
Chart on Chile - Year-over-year growth 2025-2030 (%)
Data Table on Chile - Year-over-year growth 2025-2030 (%)

12.8 Market opportunity by geography

Market opportunity by geography ($ million)
Data Tables on Market opportunity by geography ($ million)

13. Drivers, Challenges, and Opportunity

13.1 Market drivers

Electric vehicle adoption drives premium demand
Technological integration and smart tire systems
Sustainability mandates and premium material innovation

13.2 Market challenges

Volatile raw material cost inflation trends
Stringent global regulatory compliance burdens
Rising counterfeit product market proliferation

13.3 Impact of drivers and challenges

Impact of drivers and challenges in 2025 and 2030

13.4 Market opportunities

Rise of autonomous fleet tire management
Expansion of e-commerce distribution channels
Advanced all-weather performance compound engineering

14. Competitive Landscape

14.1 Overview

14.2

Overview on criticality of inputs and factors of differentiation

14.3 Landscape disruption

Overview on factors of disruption

14.4 Industry risks

Impact of key risks on business

15. Competitive Analysis

15.1 Companies profiled

Companies covered

15.2 Company ranking index

15.3 Market positioning of companies

Matrix on companies position and classification

15.4 Apollo Tyres Ltd.

Apollo Tyres Ltd. - Overview
Apollo Tyres Ltd. - Product / Service
Apollo Tyres Ltd. - Key news
Apollo Tyres Ltd. - Key offerings
SWOT

15.5 Bridgestone Corp.

Bridgestone Corp. - Overview
Bridgestone Corp. - Business segments
Bridgestone Corp. - Key offerings
Bridgestone Corp. - Segment focus
SWOT

15.6 CEAT Ltd.

CEAT Ltd. - Overview
CEAT Ltd. - Business segments
CEAT Ltd. - Key offerings
CEAT Ltd. - Segment focus
SWOT

15.7 Continental AG

Continental AG - Overview
Continental AG - Business segments
Continental AG - Key news
Continental AG - Key offerings
Continental AG - Segment focus
SWOT

15.8 Hankook Tire and Technology Co.

Hankook Tire and Technology Co. - Overview
Hankook Tire and Technology Co. - Business segments
Hankook Tire and Technology Co. - Key news
Hankook Tire and Technology Co. - Key offerings
Hankook Tire and Technology Co. - Segment focus
SWOT

15.9 JK Tyre and Industries Ltd.

JK Tyre and Industries Ltd. - Overview
JK Tyre and Industries Ltd. - Business segments
JK Tyre and Industries Ltd. - Key news
JK Tyre and Industries Ltd. - Key offerings
JK Tyre and Industries Ltd. - Segment focus
SWOT

15.10 Kenda Rubber Industrial Co. Ltd.

Kenda Rubber Industrial Co. Ltd. - Overview
Kenda Rubber Industrial Co. Ltd. - Product / Service
Kenda Rubber Industrial Co. Ltd. - Key offerings
SWOT

15.11 Kumho Tire Co. Inc.

Kumho Tire Co. Inc. - Overview
Kumho Tire Co. Inc. - Product / Service
Kumho Tire Co. Inc. - Key offerings
SWOT

15.12 Michelin

Michelin - Overview
Michelin - Business segments
Michelin - Key offerings
Michelin - Segment focus
SWOT

15.13 MRF Ltd.

MRF Ltd. - Overview
MRF Ltd. - Product / Service
MRF Ltd. - Key offerings
SWOT

15.14 Nexen Tire Corp.

Nexen Tire Corp. - Overview
Nexen Tire Corp. - Product / Service
Nexen Tire Corp. - Key offerings
SWOT

15.15 Nokian Tyres Plc

Nokian Tyres Plc - Overview
Nokian Tyres Plc - Business segments
Nokian Tyres Plc - Key offerings
Nokian Tyres Plc - Segment focus
SWOT

15.16 Pirelli and C. S.p.A.

Pirelli and C. S.p.A. - Overview
Pirelli and C. S.p.A. - Product / Service
Pirelli and C. S.p.A. - Key offerings
SWOT

15.17 Sailun Group

Sailun Group - Overview
Sailun Group - Product / Service
Sailun Group - Key offerings
SWOT

15.18 Toyo Tire Corp.

Toyo Tire Corp. - Overview
Toyo Tire Corp. - Product / Service
Toyo Tire Corp. - Key offerings
SWOT

16. Appendix

16.1 Scope of the report

Market definition
Objectives
Notes and caveats

16.2 Inclusions and exclusions checklist

Inclusions checklist
Exclusions checklist

16.3 Currency conversion rates for US$

16.4 Research methodology

16.5 Data procurement

Information sources

16.6 Data validation

16.7 Validation techniques employed for market sizing

16.8 Data synthesis

16.9 360 degree market analysis

16.10 List of abbreviations

Research Methodology

Technavio presents a detailed picture of the market by way of study, synthesis, and summation of data from multiple sources. The analysts have presented the various facets of the market with a particular focus on identifying the key industry influencers. The data thus presented is comprehensive, reliable, and the result of extensive research, both primary and secondary.

INFORMATION SOURCES

Primary sources

  • Manufacturers and suppliers
  • Channel partners
  • Industry experts
  • Strategic decision makers

Secondary sources

  • Industry journals and periodicals
  • Government data
  • Financial reports of key industry players
  • Historical data
  • Press releases

DATA ANALYSIS

Data Synthesis

  • Collation of data
  • Estimation of key figures
  • Analysis of derived insights

Data Validation

  • Triangulation with data models
  • Reference against proprietary databases
  • Corroboration with industry experts

REPORT WRITING

Qualitative

  • Market drivers
  • Market challenges
  • Market trends
  • Five forces analysis

Quantitative

  • Market size and forecast
  • Market segmentation
  • Geographical insights
  • Competitive landscape

Interested in this report?

Get your sample now to see our research methodology and insights!

Download Now

Frequently Asked Questions

Automotive Premium Tires market growth will increase by USD 47790.5 million during 2026-2030.

The Automotive Premium Tires market is expected to grow at a CAGR of 12.1% during 2026-2030.

Automotive Premium Tires market is segmented by End-user (Replacement, OEM) Product type (Radial tires, Bias-ply tires) Vehicle type (Passenger cars, Commercial vehicle)

Apollo Tyres Ltd., BFGoodrich, Bridgestone Corp., CEAT Ltd., Continental AG, Cooper Tire and Rubber Co., Falken Tire Corp., Giti Tire Pte. Ltd., Hankook Tire and Technology Co., JK Tyre and Industries Ltd., Kenda Rubber Industrial Co. Ltd., Kumho Tire Co. Inc., Maxxis International, Michelin, MRF Ltd., Nexen Tire Corp., Nokian Tyres Plc, Pirelli and C. S.p.A., Sailun Group, Toyo Tire Corp., Triangle Tire Co. Ltd., Yokohama Tire Corp., Zhongce Rubber Group Co. Ltd. are a few of the key vendors in the Automotive Premium Tires market.

North America will register the highest growth rate of 44.5% among the other regions. Therefore, the Automotive Premium Tires market in North America is expected to garner significant business opportunities for the vendors during the forecast period.

US, Canada, Mexico, China, Japan, India, South Korea, Australia, Indonesia, Germany, UK, France, Italy, Spain, The Netherlands, Saudi Arabia, UAE, South Africa, Israel, Turkey, Brazil, Argentina, Chile

  • Electric vehicle adoption drives premium demand is the driving factor this market.

The Automotive Premium Tires market vendors should focus on grabbing business opportunities from the End-user segment as it accounted for the largest market share in the base year.
RIA - Research AI Assistant
Ask RIA
