Automotive Silicones Market Analysis, Size, and Forecast 2026-2030: APAC (China, Japan, and India), Europe (Germany, France, and UK), North America (US, Canada, and Mexico), South America (Brazil and Argentina), Middle East and Africa (South Africa, Saudi Arabia, and UAE), and Rest of World (ROW)

Automotive Silicones Market Analysis, Size, and Forecast 2026-2030:
APAC (China, Japan, and India), Europe (Germany, France, and UK), North America (US, Canada, and Mexico), South America (Brazil and Argentina), Middle East and Africa (South Africa, Saudi Arabia, and UAE), and Rest of World (ROW)

Published: Dec 2025 324 Pages SKU: IRTNTR44782

Market Overview at a Glance

$1.32 B
Market Opportunity
6.6%
CAGR 2025 - 2030
55.3%
APAC Growth
$1.29 B
Interior and exterior segment 2024

Automotive Silicones Market Size 2026-2030

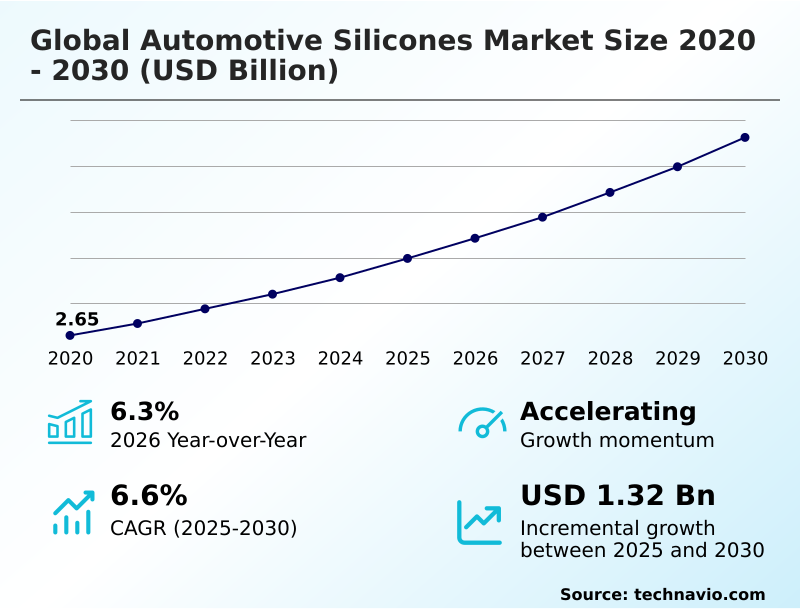
The automotive silicones market size is valued to increase by USD 1.32 billion, at a CAGR of 6.6% from 2025 to 2030. Rising demand for EV specific thermal and insulation solutions will drive the automotive silicones market.

Major Market Trends & Insights

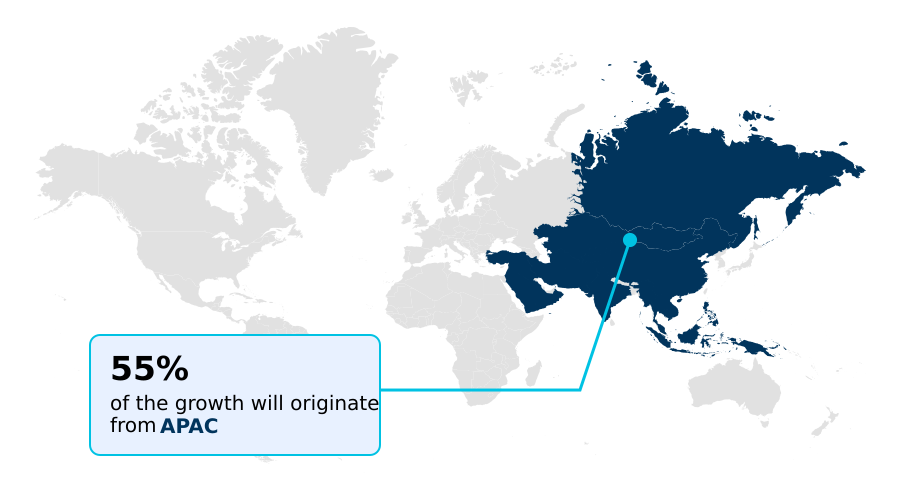
  • APAC dominated the market and accounted for a 55.3% growth during the forecast period.
  • By Application - Interior and exterior segment was valued at USD 1.29 billion in 2024
  • By Type - Elastomers segment accounted for the largest market revenue share in 2024

Market Size & Forecast

  • Market Opportunities: USD 2.16 billion
  • Market Future Opportunities: USD 1.32 billion
  • CAGR from 2025 to 2030 : 6.6%

Market Summary

What will be the Size of the Automotive Silicones Market during the forecast period?

Get Key Insights on Market Forecast (PDF) Request Free Sample

How is the Automotive Silicones Market Segmented?

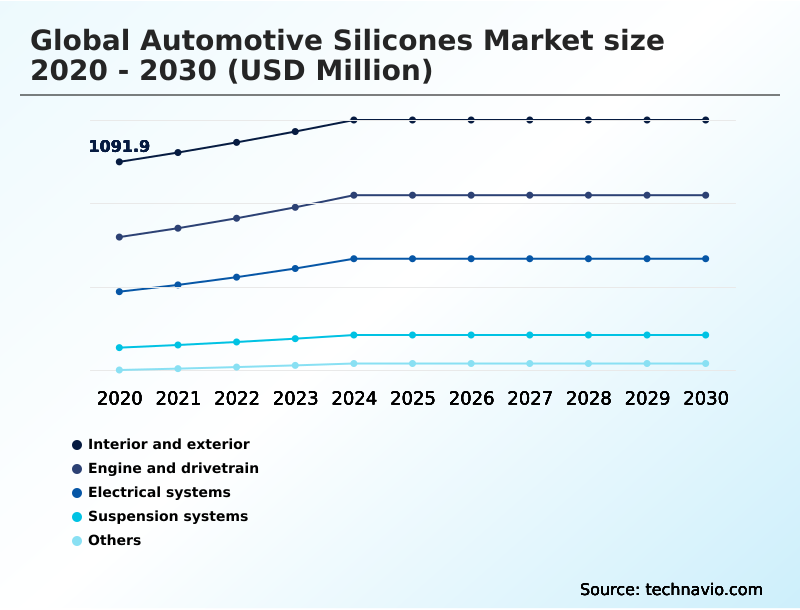
The automotive silicones industry research report provides comprehensive data (region-wise segment analysis), with forecasts and estimates in "USD million" for the period 2026-2030, as well as historical data from 2020-2024 for the following segments.

  • Application
    • Interior and exterior
    • Engine and drivetrain
    • Electrical systems
    • Suspension systems
    • Others
  • Type
    • Elastomers
    • Fluids
    • Resins
    • Gels
  • Technology
    • High-temperature vulcanized
    • Liquid silicone rubber
    • Room-temperature vulcanized
    • Others
  • Geography
    • APAC
      • China
      • Japan
      • India
    • Europe
      • Germany
      • France
      • UK
    • North America
      • US
      • Canada
      • Mexico
    • South America
      • Brazil
      • Argentina
    • Middle East and Africa
      • South Africa
      • Saudi Arabia
      • UAE
    • Rest of World (ROW)

By Application Insights

The interior and exterior segment is estimated to witness significant growth during the forecast period.

Request Free Sample

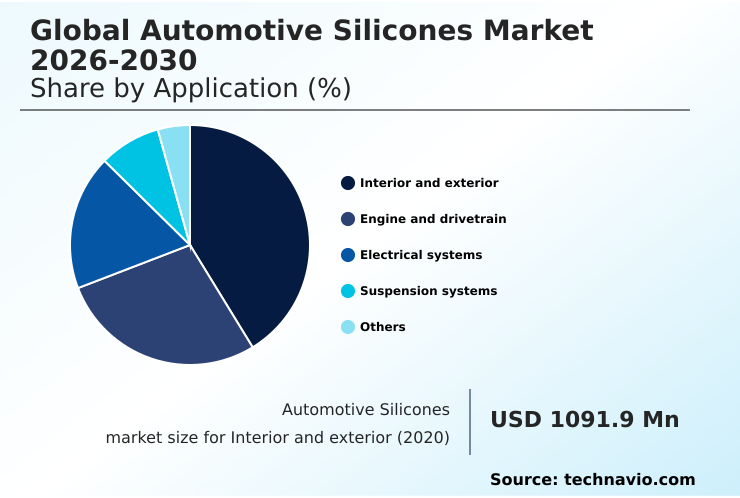
The Interior and exterior segment was valued at USD 1.29 billion in 2024 and showed a gradual increase during the forecast period.

Request Free Sample

Regional Analysis

APAC is estimated to contribute 55.3% to the growth of the global market during the forecast period.Technavio’s analysts have elaborately explained the regional trends and drivers that shape the market during the forecast period.

See How Automotive Silicones Market Demand is Rising in APAC Request Free Sample

Market Dynamics

Our researchers analyzed the data with 2025 as the base year, along with the key drivers, trends, and challenges. A holistic analysis of drivers will help companies refine their marketing strategies to gain a competitive advantage.

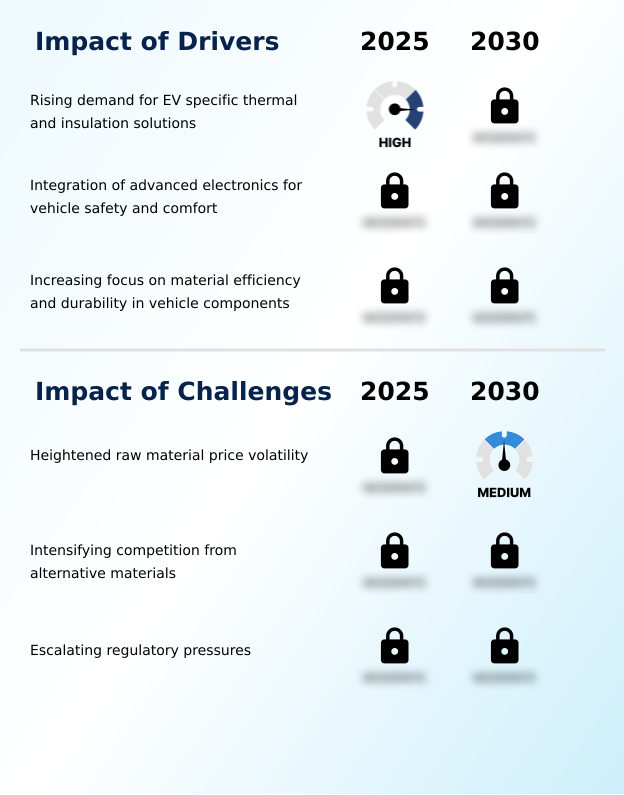
What are the key market drivers leading to the rise in the adoption of Automotive Silicones Industry?

What are the market trends shaping the Automotive Silicones Industry?

What challenges does the Automotive Silicones Industry face during its growth?

Exclusive Technavio Analysis on Customer Landscape

The automotive silicones market forecasting report includes the adoption lifecycle of the market, covering from the innovator’s stage to the laggard’s stage. It focuses on adoption rates in different regions based on penetration. Furthermore, the automotive silicones market report also includes key purchase criteria and drivers of price sensitivity to help companies evaluate and develop their market growth analysis strategies.

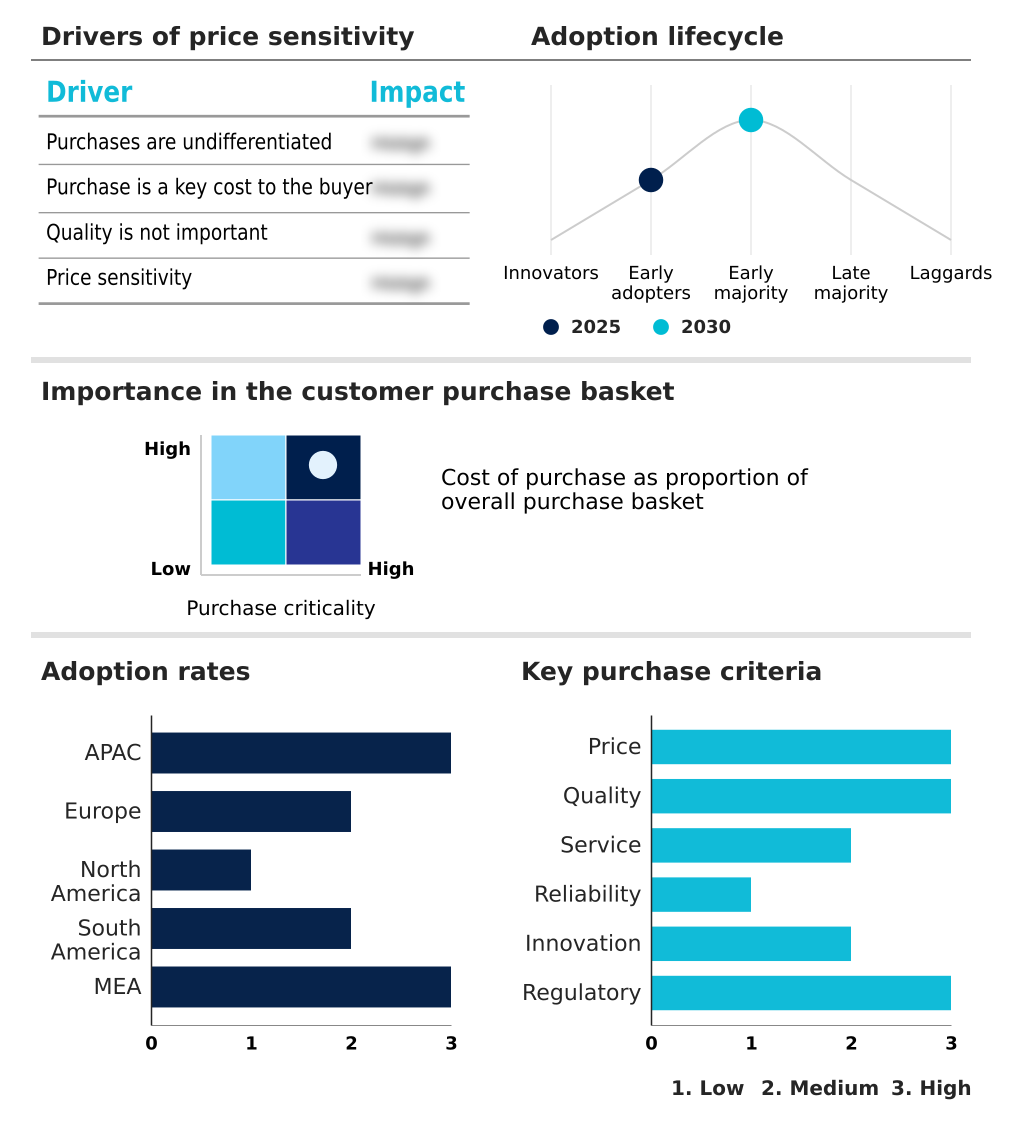
Customer Landscape of Automotive Silicones Industry

Competitive Landscape

Companies are implementing various strategies, such as strategic alliances, automotive silicones market forecast, partnerships, mergers and acquisitions, geographical expansion, and product/service launches, to enhance their presence in the industry.

Avantor Inc. -

The industry research and growth report includes detailed analyses of the competitive landscape of the market and information about key companies, including:

  • Avantor Inc.
  • BASF SE
  • CHT Germany GmbH
  • CRI SIL Silicone Technologies
  • CSL Silicones Inc.
  • Dow Chemical Co.
  • Elkem ASA
  • Evonik Industries AG
  • Gelest Inc.
  • H.B. Fuller Co.
  • Henkel AG and Co. KGaA
  • Kaneka Corp.
  • Momentive Materials Inc.
  • Primasil Silicones Ltd.
  • Rogers Corp.
  • Shin Etsu Chemical Co. Ltd.
  • Silicone Engineering Ltd.
  • Siltech Corp.
  • Wacker Chemie AG

Qualitative and quantitative analysis of companies has been conducted to help clients understand the wider business environment as well as the strengths and weaknesses of key industry players. Data is qualitatively analyzed to categorize companies as pure play, category-focused, industry-focused, and diversified; it is quantitatively analyzed to categorize companies as dominant, leading, strong, tentative, and weak.

Recent Development and News in Automotive silicones market

Dive into Technavio’s robust research methodology, blending expert interviews, extensive data synthesis, and validated models for unparalleled Automotive Silicones Market insights. See full methodology.

Market Scope
Page number 324
Base year 2025
Historic period 2020-2024
Forecast period 2026-2030
Growth momentum & CAGR Accelerate at a CAGR of 6.6%
Market growth 2026-2030 USD 1319.2 million
Market structure Fragmented
YoY growth 2025-2026(%) 6.3%
Key countries China, Japan, India, South Korea, Australia, Indonesia, Germany, France, UK, Italy, Spain, The Netherlands, US, Canada, Mexico, Brazil, Argentina, Chile, South Africa, Saudi Arabia, UAE, Turkey and Israel
Competitive landscape Leading Companies, Market Positioning of Companies, Competitive Strategies, and Industry Risks

Request Free Sample

Research Analyst Overview

What are the Key Data Covered in this Automotive Silicones Market Research and Growth Report?

  • What is the expected growth of the Automotive Silicones Market between 2026 and 2030?

    • USD 1.32 billion, at a CAGR of 6.6%

  • What segmentation does the market report cover?

    • The report is segmented by Application (Interior and exterior, Engine and drivetrain, Electrical systems, Suspension systems, and Others), Type (Elastomers, Fluids, Resins, and Gels), Technology (High-temperature vulcanized, Liquid silicone rubber, Room-temperature vulcanized, and Others) and Geography (APAC, Europe, North America, South America, Middle East and Africa)

  • Which regions are analyzed in the report?

    • APAC, Europe, North America, South America and Middle East and Africa

  • What are the key growth drivers and market challenges?

    • Rising demand for EV specific thermal and insulation solutions, Heightened raw material price volatility

  • Who are the major players in the Automotive Silicones Market?

    • Avantor Inc., BASF SE, CHT Germany GmbH, CRI SIL Silicone Technologies, CSL Silicones Inc., Dow Chemical Co., Elkem ASA, Evonik Industries AG, Gelest Inc., H.B. Fuller Co., Henkel AG and Co. KGaA, Kaneka Corp., Momentive Materials Inc., Primasil Silicones Ltd., Rogers Corp., Shin Etsu Chemical Co. Ltd., Silicone Engineering Ltd., Siltech Corp. and Wacker Chemie AG

Market Research Insights

We can help! Our analysts can customize this automotive silicones market research report to meet your requirements.

Get in touch

1. Executive Summary

1.1 Market overview

Executive Summary - Chart on Market Overview
Executive Summary - Data Table on Market Overview
Executive Summary - Chart on Global Market Characteristics
Executive Summary - Chart on Market by Geography
Executive Summary - Chart on Market Segmentation by Application
Executive Summary - Chart on Market Segmentation by Type
Executive Summary - Chart on Market Segmentation by Technology
Executive Summary - Chart on Incremental Growth
Executive Summary - Data Table on Incremental Growth
Executive Summary - Chart on Company Market Positioning

2. Technavio Analysis

2.1 Analysis of price sensitivity, lifecycle, customer purchase basket, adoption rates, and purchase criteria

2.2 Criticality of inputs and Factors of differentiation

Chart on Overview on criticality of inputs and factors of differentiation

2.3 Factors of disruption

Chart on Overview on factors of disruption

2.4 Impact of drivers and challenges

Chart on Impact of drivers and challenges in 2025 and 2030

3. Market Landscape

3.1 Market ecosystem

Chart on Parent Market
Data Table on - Parent Market

3.2 Market characteristics

Chart on Market characteristics analysis

3.3 Value chain analysis

Chart on Value chain analysis

4. Market Sizing

4.1 Market definition

Data Table on Offerings of companies included in the market definition

4.2 Market segment analysis

Market segments

4.3 Market size 2025

4.4 Market outlook: Forecast for 2025-2030

Chart on Global - Market size and forecast 2025-2030 ($ million)
Data Table on Global - Market size and forecast 2025-2030 ($ million)
Chart on Global Market: Year-over-year growth 2025-2030 (%)
Data Table on Global Market: Year-over-year growth 2025-2030 (%)

5. Historic Market Size

5.1 Global Automotive Silicones Market 2020 - 2024

Historic Market Size - Data Table on Global Automotive Silicones Market 2020 - 2024 ($ million)

5.2 Application segment analysis 2020 - 2024

Historic Market Size - Application Segment 2020 - 2024 ($ million)

5.3 Type segment analysis 2020 - 2024

Historic Market Size - Type Segment 2020 - 2024 ($ million)

5.4 Technology segment analysis 2020 - 2024

Historic Market Size - Technology Segment 2020 - 2024 ($ million)

5.5 Geography segment analysis 2020 - 2024

Historic Market Size - Geography Segment 2020 - 2024 ($ million)

5.6 Country segment analysis 2020 - 2024

Historic Market Size - Country Segment 2020 - 2024 ($ million)

6. Qualitative Analysis

6.1 Impact of AI in the global automotive silicones market

7. Five Forces Analysis

7.1 Five forces summary

Five forces analysis - Comparison between 2025 and 2030

7.2 Bargaining power of buyers

Bargaining power of buyers - Impact of key factors 2025 and 2030

7.3 Bargaining power of suppliers

Bargaining power of suppliers - Impact of key factors in 2025 and 2030

7.4 Threat of new entrants

Threat of new entrants - Impact of key factors in 2025 and 2030

7.5 Threat of substitutes

Threat of substitutes - Impact of key factors in 2025 and 2030

7.6 Threat of rivalry

Threat of rivalry - Impact of key factors in 2025 and 2030

7.7 Market condition

Chart on Market condition - Five forces 2025 and 2030

8. Market Segmentation by Application

8.1 Market segments

Chart on Application - Market share 2025-2030 (%)
Data Table on Application - Market share 2025-2030 (%)

8.2 Comparison by Application

Chart on Comparison by Application
Data Table on Comparison by Application

8.3 Interior and exterior - Market size and forecast 2025-2030

Chart on Interior and exterior - Market size and forecast 2025-2030 ($ million)
Data Table on Interior and exterior - Market size and forecast 2025-2030 ($ million)
Chart on Interior and exterior - Year-over-year growth 2025-2030 (%)
Data Table on Interior and exterior - Year-over-year growth 2025-2030 (%)

8.4 Engine and drivetrain - Market size and forecast 2025-2030

Chart on Engine and drivetrain - Market size and forecast 2025-2030 ($ million)
Data Table on Engine and drivetrain - Market size and forecast 2025-2030 ($ million)
Chart on Engine and drivetrain - Year-over-year growth 2025-2030 (%)
Data Table on Engine and drivetrain - Year-over-year growth 2025-2030 (%)

8.5 Electrical systems - Market size and forecast 2025-2030

Chart on Electrical systems - Market size and forecast 2025-2030 ($ million)
Data Table on Electrical systems - Market size and forecast 2025-2030 ($ million)
Chart on Electrical systems - Year-over-year growth 2025-2030 (%)
Data Table on Electrical systems - Year-over-year growth 2025-2030 (%)

8.6 Suspension systems - Market size and forecast 2025-2030

Chart on Suspension systems - Market size and forecast 2025-2030 ($ million)
Data Table on Suspension systems - Market size and forecast 2025-2030 ($ million)
Chart on Suspension systems - Year-over-year growth 2025-2030 (%)
Data Table on Suspension systems - Year-over-year growth 2025-2030 (%)

8.7 Others - Market size and forecast 2025-2030

Chart on Others - Market size and forecast 2025-2030 ($ million)
Data Table on Others - Market size and forecast 2025-2030 ($ million)
Chart on Others - Year-over-year growth 2025-2030 (%)
Data Table on Others - Year-over-year growth 2025-2030 (%)

8.8 Market opportunity by Application

Market opportunity by Application ($ million)
Data Table on Market opportunity by Application ($ million)

9. Market Segmentation by Type

9.1 Market segments

Chart on Type - Market share 2025-2030 (%)
Data Table on Type - Market share 2025-2030 (%)

9.2 Comparison by Type

Chart on Comparison by Type
Data Table on Comparison by Type

9.3 Elastomers - Market size and forecast 2025-2030

Chart on Elastomers - Market size and forecast 2025-2030 ($ million)
Data Table on Elastomers - Market size and forecast 2025-2030 ($ million)
Chart on Elastomers - Year-over-year growth 2025-2030 (%)
Data Table on Elastomers - Year-over-year growth 2025-2030 (%)

9.4 Fluids - Market size and forecast 2025-2030

Chart on Fluids - Market size and forecast 2025-2030 ($ million)
Data Table on Fluids - Market size and forecast 2025-2030 ($ million)
Chart on Fluids - Year-over-year growth 2025-2030 (%)
Data Table on Fluids - Year-over-year growth 2025-2030 (%)

9.5 Resins - Market size and forecast 2025-2030

Chart on Resins - Market size and forecast 2025-2030 ($ million)
Data Table on Resins - Market size and forecast 2025-2030 ($ million)
Chart on Resins - Year-over-year growth 2025-2030 (%)
Data Table on Resins - Year-over-year growth 2025-2030 (%)

9.6 Gels - Market size and forecast 2025-2030

Chart on Gels - Market size and forecast 2025-2030 ($ million)
Data Table on Gels - Market size and forecast 2025-2030 ($ million)
Chart on Gels - Year-over-year growth 2025-2030 (%)
Data Table on Gels - Year-over-year growth 2025-2030 (%)

9.7 Market opportunity by Type

Market opportunity by Type ($ million)
Data Table on Market opportunity by Type ($ million)

10. Market Segmentation by Technology

10.1 Market segments

Chart on Technology - Market share 2025-2030 (%)
Data Table on Technology - Market share 2025-2030 (%)

10.2 Comparison by Technology

Chart on Comparison by Technology
Data Table on Comparison by Technology

10.3 High-temperature vulcanized - Market size and forecast 2025-2030

Chart on High-temperature vulcanized - Market size and forecast 2025-2030 ($ million)
Data Table on High-temperature vulcanized - Market size and forecast 2025-2030 ($ million)
Chart on High-temperature vulcanized - Year-over-year growth 2025-2030 (%)
Data Table on High-temperature vulcanized - Year-over-year growth 2025-2030 (%)

10.4 Liquid silicone rubber - Market size and forecast 2025-2030

Chart on Liquid silicone rubber - Market size and forecast 2025-2030 ($ million)
Data Table on Liquid silicone rubber - Market size and forecast 2025-2030 ($ million)
Chart on Liquid silicone rubber - Year-over-year growth 2025-2030 (%)
Data Table on Liquid silicone rubber - Year-over-year growth 2025-2030 (%)

10.5 Room-temperature vulcanized - Market size and forecast 2025-2030

Chart on Room-temperature vulcanized - Market size and forecast 2025-2030 ($ million)
Data Table on Room-temperature vulcanized - Market size and forecast 2025-2030 ($ million)
Chart on Room-temperature vulcanized - Year-over-year growth 2025-2030 (%)
Data Table on Room-temperature vulcanized - Year-over-year growth 2025-2030 (%)

10.6 Others - Market size and forecast 2025-2030

Chart on Others - Market size and forecast 2025-2030 ($ million)
Data Table on Others - Market size and forecast 2025-2030 ($ million)
Chart on Others - Year-over-year growth 2025-2030 (%)
Data Table on Others - Year-over-year growth 2025-2030 (%)

10.7 Market opportunity by Technology

Market opportunity by Technology ($ million)
Data Table on Market opportunity by Technology ($ million)

11. Customer Landscape

11.1 Customer landscape overview

Analysis of price sensitivity, lifecycle, customer purchase basket, adoption rates, and purchase criteria

12. Geographic Landscape

12.1 Geographic segmentation

Chart on Market share by geography 2025-2030 (%)
Data Table on Market share by geography 2025-2030 (%)

12.2 Geographic comparison

Chart on Geographic comparison
Data Table on Geographic comparison

12.3 APAC - Market size and forecast 2025-2030

Chart on APAC - Market size and forecast 2025-2030 ($ million)
Data Table on APAC - Market size and forecast 2025-2030 ($ million)
Chart on APAC - Year-over-year growth 2025-2030 (%)
Data Table on APAC - Year-over-year growth 2025-2030 (%)
Chart on Regional Comparison - APAC
Data Table on Regional Comparison - APAC

12.3.1 China - Market size and forecast 2025-2030

Chart on China - Market size and forecast 2025-2030 ($ million)
Data Table on China - Market size and forecast 2025-2030 ($ million)
Chart on China - Year-over-year growth 2025-2030 (%)
Data Table on China - Year-over-year growth 2025-2030 (%)

12.3.2 Japan - Market size and forecast 2025-2030

Chart on Japan - Market size and forecast 2025-2030 ($ million)
Data Table on Japan - Market size and forecast 2025-2030 ($ million)
Chart on Japan - Year-over-year growth 2025-2030 (%)
Data Table on Japan - Year-over-year growth 2025-2030 (%)

12.3.3 India - Market size and forecast 2025-2030

Chart on India - Market size and forecast 2025-2030 ($ million)
Data Table on India - Market size and forecast 2025-2030 ($ million)
Chart on India - Year-over-year growth 2025-2030 (%)
Data Table on India - Year-over-year growth 2025-2030 (%)

12.3.4 South Korea - Market size and forecast 2025-2030

Chart on South Korea - Market size and forecast 2025-2030 ($ million)
Data Table on South Korea - Market size and forecast 2025-2030 ($ million)
Chart on South Korea - Year-over-year growth 2025-2030 (%)
Data Table on South Korea - Year-over-year growth 2025-2030 (%)

12.3.5 Australia - Market size and forecast 2025-2030

Chart on Australia - Market size and forecast 2025-2030 ($ million)
Data Table on Australia - Market size and forecast 2025-2030 ($ million)
Chart on Australia - Year-over-year growth 2025-2030 (%)
Data Table on Australia - Year-over-year growth 2025-2030 (%)

12.3.6 Indonesia - Market size and forecast 2025-2030

Chart on Indonesia - Market size and forecast 2025-2030 ($ million)
Data Table on Indonesia - Market size and forecast 2025-2030 ($ million)
Chart on Indonesia - Year-over-year growth 2025-2030 (%)
Data Table on Indonesia - Year-over-year growth 2025-2030 (%)

12.4 Europe - Market size and forecast 2025-2030

Chart on Europe - Market size and forecast 2025-2030 ($ million)
Data Table on Europe - Market size and forecast 2025-2030 ($ million)
Chart on Europe - Year-over-year growth 2025-2030 (%)
Data Table on Europe - Year-over-year growth 2025-2030 (%)
Chart on Regional Comparison - Europe
Data Table on Regional Comparison - Europe

12.4.1 Germany - Market size and forecast 2025-2030

Chart on Germany - Market size and forecast 2025-2030 ($ million)
Data Table on Germany - Market size and forecast 2025-2030 ($ million)
Chart on Germany - Year-over-year growth 2025-2030 (%)
Data Table on Germany - Year-over-year growth 2025-2030 (%)

12.4.2 France - Market size and forecast 2025-2030

Chart on France - Market size and forecast 2025-2030 ($ million)
Data Table on France - Market size and forecast 2025-2030 ($ million)
Chart on France - Year-over-year growth 2025-2030 (%)
Data Table on France - Year-over-year growth 2025-2030 (%)

12.4.3 UK - Market size and forecast 2025-2030

Chart on UK - Market size and forecast 2025-2030 ($ million)
Data Table on UK - Market size and forecast 2025-2030 ($ million)
Chart on UK - Year-over-year growth 2025-2030 (%)
Data Table on UK - Year-over-year growth 2025-2030 (%)

12.4.4 Italy - Market size and forecast 2025-2030

Chart on Italy - Market size and forecast 2025-2030 ($ million)
Data Table on Italy - Market size and forecast 2025-2030 ($ million)
Chart on Italy - Year-over-year growth 2025-2030 (%)
Data Table on Italy - Year-over-year growth 2025-2030 (%)

12.4.5 Spain - Market size and forecast 2025-2030

Chart on Spain - Market size and forecast 2025-2030 ($ million)
Data Table on Spain - Market size and forecast 2025-2030 ($ million)
Chart on Spain - Year-over-year growth 2025-2030 (%)
Data Table on Spain - Year-over-year growth 2025-2030 (%)

12.4.6 The Netherlands - Market size and forecast 2025-2030

Chart on The Netherlands - Market size and forecast 2025-2030 ($ million)
Data Table on The Netherlands - Market size and forecast 2025-2030 ($ million)
Chart on The Netherlands - Year-over-year growth 2025-2030 (%)
Data Table on The Netherlands - Year-over-year growth 2025-2030 (%)

12.5 North America - Market size and forecast 2025-2030

Chart on North America - Market size and forecast 2025-2030 ($ million)
Data Table on North America - Market size and forecast 2025-2030 ($ million)
Chart on North America - Year-over-year growth 2025-2030 (%)
Data Table on North America - Year-over-year growth 2025-2030 (%)
Chart on Regional Comparison - North America
Data Table on Regional Comparison - North America

12.5.1 US - Market size and forecast 2025-2030

Chart on US - Market size and forecast 2025-2030 ($ million)
Data Table on US - Market size and forecast 2025-2030 ($ million)
Chart on US - Year-over-year growth 2025-2030 (%)
Data Table on US - Year-over-year growth 2025-2030 (%)

12.5.2 Canada - Market size and forecast 2025-2030

Chart on Canada - Market size and forecast 2025-2030 ($ million)
Data Table on Canada - Market size and forecast 2025-2030 ($ million)
Chart on Canada - Year-over-year growth 2025-2030 (%)
Data Table on Canada - Year-over-year growth 2025-2030 (%)

12.5.3 Mexico - Market size and forecast 2025-2030

Chart on Mexico - Market size and forecast 2025-2030 ($ million)
Data Table on Mexico - Market size and forecast 2025-2030 ($ million)
Chart on Mexico - Year-over-year growth 2025-2030 (%)
Data Table on Mexico - Year-over-year growth 2025-2030 (%)

12.6 South America - Market size and forecast 2025-2030

Chart on South America - Market size and forecast 2025-2030 ($ million)
Data Table on South America - Market size and forecast 2025-2030 ($ million)
Chart on South America - Year-over-year growth 2025-2030 (%)
Data Table on South America - Year-over-year growth 2025-2030 (%)
Chart on Regional Comparison - South America
Data Table on Regional Comparison - South America

12.6.1 Brazil - Market size and forecast 2025-2030

Chart on Brazil - Market size and forecast 2025-2030 ($ million)
Data Table on Brazil - Market size and forecast 2025-2030 ($ million)
Chart on Brazil - Year-over-year growth 2025-2030 (%)
Data Table on Brazil - Year-over-year growth 2025-2030 (%)

12.6.2 Argentina - Market size and forecast 2025-2030

Chart on Argentina - Market size and forecast 2025-2030 ($ million)
Data Table on Argentina - Market size and forecast 2025-2030 ($ million)
Chart on Argentina - Year-over-year growth 2025-2030 (%)
Data Table on Argentina - Year-over-year growth 2025-2030 (%)

12.6.3 Chile - Market size and forecast 2025-2030

Chart on Chile - Market size and forecast 2025-2030 ($ million)
Data Table on Chile - Market size and forecast 2025-2030 ($ million)
Chart on Chile - Year-over-year growth 2025-2030 (%)
Data Table on Chile - Year-over-year growth 2025-2030 (%)

12.7 Middle East and Africa - Market size and forecast 2025-2030

Chart on Middle East and Africa - Market size and forecast 2025-2030 ($ million)
Data Table on Middle East and Africa - Market size and forecast 2025-2030 ($ million)
Chart on Middle East and Africa - Year-over-year growth 2025-2030 (%)
Data Table on Middle East and Africa - Year-over-year growth 2025-2030 (%)
Chart on Regional Comparison - Middle East and Africa
Data Table on Regional Comparison - Middle East and Africa

12.7.1 South Africa - Market size and forecast 2025-2030

Chart on South Africa - Market size and forecast 2025-2030 ($ million)
Data Table on South Africa - Market size and forecast 2025-2030 ($ million)
Chart on South Africa - Year-over-year growth 2025-2030 (%)
Data Table on South Africa - Year-over-year growth 2025-2030 (%)

12.7.2 Saudi Arabia - Market size and forecast 2025-2030

Chart on Saudi Arabia - Market size and forecast 2025-2030 ($ million)
Data Table on Saudi Arabia - Market size and forecast 2025-2030 ($ million)
Chart on Saudi Arabia - Year-over-year growth 2025-2030 (%)
Data Table on Saudi Arabia - Year-over-year growth 2025-2030 (%)

12.7.3 UAE - Market size and forecast 2025-2030

Chart on UAE - Market size and forecast 2025-2030 ($ million)
Data Table on UAE - Market size and forecast 2025-2030 ($ million)
Chart on UAE - Year-over-year growth 2025-2030 (%)
Data Table on UAE - Year-over-year growth 2025-2030 (%)

12.7.4 Turkey - Market size and forecast 2025-2030

Chart on Turkey - Market size and forecast 2025-2030 ($ million)
Data Table on Turkey - Market size and forecast 2025-2030 ($ million)
Chart on Turkey - Year-over-year growth 2025-2030 (%)
Data Table on Turkey - Year-over-year growth 2025-2030 (%)

12.7.5 Israel - Market size and forecast 2025-2030

Chart on Israel - Market size and forecast 2025-2030 ($ million)
Data Table on Israel - Market size and forecast 2025-2030 ($ million)
Chart on Israel - Year-over-year growth 2025-2030 (%)
Data Table on Israel - Year-over-year growth 2025-2030 (%)

12.8 Market opportunity by geography

Market opportunity by geography ($ million)
Data Tables on Market opportunity by geography ($ million)

13. Drivers, Challenges, and Opportunity

13.1 Market drivers

Rising demand for EV specific thermal and insulation solutions
Integration of advanced electronics for vehicle safety and comfort
Increasing focus on material efficiency and durability in vehicle components

13.2 Market challenges

Heightened raw material price volatility
Intensifying competition from alternative materials
Escalating regulatory pressures

13.3 Impact of drivers and challenges

Impact of drivers and challenges in 2025 and 2030

13.4 Market opportunities

Growing momentum of next-generation vehicle technologies
Proliferation of advanced driver assistance systems (ADAS)
Innovations in lightweight material engineering

14. Competitive Landscape

14.1 Overview

14.2

Overview on criticality of inputs and factors of differentiation

14.3 Landscape disruption

Overview on factors of disruption

14.4 Industry risks

Impact of key risks on business

15. Competitive Analysis

15.1 Companies profiled

Companies covered

15.2 Company ranking index

15.3 Market positioning of companies

Matrix on companies position and classification

15.4 Avantor Inc.

Avantor Inc. - Overview
Avantor Inc. - Product / Service
Avantor Inc. - Key offerings
SWOT

15.5 BASF SE

BASF SE - Overview
BASF SE - Business segments
BASF SE - Key news
BASF SE - Key offerings
BASF SE - Segment focus
SWOT

15.6 CHT Germany GmbH

CHT Germany GmbH - Overview
CHT Germany GmbH - Product / Service
CHT Germany GmbH - Key news
CHT Germany GmbH - Key offerings
SWOT

15.7 Dow Chemical Co.

Dow Chemical Co. - Overview
Dow Chemical Co. - Business segments
Dow Chemical Co. - Key news
Dow Chemical Co. - Key offerings
Dow Chemical Co. - Segment focus
SWOT

15.8 Elkem ASA

Elkem ASA - Overview
Elkem ASA - Business segments
Elkem ASA - Key offerings
Elkem ASA - Segment focus
SWOT

15.9 Evonik Industries AG

Evonik Industries AG - Overview
Evonik Industries AG - Business segments
Evonik Industries AG - Key news
Evonik Industries AG - Key offerings
Evonik Industries AG - Segment focus
SWOT

15.10 Gelest Inc.

Gelest Inc. - Overview
Gelest Inc. - Product / Service
Gelest Inc. - Key offerings
SWOT

15.11 H.B. Fuller Co.

H.B. Fuller Co. - Overview
H.B. Fuller Co. - Business segments
H.B. Fuller Co. - Key news
H.B. Fuller Co. - Key offerings
H.B. Fuller Co. - Segment focus
SWOT

15.12 Henkel AG and Co. KGaA

Henkel AG and Co. KGaA - Overview
Henkel AG and Co. KGaA - Business segments
Henkel AG and Co. KGaA - Key news
Henkel AG and Co. KGaA - Key offerings
Henkel AG and Co. KGaA - Segment focus
SWOT

15.13 Kaneka Corp.

Kaneka Corp. - Overview
Kaneka Corp. - Business segments
Kaneka Corp. - Key news
Kaneka Corp. - Key offerings
Kaneka Corp. - Segment focus
SWOT

15.14 Momentive Materials Inc.

Momentive Materials Inc. - Overview
Momentive Materials Inc. - Product / Service
Momentive Materials Inc. - Key offerings
SWOT

15.15 Rogers Corp.

Rogers Corp. - Overview
Rogers Corp. - Business segments
Rogers Corp. - Key news
Rogers Corp. - Key offerings
Rogers Corp. - Segment focus
SWOT

15.16 Shin Etsu Chemical Co. Ltd.

Shin Etsu Chemical Co. Ltd. - Overview
Shin Etsu Chemical Co. Ltd. - Business segments
Shin Etsu Chemical Co. Ltd. - Key offerings
Shin Etsu Chemical Co. Ltd. - Segment focus
SWOT

15.17 Siltech Corp.

Siltech Corp. - Overview
Siltech Corp. - Product / Service
Siltech Corp. - Key offerings
SWOT

15.18 Wacker Chemie AG

Wacker Chemie AG - Overview
Wacker Chemie AG - Business segments
Wacker Chemie AG - Key news
Wacker Chemie AG - Key offerings
Wacker Chemie AG - Segment focus
SWOT

16. Appendix

16.1 Scope of the report

Market definition
Objectives
Notes and caveats

16.2 Inclusions and exclusions checklist

Inclusions checklist
Exclusions checklist

16.3 Currency conversion rates for US$

16.4 Research methodology

16.5 Data procurement

Information sources

16.6 Data validation

16.7 Validation techniques employed for market sizing

16.8 Data synthesis

16.9 360 degree market analysis

16.10 List of abbreviations

Research Methodology

Technavio presents a detailed picture of the market by way of study, synthesis, and summation of data from multiple sources. The analysts have presented the various facets of the market with a particular focus on identifying the key industry influencers. The data thus presented is comprehensive, reliable, and the result of extensive research, both primary and secondary.

INFORMATION SOURCES

Primary sources

  • Manufacturers and suppliers
  • Channel partners
  • Industry experts
  • Strategic decision makers

Secondary sources

  • Industry journals and periodicals
  • Government data
  • Financial reports of key industry players
  • Historical data
  • Press releases

DATA ANALYSIS

Data Synthesis

  • Collation of data
  • Estimation of key figures
  • Analysis of derived insights

Data Validation

  • Triangulation with data models
  • Reference against proprietary databases
  • Corroboration with industry experts

REPORT WRITING

Qualitative

  • Market drivers
  • Market challenges
  • Market trends
  • Five forces analysis

Quantitative

  • Market size and forecast
  • Market segmentation
  • Geographical insights
  • Competitive landscape

Interested in this report?

Get your sample now to see our research methodology and insights!

Download Now

Frequently Asked Questions

Automotive Silicones market growth will increase by USD 1319.2 million during 2026-2030 .

The Automotive Silicones market is expected to grow at a CAGR of 6.6% during 2026-2030 .

Automotive Silicones market is segmented by Application (Interior and exterior, Engine and drivetrain, Electrical systems, Suspension systems, Others) Type (Elastomers, Fluids, Resins, Gels) Technology (High-temperature vulcanized, Liquid silicone rubber, Room-temperature vulcanized, Others)

Avantor Inc., BASF SE, CHT Germany GmbH, CRI SIL Silicone Technologies, CSL Silicones Inc., Dow Chemical Co., Elkem ASA, Evonik Industries AG, Gelest Inc., H.B. Fuller Co., Henkel AG and Co. KGaA, Kaneka Corp., Momentive Materials Inc., Primasil Silicones Ltd., Rogers Corp., Shin Etsu Chemical Co. Ltd., Silicone Engineering Ltd., Siltech Corp., Wacker Chemie AG are a few of the key vendors in the Automotive Silicones market.

APAC will register the highest growth rate of 55.3% among the other regions. Therefore, the Automotive Silicones market in APAC is expected to garner significant business opportunities for the vendors during the forecast period.

China, Japan, India, South Korea, Australia, Indonesia, Germany, France, UK, Italy, Spain, The Netherlands, US, Canada, Mexico, Brazil, Argentina, Chile, South Africa, Saudi Arabia, UAE, Turkey, Israel

  • Rising demand for EV specific thermal and insulation solutions is the driving factor this market.

The Automotive Silicones market vendors should focus on grabbing business opportunities from the Application segment as it accounted for the largest market share in the base year.