Automotive Tire Retreading Services Market Analysis, Size, and Forecast 2025-2029: APAC (China, India, and Japan), North America (US, Canada, and Mexico), Europe (Germany, UK, and France), South America (Brazil, Argentina, and Colombia), Middle East and Africa (Saudi Arabia, UAE, and South Africa), and Rest of World (ROW)

Automotive Tire Retreading Services Market Analysis, Size, and Forecast 2025-2029:
APAC (China, India, and Japan), North America (US, Canada, and Mexico), Europe (Germany, UK, and France), South America (Brazil, Argentina, and Colombia), Middle East and Africa (Saudi Arabia, UAE, and South Africa), and Rest of World (ROW)

Published: Dec 2025 286 Pages SKU: IRTNTR72845

Market Overview at a Glance

$602.1 Mn
Market Opportunity
3.7%
CAGR 2024 - 2029
48.5%
APAC Growth
$2.21 B
Pre cure segment 2023

Automotive Tire Retreading Services Market Size 2025-2029

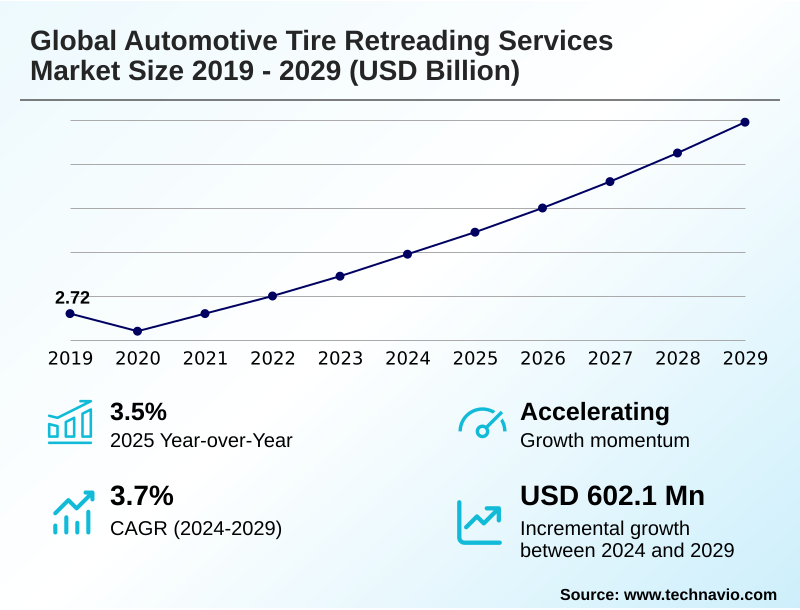
The automotive tire retreading services market size is valued to increase by USD 602.1 million, at a CAGR of 3.7% from 2024 to 2029. Technological advancements in retreading processes and tire monitoring systems will drive the automotive tire retreading services market.

Major Market Trends & Insights

  • APAC dominated the market and accounted for a 48.5% growth during the forecast period.
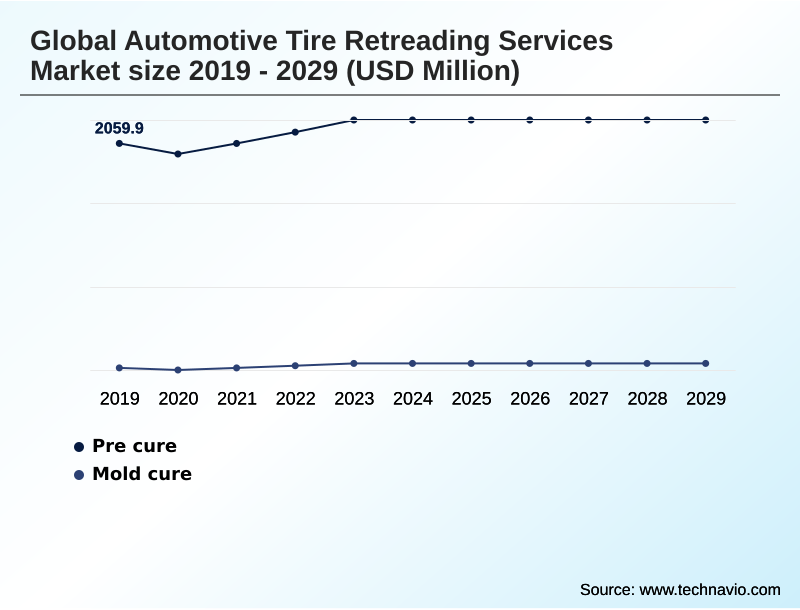
  • By Technology - Pre cure segment was valued at USD 2.21 billion in 2023
  • By Vehicle Type - Commercial vehicle segment accounted for the largest market revenue share in 2023

Market Size & Forecast

  • Market Opportunities: USD 872.4 million
  • Market Future Opportunities: USD 602.1 million
  • CAGR from 2024 to 2029 : 3.7%

Market Summary

What will be the Size of the Automotive Tire Retreading Services Market during the forecast period?

Get Key Insights on Market Forecast (PDF) Request Free Sample

How is the Automotive Tire Retreading Services Market Segmented?

The automotive tire retreading services industry research report provides comprehensive data (region-wise segment analysis), with forecasts and estimates in "USD million" for the period 2025-2029, as well as historical data from 2019-2023 for the following segments.

  • Technology
    • Pre cure
    • Mold cure
  • Vehicle type
    • Commercial vehicle
    • Passenger vehicle
  • Service
    • Aftermarket
    • OEM
  • Geography
    • APAC
      • China
      • India
      • Japan
    • North America
      • US
      • Canada
      • Mexico
    • Europe
      • Germany
      • UK
      • France
    • South America
      • Brazil
      • Argentina
      • Colombia
    • Middle East and Africa
      • Saudi Arabia
      • UAE
      • South Africa
    • Rest of World (ROW)

By Technology Insights

The pre cure segment is estimated to witness significant growth during the forecast period.

Request Free Sample

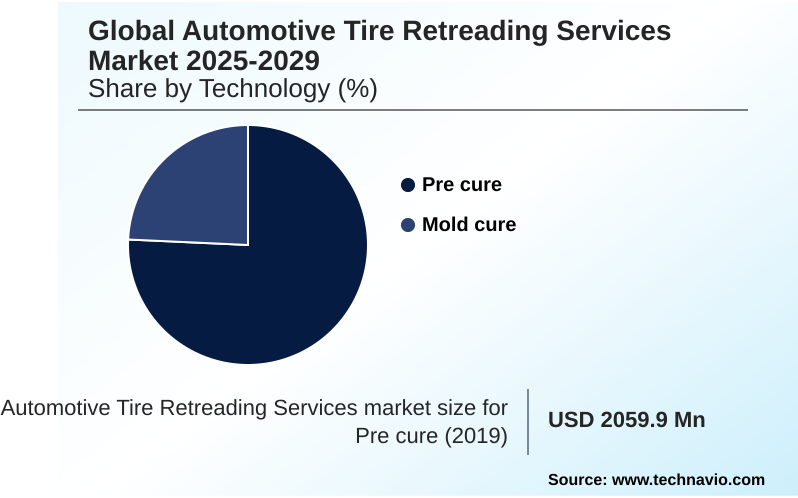
The Pre cure segment was valued at USD 2.21 billion in 2023 and showed a gradual increase during the forecast period.

Request Free Sample

Regional Analysis

APAC is estimated to contribute 48.5% to the growth of the global market during the forecast period.Technavio’s analysts have elaborately explained the regional trends and drivers that shape the market during the forecast period.

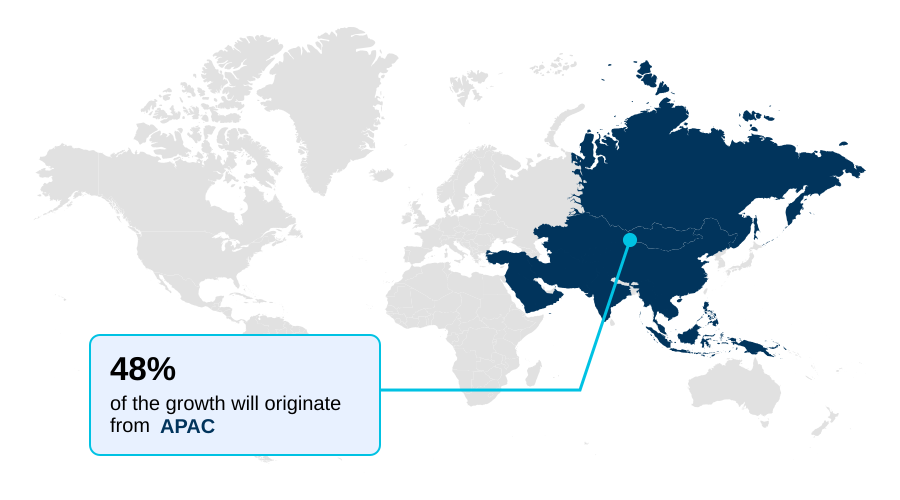
See How Automotive Tire Retreading Services Market Demand is Rising in APAC Request Free Sample

Market Dynamics

Our researchers analyzed the data with 2024 as the base year, along with the key drivers, trends, and challenges. A holistic analysis of drivers will help companies refine their marketing strategies to gain a competitive advantage.

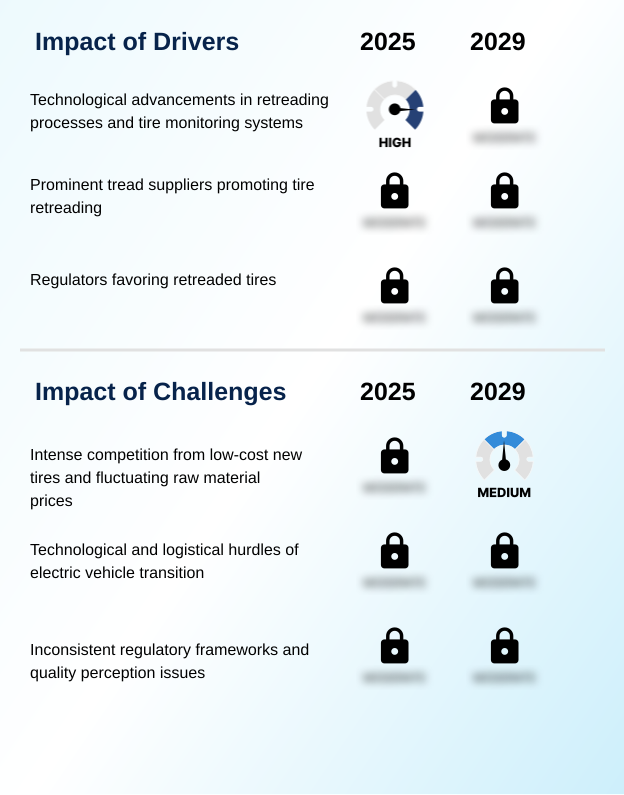
What are the key market drivers leading to the rise in the adoption of Automotive Tire Retreading Services Industry?

What are the market trends shaping the Automotive Tire Retreading Services Industry?

What challenges does the Automotive Tire Retreading Services Industry face during its growth?

Exclusive Technavio Analysis on Customer Landscape

The automotive tire retreading services market forecasting report includes the adoption lifecycle of the market, covering from the innovator’s stage to the laggard’s stage. It focuses on adoption rates in different regions based on penetration. Furthermore, the automotive tire retreading services market report also includes key purchase criteria and drivers of price sensitivity to help companies evaluate and develop their market growth analysis strategies.

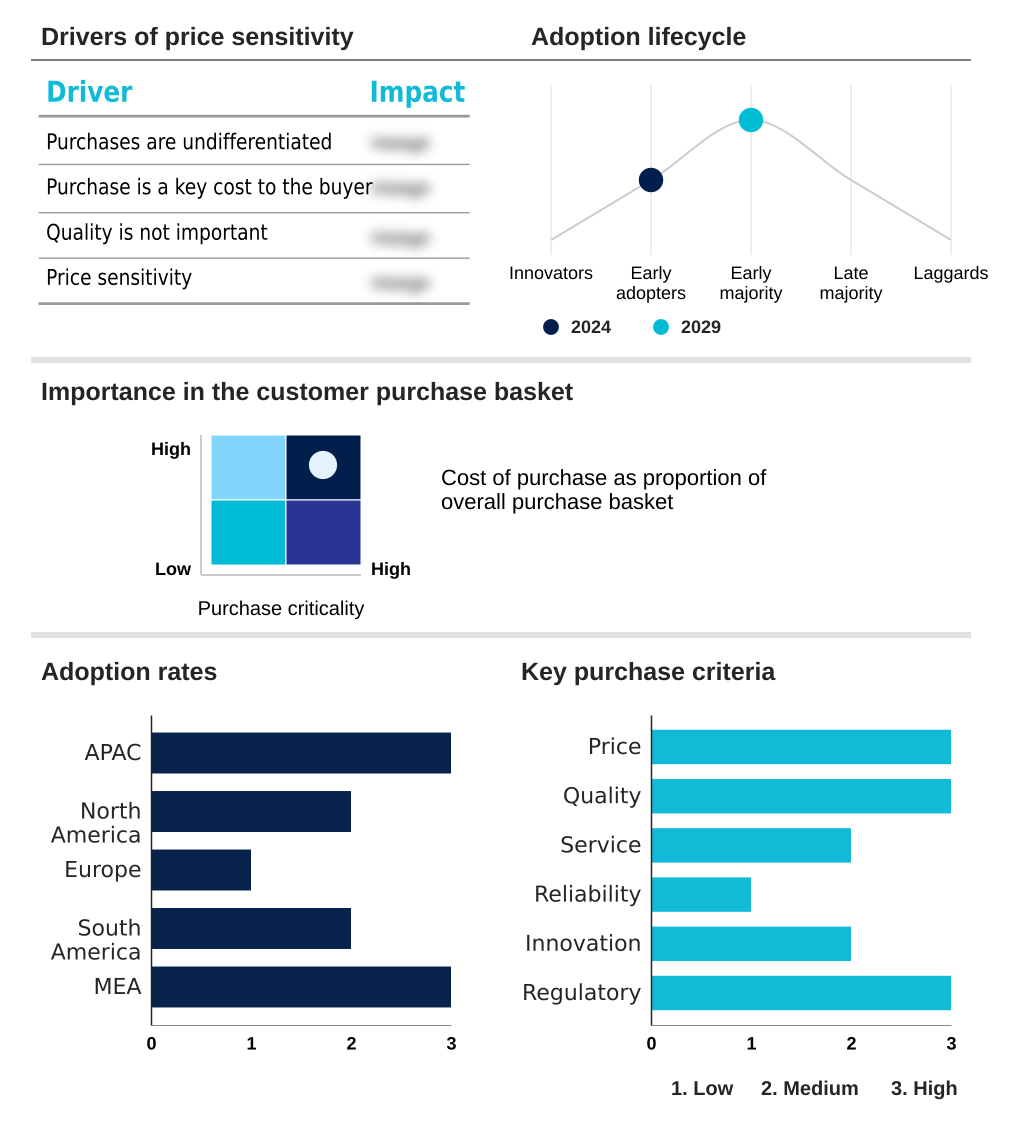
Customer Landscape of Automotive Tire Retreading Services Industry

Competitive Landscape

Companies are implementing various strategies, such as strategic alliances, automotive tire retreading services market forecast, partnerships, mergers and acquisitions, geographical expansion, and product/service launches, to enhance their presence in the industry.

Aik Koon Tyre and Battery Co. Pte Ltd. -

The industry research and growth report includes detailed analyses of the competitive landscape of the market and information about key companies, including:

  • Aik Koon Tyre and Battery Co. Pte Ltd.
  • Best One Tire and Service
  • Bridgestone Corp.
  • Continental AG
  • Eastern Treads Ltd.
  • Harsh Tyres
  • Indag Rubber Ltd.
  • JK Tyre and Industries Ltd.
  • Kal Tire
  • KRAIBURG AUSTRIA GmbH
  • MARANGONI Group.
  • McCarthy Tire
  • Midas Rubber Pvt. Ltd.
  • MRF Ltd.
  • Nokian Tyres Plc
  • Pomps Tire Service Inc
  • Purcell Tire Wholesale Center
  • Santosh Tyres Pvt. Ltd.
  • Southern Tire Mart
  • Tyresoles India Pvt. Ltd.

Qualitative and quantitative analysis of companies has been conducted to help clients understand the wider business environment as well as the strengths and weaknesses of key industry players. Data is qualitatively analyzed to categorize companies as pure play, category-focused, industry-focused, and diversified; it is quantitatively analyzed to categorize companies as dominant, leading, strong, tentative, and weak.

Recent Development and News in Automotive tire retreading services market

Dive into Technavio’s robust research methodology, blending expert interviews, extensive data synthesis, and validated models for unparalleled Automotive Tire Retreading Services Market insights. See full methodology.

Market Scope
Page number 286
Base year 2024
Historic period 2019-2023
Forecast period 2025-2029
Growth momentum & CAGR Accelerate at a CAGR of 3.7%
Market growth 2025-2029 USD 602.1 million
Market structure Fragmented
YoY growth 2024-2025(%) 3.5%
Key countries China, India, Thailand, Japan, Australia, Indonesia, US, Canada, Mexico, Germany, UK, France, Italy, The Netherlands, Spain, Brazil, Argentina, Colombia, Saudi Arabia, UAE, South Africa, Israel and Turkey
Competitive landscape Leading Companies, Market Positioning of Companies, Competitive Strategies, and Industry Risks

Request Free Sample

Research Analyst Overview

What are the Key Data Covered in this Automotive Tire Retreading Services Market Research and Growth Report?

  • What is the expected growth of the Automotive Tire Retreading Services Market between 2025 and 2029?

    • USD 602.1 million, at a CAGR of 3.7%

  • What segmentation does the market report cover?

    • The report is segmented by Technology (Pre cure, and Mold cure), Vehicle Type (Commercial vehicle, and Passenger vehicle), Service (Aftermarket, and OEM) and Geography (APAC, North America, Europe, South America, Middle East and Africa)

  • Which regions are analyzed in the report?

    • APAC, North America, Europe, South America and Middle East and Africa

  • What are the key growth drivers and market challenges?

    • Technological advancements in retreading processes and tire monitoring systems, Intense competition from low-cost new tires and fluctuating raw material prices

  • Who are the major players in the Automotive Tire Retreading Services Market?

    • Aik Koon Tyre and Battery Co. Pte Ltd., Best One Tire and Service, Bridgestone Corp., Continental AG, Eastern Treads Ltd., Harsh Tyres, Indag Rubber Ltd., JK Tyre and Industries Ltd., Kal Tire, KRAIBURG AUSTRIA GmbH, MARANGONI Group., McCarthy Tire, Midas Rubber Pvt. Ltd., MRF Ltd., Nokian Tyres Plc, Pomps Tire Service Inc, Purcell Tire Wholesale Center, Santosh Tyres Pvt. Ltd., Southern Tire Mart and Tyresoles India Pvt. Ltd.

Market Research Insights

We can help! Our analysts can customize this automotive tire retreading services market research report to meet your requirements.

Get in touch

1. Executive Summary

1.1 Market overview

Executive Summary - Chart on Market Overview
Executive Summary - Data Table on Market Overview
Executive Summary - Chart on Global Market Characteristics
Executive Summary - Chart on Market by Geography
Executive Summary - Chart on Market Segmentation by Technology
Executive Summary - Chart on Market Segmentation by Vehicle Type
Executive Summary - Chart on Market Segmentation by Service
Executive Summary - Chart on Incremental Growth
Executive Summary - Data Table on Incremental Growth
Executive Summary - Chart on Company Market Positioning

2. Technavio Analysis

2.1 Analysis of price sensitivity, lifecycle, customer purchase basket, adoption rates, and purchase criteria

2.2 Criticality of inputs and Factors of differentiation

Chart on Overview on criticality of inputs and factors of differentiation

2.3 Factors of disruption

Chart on Overview on factors of disruption

2.4 Impact of drivers and challenges

Chart on Impact of drivers and challenges in 2024 and 2029

3. Market Landscape

3.1 Market ecosystem

Chart on Parent Market
Data Table on - Parent Market

3.2 Market characteristics

Chart on Market characteristics analysis

3.3 Value chain analysis

Chart on Value chain analysis

4. Market Sizing

4.1 Market definition

Data Table on Offerings of companies included in the market definition

4.2 Market segment analysis

Market segments

4.3 Market size 2024

4.4 Market outlook: Forecast for 2024-2029

Chart on Global - Market size and forecast 2024-2029 ($ million)
Data Table on Global - Market size and forecast 2024-2029 ($ million)
Chart on Global Market: Year-over-year growth 2024-2029 (%)
Data Table on Global Market: Year-over-year growth 2024-2029 (%)

5. Historic Market Size

5.1 Global Automotive Tire Retreading Services Market 2019 - 2023

Historic Market Size - Data Table on Global Automotive Tire Retreading Services Market 2019 - 2023 ($ million)

5.2 Technology segment analysis 2019 - 2023

Historic Market Size - Technology Segment 2019 - 2023 ($ million)

5.3 Vehicle Type segment analysis 2019 - 2023

Historic Market Size - Vehicle Type Segment 2019 - 2023 ($ million)

5.4 Service segment analysis 2019 - 2023

Historic Market Size - Service Segment 2019 - 2023 ($ million)

5.5 Geography segment analysis 2019 - 2023

Historic Market Size - Geography Segment 2019 - 2023 ($ million)

5.6 Country segment analysis 2019 - 2023

Historic Market Size - Country Segment 2019 - 2023 ($ million)

6. Qualitative Analysis

6.1 The AI impact on Global Automotive Tire Retreading Services Market

7. Five Forces Analysis

7.1 Five forces summary

Five forces analysis - Comparison between 2024 and 2029

7.2 Bargaining power of buyers

Bargaining power of buyers - Impact of key factors 2024 and 2029

7.3 Bargaining power of suppliers

Bargaining power of suppliers - Impact of key factors in 2024 and 2029

7.4 Threat of new entrants

Threat of new entrants - Impact of key factors in 2024 and 2029

7.5 Threat of substitutes

Threat of substitutes - Impact of key factors in 2024 and 2029

7.6 Threat of rivalry

Threat of rivalry - Impact of key factors in 2024 and 2029

7.7 Market condition

Chart on Market condition - Five forces 2024 and 2029

8. Market Segmentation by Technology

8.1 Market segments

Chart on Technology - Market share 2024-2029 (%)
Data Table on Technology - Market share 2024-2029 (%)

8.2 Comparison by Technology

Chart on Comparison by Technology
Data Table on Comparison by Technology

8.3 Pre cure - Market size and forecast 2024-2029

Chart on Pre cure - Market size and forecast 2024-2029 ($ million)
Data Table on Pre cure - Market size and forecast 2024-2029 ($ million)
Chart on Pre cure - Year-over-year growth 2024-2029 (%)
Data Table on Pre cure - Year-over-year growth 2024-2029 (%)

8.4 Mold cure - Market size and forecast 2024-2029

Chart on Mold cure - Market size and forecast 2024-2029 ($ million)
Data Table on Mold cure - Market size and forecast 2024-2029 ($ million)
Chart on Mold cure - Year-over-year growth 2024-2029 (%)
Data Table on Mold cure - Year-over-year growth 2024-2029 (%)

8.5 Market opportunity by Technology

Market opportunity by Technology ($ million)
Data Table on Market opportunity by Technology ($ million)

9. Market Segmentation by Vehicle Type

9.1 Market segments

Chart on Vehicle Type - Market share 2024-2029 (%)
Data Table on Vehicle Type - Market share 2024-2029 (%)

9.2 Comparison by Vehicle Type

Chart on Comparison by Vehicle Type
Data Table on Comparison by Vehicle Type

9.3 Commercial vehicle - Market size and forecast 2024-2029

Chart on Commercial vehicle - Market size and forecast 2024-2029 ($ million)
Data Table on Commercial vehicle - Market size and forecast 2024-2029 ($ million)
Chart on Commercial vehicle - Year-over-year growth 2024-2029 (%)
Data Table on Commercial vehicle - Year-over-year growth 2024-2029 (%)

9.4 Passenger vehicle - Market size and forecast 2024-2029

Chart on Passenger vehicle - Market size and forecast 2024-2029 ($ million)
Data Table on Passenger vehicle - Market size and forecast 2024-2029 ($ million)
Chart on Passenger vehicle - Year-over-year growth 2024-2029 (%)
Data Table on Passenger vehicle - Year-over-year growth 2024-2029 (%)

9.5 Market opportunity by Vehicle Type

Market opportunity by Vehicle Type ($ million)
Data Table on Market opportunity by Vehicle Type ($ million)

10. Market Segmentation by Service

10.1 Market segments

Chart on Service - Market share 2024-2029 (%)
Data Table on Service - Market share 2024-2029 (%)

10.2 Comparison by Service

Chart on Comparison by Service
Data Table on Comparison by Service

10.3 Aftermarket - Market size and forecast 2024-2029

Chart on Aftermarket - Market size and forecast 2024-2029 ($ million)
Data Table on Aftermarket - Market size and forecast 2024-2029 ($ million)
Chart on Aftermarket - Year-over-year growth 2024-2029 (%)
Data Table on Aftermarket - Year-over-year growth 2024-2029 (%)

10.4 OEM - Market size and forecast 2024-2029

Chart on OEM - Market size and forecast 2024-2029 ($ million)
Data Table on OEM - Market size and forecast 2024-2029 ($ million)
Chart on OEM - Year-over-year growth 2024-2029 (%)
Data Table on OEM - Year-over-year growth 2024-2029 (%)

10.5 Market opportunity by Service

Market opportunity by Service ($ million)
Data Table on Market opportunity by Service ($ million)

11. Customer Landscape

11.1 Customer landscape overview

Analysis of price sensitivity, lifecycle, customer purchase basket, adoption rates, and purchase criteria

12. Geographic Landscape

12.1 Geographic segmentation

Chart on Market share by geography 2024-2029 (%)
Data Table on Market share by geography 2024-2029 (%)

12.2 Geographic comparison

Chart on Geographic comparison
Data Table on Geographic comparison

12.3 APAC - Market size and forecast 2024-2029

Chart on APAC - Market size and forecast 2024-2029 ($ million)
Data Table on APAC - Market size and forecast 2024-2029 ($ million)
Chart on APAC - Year-over-year growth 2024-2029 (%)
Data Table on APAC - Year-over-year growth 2024-2029 (%)
Chart on Regional Comparison - APAC
Data Table on Regional Comparison - APAC

12.3.1 China - Market size and forecast 2024-2029

Chart on China - Market size and forecast 2024-2029 ($ million)
Data Table on China - Market size and forecast 2024-2029 ($ million)
Chart on China - Year-over-year growth 2024-2029 (%)
Data Table on China - Year-over-year growth 2024-2029 (%)

12.3.2 India - Market size and forecast 2024-2029

Chart on India - Market size and forecast 2024-2029 ($ million)
Data Table on India - Market size and forecast 2024-2029 ($ million)
Chart on India - Year-over-year growth 2024-2029 (%)
Data Table on India - Year-over-year growth 2024-2029 (%)

12.3.3 Thailand - Market size and forecast 2024-2029

Chart on Thailand - Market size and forecast 2024-2029 ($ million)
Data Table on Thailand - Market size and forecast 2024-2029 ($ million)
Chart on Thailand - Year-over-year growth 2024-2029 (%)
Data Table on Thailand - Year-over-year growth 2024-2029 (%)

12.3.4 Japan - Market size and forecast 2024-2029

Chart on Japan - Market size and forecast 2024-2029 ($ million)
Data Table on Japan - Market size and forecast 2024-2029 ($ million)
Chart on Japan - Year-over-year growth 2024-2029 (%)
Data Table on Japan - Year-over-year growth 2024-2029 (%)

12.3.5 Australia - Market size and forecast 2024-2029

Chart on Australia - Market size and forecast 2024-2029 ($ million)
Data Table on Australia - Market size and forecast 2024-2029 ($ million)
Chart on Australia - Year-over-year growth 2024-2029 (%)
Data Table on Australia - Year-over-year growth 2024-2029 (%)

12.3.6 Indonesia - Market size and forecast 2024-2029

Chart on Indonesia - Market size and forecast 2024-2029 ($ million)
Data Table on Indonesia - Market size and forecast 2024-2029 ($ million)
Chart on Indonesia - Year-over-year growth 2024-2029 (%)
Data Table on Indonesia - Year-over-year growth 2024-2029 (%)

12.4 North America - Market size and forecast 2024-2029

Chart on North America - Market size and forecast 2024-2029 ($ million)
Data Table on North America - Market size and forecast 2024-2029 ($ million)
Chart on North America - Year-over-year growth 2024-2029 (%)
Data Table on North America - Year-over-year growth 2024-2029 (%)
Chart on Regional Comparison - North America
Data Table on Regional Comparison - North America

12.4.1 US - Market size and forecast 2024-2029

Chart on US - Market size and forecast 2024-2029 ($ million)
Data Table on US - Market size and forecast 2024-2029 ($ million)
Chart on US - Year-over-year growth 2024-2029 (%)
Data Table on US - Year-over-year growth 2024-2029 (%)

12.4.2 Canada - Market size and forecast 2024-2029

Chart on Canada - Market size and forecast 2024-2029 ($ million)
Data Table on Canada - Market size and forecast 2024-2029 ($ million)
Chart on Canada - Year-over-year growth 2024-2029 (%)
Data Table on Canada - Year-over-year growth 2024-2029 (%)

12.4.3 Mexico - Market size and forecast 2024-2029

Chart on Mexico - Market size and forecast 2024-2029 ($ million)
Data Table on Mexico - Market size and forecast 2024-2029 ($ million)
Chart on Mexico - Year-over-year growth 2024-2029 (%)
Data Table on Mexico - Year-over-year growth 2024-2029 (%)

12.5 Europe - Market size and forecast 2024-2029

Chart on Europe - Market size and forecast 2024-2029 ($ million)
Data Table on Europe - Market size and forecast 2024-2029 ($ million)
Chart on Europe - Year-over-year growth 2024-2029 (%)
Data Table on Europe - Year-over-year growth 2024-2029 (%)
Chart on Regional Comparison - Europe
Data Table on Regional Comparison - Europe

12.5.1 Germany - Market size and forecast 2024-2029

Chart on Germany - Market size and forecast 2024-2029 ($ million)
Data Table on Germany - Market size and forecast 2024-2029 ($ million)
Chart on Germany - Year-over-year growth 2024-2029 (%)
Data Table on Germany - Year-over-year growth 2024-2029 (%)

12.5.2 UK - Market size and forecast 2024-2029

Chart on UK - Market size and forecast 2024-2029 ($ million)
Data Table on UK - Market size and forecast 2024-2029 ($ million)
Chart on UK - Year-over-year growth 2024-2029 (%)
Data Table on UK - Year-over-year growth 2024-2029 (%)

12.5.3 France - Market size and forecast 2024-2029

Chart on France - Market size and forecast 2024-2029 ($ million)
Data Table on France - Market size and forecast 2024-2029 ($ million)
Chart on France - Year-over-year growth 2024-2029 (%)
Data Table on France - Year-over-year growth 2024-2029 (%)

12.5.4 Italy - Market size and forecast 2024-2029

Chart on Italy - Market size and forecast 2024-2029 ($ million)
Data Table on Italy - Market size and forecast 2024-2029 ($ million)
Chart on Italy - Year-over-year growth 2024-2029 (%)
Data Table on Italy - Year-over-year growth 2024-2029 (%)

12.5.5 The Netherlands - Market size and forecast 2024-2029

Chart on The Netherlands - Market size and forecast 2024-2029 ($ million)
Data Table on The Netherlands - Market size and forecast 2024-2029 ($ million)
Chart on The Netherlands - Year-over-year growth 2024-2029 (%)
Data Table on The Netherlands - Year-over-year growth 2024-2029 (%)

12.5.6 Spain - Market size and forecast 2024-2029

Chart on Spain - Market size and forecast 2024-2029 ($ million)
Data Table on Spain - Market size and forecast 2024-2029 ($ million)
Chart on Spain - Year-over-year growth 2024-2029 (%)
Data Table on Spain - Year-over-year growth 2024-2029 (%)

12.6 South America - Market size and forecast 2024-2029

Chart on South America - Market size and forecast 2024-2029 ($ million)
Data Table on South America - Market size and forecast 2024-2029 ($ million)
Chart on South America - Year-over-year growth 2024-2029 (%)
Data Table on South America - Year-over-year growth 2024-2029 (%)
Chart on Regional Comparison - South America
Data Table on Regional Comparison - South America

12.6.1 Brazil - Market size and forecast 2024-2029

Chart on Brazil - Market size and forecast 2024-2029 ($ million)
Data Table on Brazil - Market size and forecast 2024-2029 ($ million)
Chart on Brazil - Year-over-year growth 2024-2029 (%)
Data Table on Brazil - Year-over-year growth 2024-2029 (%)

12.6.2 Argentina - Market size and forecast 2024-2029

Chart on Argentina - Market size and forecast 2024-2029 ($ million)
Data Table on Argentina - Market size and forecast 2024-2029 ($ million)
Chart on Argentina - Year-over-year growth 2024-2029 (%)
Data Table on Argentina - Year-over-year growth 2024-2029 (%)

12.6.3 Colombia - Market size and forecast 2024-2029

Chart on Colombia - Market size and forecast 2024-2029 ($ million)
Data Table on Colombia - Market size and forecast 2024-2029 ($ million)
Chart on Colombia - Year-over-year growth 2024-2029 (%)
Data Table on Colombia - Year-over-year growth 2024-2029 (%)

12.7 Middle East and Africa - Market size and forecast 2024-2029

Chart on Middle East and Africa - Market size and forecast 2024-2029 ($ million)
Data Table on Middle East and Africa - Market size and forecast 2024-2029 ($ million)
Chart on Middle East and Africa - Year-over-year growth 2024-2029 (%)
Data Table on Middle East and Africa - Year-over-year growth 2024-2029 (%)
Chart on Regional Comparison - Middle East and Africa
Data Table on Regional Comparison - Middle East and Africa

12.7.1 Saudi Arabia - Market size and forecast 2024-2029

Chart on Saudi Arabia - Market size and forecast 2024-2029 ($ million)
Data Table on Saudi Arabia - Market size and forecast 2024-2029 ($ million)
Chart on Saudi Arabia - Year-over-year growth 2024-2029 (%)
Data Table on Saudi Arabia - Year-over-year growth 2024-2029 (%)

12.7.2 UAE - Market size and forecast 2024-2029

Chart on UAE - Market size and forecast 2024-2029 ($ million)
Data Table on UAE - Market size and forecast 2024-2029 ($ million)
Chart on UAE - Year-over-year growth 2024-2029 (%)
Data Table on UAE - Year-over-year growth 2024-2029 (%)

12.7.3 South Africa - Market size and forecast 2024-2029

Chart on South Africa - Market size and forecast 2024-2029 ($ million)
Data Table on South Africa - Market size and forecast 2024-2029 ($ million)
Chart on South Africa - Year-over-year growth 2024-2029 (%)
Data Table on South Africa - Year-over-year growth 2024-2029 (%)

12.7.4 Israel - Market size and forecast 2024-2029

Chart on Israel - Market size and forecast 2024-2029 ($ million)
Data Table on Israel - Market size and forecast 2024-2029 ($ million)
Chart on Israel - Year-over-year growth 2024-2029 (%)
Data Table on Israel - Year-over-year growth 2024-2029 (%)

12.7.5 Turkey - Market size and forecast 2024-2029

Chart on Turkey - Market size and forecast 2024-2029 ($ million)
Data Table on Turkey - Market size and forecast 2024-2029 ($ million)
Chart on Turkey - Year-over-year growth 2024-2029 (%)
Data Table on Turkey - Year-over-year growth 2024-2029 (%)

12.8 Market opportunity by geography

Market opportunity by geography ($ million)
Data Tables on Market opportunity by geography ($ million)

13. Drivers, Challenges, and Opportunity

13.1 Market drivers

Technological advancements in retreading processes and tire monitoring systems
Prominent tread suppliers promoting tire retreading
Regulators favoring retreaded tires

13.2 Market challenges

Intense competition from low-cost new tires and fluctuating raw material prices
Technological and logistical hurdles of electric vehicle transition
Inconsistent regulatory frameworks and quality perception issues

13.3 Impact of drivers and challenges

Impact of drivers and challenges in 2024 and 2029

13.4 Market opportunities

Circular economy principles and sustainability mandates
Technological advancements
Heightened focus on total cost of ownership

14. Competitive Landscape

14.1 Overview

14.2

Overview on criticality of inputs and factors of differentiation

14.3 Landscape disruption

Overview on factors of disruption

14.4 Industry risks

Impact of key risks on business

15. Competitive Analysis

15.1 Companies profiled

Companies covered

15.2 Company ranking index

15.3 Market positioning of companies

Matrix on companies position and classification

15.4 Aik Koon Tyre and Battery Co. Pte Ltd.

Aik Koon Tyre and Battery Co. Pte Ltd. - Overview
Aik Koon Tyre and Battery Co. Pte Ltd. - Product / Service
Aik Koon Tyre and Battery Co. Pte Ltd. - Key offerings
SWOT

15.5 Best One Tire and Service

Best One Tire and Service - Overview
Best One Tire and Service - Product / Service
Best One Tire and Service - Key offerings
SWOT

15.6 Bridgestone Corp.

Bridgestone Corp. - Overview
Bridgestone Corp. - Business segments
Bridgestone Corp. - Key news
Bridgestone Corp. - Key offerings
Bridgestone Corp. - Segment focus
SWOT

15.7 Continental AG

Continental AG - Overview
Continental AG - Business segments
Continental AG - Key news
Continental AG - Key offerings
Continental AG - Segment focus
SWOT

15.8 Eastern Treads Ltd.

Eastern Treads Ltd. - Overview
Eastern Treads Ltd. - Product / Service
Eastern Treads Ltd. - Key offerings
SWOT

15.9 Harsh Tyres

Harsh Tyres - Overview
Harsh Tyres - Product / Service
Harsh Tyres - Key offerings
SWOT

15.10 Indag Rubber Ltd.

Indag Rubber Ltd. - Overview
Indag Rubber Ltd. - Product / Service
Indag Rubber Ltd. - Key offerings
SWOT

15.11 JK Tyre and Industries Ltd.

JK Tyre and Industries Ltd. - Overview
JK Tyre and Industries Ltd. - Business segments
JK Tyre and Industries Ltd. - Key offerings
JK Tyre and Industries Ltd. - Segment focus
SWOT

15.12 Kal Tire

Kal Tire - Overview
Kal Tire - Product / Service
Kal Tire - Key offerings
SWOT

15.13 KRAIBURG AUSTRIA GmbH

KRAIBURG AUSTRIA GmbH - Overview
KRAIBURG AUSTRIA GmbH - Product / Service
KRAIBURG AUSTRIA GmbH - Key offerings
SWOT

15.14 MARANGONI Group.

MARANGONI Group. - Overview
MARANGONI Group. - Product / Service
MARANGONI Group. - Key offerings
SWOT

15.15 McCarthy Tire

McCarthy Tire - Overview
McCarthy Tire - Product / Service
McCarthy Tire - Key offerings
SWOT

15.16 Midas Rubber Pvt. Ltd.

Midas Rubber Pvt. Ltd. - Overview
Midas Rubber Pvt. Ltd. - Product / Service
Midas Rubber Pvt. Ltd. - Key offerings
SWOT

15.17 MRF Ltd.

MRF Ltd. - Overview
MRF Ltd. - Product / Service
MRF Ltd. - Key offerings
SWOT

15.18 Nokian Tyres Plc

Nokian Tyres Plc - Overview
Nokian Tyres Plc - Business segments
Nokian Tyres Plc - Key offerings
Nokian Tyres Plc - Segment focus
SWOT

16. Appendix

16.1 Scope of the report

Market definition
Objectives
Notes and caveats

16.2 Inclusions and exclusions checklist

Inclusions checklist
Exclusions checklist

16.3 Currency conversion rates for US$

16.4 Research methodology

16.5 Data procurement

Information sources

16.6 Data validation

16.7 Validation techniques employed for market sizing

16.8 Data synthesis

16.9 360 degree market analysis

16.10 List of abbreviations

Research Methodology

Technavio presents a detailed picture of the market by way of study, synthesis, and summation of data from multiple sources. The analysts have presented the various facets of the market with a particular focus on identifying the key industry influencers. The data thus presented is comprehensive, reliable, and the result of extensive research, both primary and secondary.

INFORMATION SOURCES

Primary sources

  • Manufacturers and suppliers
  • Channel partners
  • Industry experts
  • Strategic decision makers

Secondary sources

  • Industry journals and periodicals
  • Government data
  • Financial reports of key industry players
  • Historical data
  • Press releases

DATA ANALYSIS

Data Synthesis

  • Collation of data
  • Estimation of key figures
  • Analysis of derived insights

Data Validation

  • Triangulation with data models
  • Reference against proprietary databases
  • Corroboration with industry experts

REPORT WRITING

Qualitative

  • Market drivers
  • Market challenges
  • Market trends
  • Five forces analysis

Quantitative

  • Market size and forecast
  • Market segmentation
  • Geographical insights
  • Competitive landscape

Interested in this report?

Get your sample now to see our research methodology and insights!

Download Now

Frequently Asked Questions

Automotive Tire Retreading Services market growth will increase by USD 602.1 million during 2025-2029.

The Automotive Tire Retreading Services market is expected to grow at a CAGR of 3.7% during 2025-2029.

Automotive Tire Retreading Services market is segmented by Technology (Pre cure, Mold cure) Vehicle type (Commercial vehicle, Passenger vehicle) Service (Aftermarket, OEM)

Aik Koon Tyre and Battery Co. Pte Ltd., Best One Tire and Service, Bridgestone Corp., Continental AG, Eastern Treads Ltd., Harsh Tyres, Indag Rubber Ltd., JK Tyre and Industries Ltd., Kal Tire, KRAIBURG AUSTRIA GmbH, MARANGONI Group., McCarthy Tire, Midas Rubber Pvt. Ltd., MRF Ltd., Nokian Tyres Plc, Pomps Tire Service Inc, Purcell Tire Wholesale Center, Santosh Tyres Pvt. Ltd., Southern Tire Mart, Tyresoles India Pvt. Ltd. are a few of the key vendors in the Automotive Tire Retreading Services market.

APAC will register the highest growth rate of 48.5% among the other regions. Therefore, the Automotive Tire Retreading Services market in APAC is expected to garner significant business opportunities for the vendors during the forecast period.

China, India, Thailand, Japan, Australia, Indonesia, US, Canada, Mexico, Germany, UK, France, Italy, The Netherlands, Spain, Brazil, Argentina, Colombia, Saudi Arabia, UAE, South Africa, Israel, Turkey

  • Technological advancements in retreading processes and tire monitoring systems is the driving factor this market.

The Automotive Tire Retreading Services market vendors should focus on grabbing business opportunities from the Technology segment as it accounted for the largest market share in the base year.