Automotive Vacuumless Braking Market Analysis APAC, Europe, North America, South America, Middle East and Africa - US, China, Japan, South Korea, Germany - Size and Forecast 2024-2028

Automotive Vacuumless Braking Market Analysis APAC, Europe, North America, South America, Middle East and Africa - US, China, Japan, South Korea, Germany - Size and Forecast 2024-2028

Published: Jan 2024 173 Pages SKU: IRTNTR72952

Market Overview at a Glance

$3.08 B
Market Opportunity
7.73%
CAGR
7.35
YoY growth 2023-2024(%)

Automotive Vacuumless Braking Market 2024-2028 

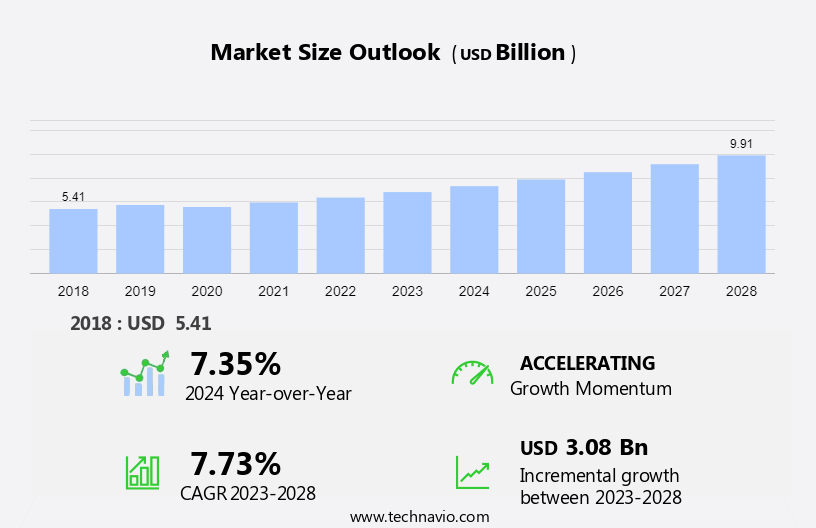
The Automotive Vacuumless Braking Market size is forecast to increase by USD 3.08 billion, at a CAGR of 7.73% between 2023 and 2028. The market growth analysis depends on several factors, including the increase in demand for environmentally sustainable solutions, the rising demand for heavy-duty vehicles in India and Eastern Europe, and the growing need for mandatory safety solutions for heavy-duty vehicles. 

The market research and growth include a comprehensive outlook on the market, offering forecasts for the industry segmented by Application, which comprises passenger vehicle, and commercial vehicle. Additionally, it categorizes End-user into OEM, and aftermarket, and covers Regions, including APAC, Europe, North America, South America, and Middle East and Africa. The market analysis and report provides market size, historical data spanning from 2018 to 2022, and future projections, all presented in terms of value in USD billion for each of the mentioned segments.

What will be the Size of the Market During the Forecast Period?

Automotive Vacuumless Braking Market Size

For More Highlights About this Report, Download Free Sample in a Minute 

Market Key Drivers, Trends, and Challenges

Our researchers analyzed the data with 2023 as the base year, along with the key drivers, trends, and challenges. A holistic analysis of drivers will help companies refine their marketing strategies to gain a competitive advantage.

Key Market Driver

Increase in demand for environmentally sustainable solutions is the key factor driving market growth. As the automotive industry grapples with the imperative to reduce its environmental footprint, vacuumless braking systems emerge as a transformative solution. By eliminating traditional vacuum boosters and optimizing braking efficiency, these systems contribute significantly to energy conservation and reduce carbon emissions. The lightweight design of vacuumless braking components not only enhances vehicle fuel efficiency but also aligns with the industry's commitment to lightweight strategies, further curbing greenhouse gas emissions.

Additionally, regulatory pressure for stringent emissions standards globally reinforces the demand for eco-friendly braking technologies, positioning vacuumless braking systems as a key enabler for manufacturers to achieve compliance while bolstering their environmental stewardship credentials. As consumer preferences increasingly pivot toward sustainable automotive solutions, the adoption of vacuumless braking systems not only addresses regulatory imperatives but also aligns with the industry's broader mission of achieving a more environmentally conscious and sustainable transportation ecosystem and, hence, will drive market growth during the forecast period.

Key Market Trends

Integration of vacuumless braking systems with ADAS is the primary trend shaping market growth. Aligning with market trends and analysis, the integration of vacuumless braking systems with advanced driver assistance systems (ADAS) drives market growth. ADAS technologies aim to enhance vehicle safety, providing assistance to drivers and, in some cases, even intervening to prevent or mitigate collisions. Vacuumless braking systems, with their advanced features and improved responsiveness, seamlessly align with and complement the objectives of ADAS, contributing to a safer driving experience.

Moreover, vacuumless braking systems play a pivotal role in these applications by providing a sophisticated braking solution that meets the stringent requirements of modern safety technologies. As the automotive industry continues to progress toward autonomous driving, the integration of vacuumless braking systems with ADAS is expected to play a pivotal role in shaping the future of advanced automotive safety technologies, which will drive market growth during the forecast period.

Major Market Challenge

High implementation costs for integrating advanced braking systems are a challenge that affects market growth. Costs and affordability pose significant challenges to the widespread adoption of vacuumless braking systems in the global automotive market. The initial implementation costs for integrating these advanced braking systems can be relatively high, impacting the production expenses of automakers. These cost challenges may hinder vacuumless braking system adoption, particularly in mass-market and budget-friendly vehicles, where cost-effectiveness is a critical factor.

In addition, one recent example highlighting the cost challenge is the limited integration of vacuumless braking systems in entry-level electric vehicles (EVs). Furthermore, the transition to vacuumless braking systems involves retrofitting existing manufacturing processes and equipment, adding to the overall cost. Manufacturers must strike a balance between incorporating innovative technologies and maintaining competitive pricing to appeal to a broad consumer base. Thus, such factors may impede market growth during the forecast period.

Market Customer Landscape

The market research report includes the adoption lifecycle of the market, covering from the innovator’s stage to the laggard’s stage. It focuses on adoption rates in different regions based on penetration. Furthermore, the report also includes key purchase criteria and drivers of price sensitivity to help companies evaluate and develop their growth strategies.
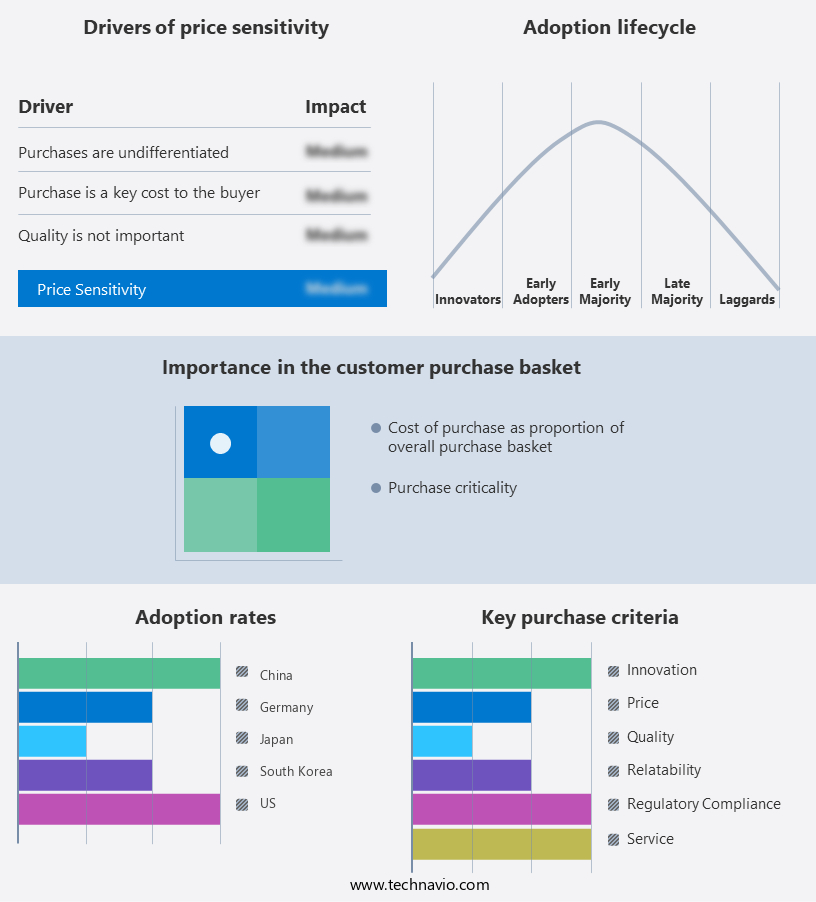
Automotive Vacuumless Braking Market Share by Geography

 Customer Landscape

Who are the Major Market Companies?

Companies are implementing various strategies, such as strategic alliances, partnerships, mergers and acquisitions, geographical expansion, and product/service launches, to enhance their presence in the market.

  • Aptiv Plc: The company offers automotive vacuumless braking that controls and enhances the safety, comfort, and convenience of the vehicle with comfort and convenience functionality through deep power, data, and integration capabilities.

The research report also includes detailed analyses of the competitive landscape of the market and information about 16 market companies, including:

  • BorgWarner Inc.
  • Brembo Spa
  • Continental AG
  • Cummins Inc.
  • GUD Holdings Ltd.
  • Haldex AB
  • Hitachi Ltd.
  • Knorr Bremse AG
  • LSP Innovative Automotive Systems GmbH
  • Nabtesco Corp.
  • Performance Friction Corp.
  • Robert Bosch GmbH
  • TSE Brakes Inc.
  • Westinghouse Air Brake Technologies Corp.
  • ZF Off Highway Solutions Minnesota Inc.

Qualitative and quantitative analysis of companies has been conducted to help clients understand the wider business environment as well as the strengths and weaknesses of key market players. Data is qualitatively analyzed to categorize companies as pure play, category-focused, industry-focused, and diversified; it is quantitatively analyzed to categorize companies as dominant, leading, strong, tentative, and weak.

What is the Largest-Growing Segments in the Market?

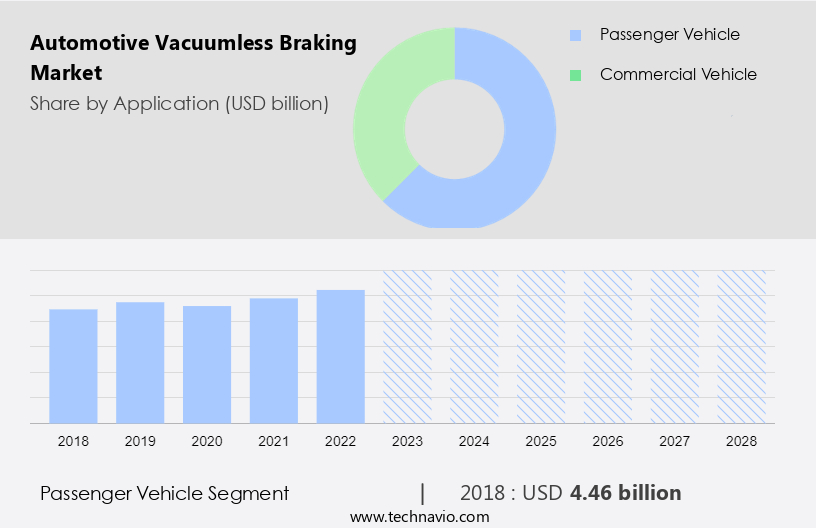
The passenger vehicle segment is estimated to witness significant growth during the forecast period. Automakers are concentrating on advancing braking technology for passenger cars to meet the rising demand for ride-hailing and personal use. Developed regions like North America and Europe lead in autonomous car development, with luxury car manufacturers playing a pivotal role.

Automotive Vacuumless Braking Market Size

Get a glance at the market contribution of various segments Download the PDF Sample

The passenger vehicle segment was the largest segment and was valued at USD 4.46 billion in 2018 The growing preference for luxury cars, driven by innovation and early adoption, is propelling the global automotive vacuumless braking market. Electrification of cars and increased disposable income allow customers to pay a premium for technologically advanced vehicles, contributing to the market's positive outlook. The rise of level 2 and level 3 autonomous vehicles further fuels market growth, driven by increasing safety demands and government support for autonomous vehicle development. Thus, such factors are expected to drive the passenger vehicle segment of the market during the forecast period.

Which are the Key Regions for the Market?

Automotive Vacuumless Braking Market Share by Geography

For more insights on the market share of various regions Download PDF Sample now!

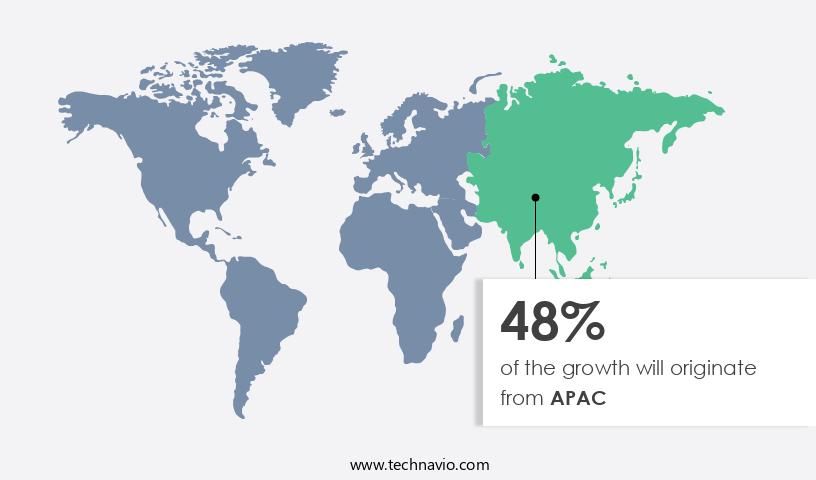
APAC is estimated to contribute 48% to the growth of the global market during the forecast period. Technavio’s analysts have elaborately explained the regional trends and drivers that shape the market during the forecast period. The APAC region is at the forefront of global automotive innovation, particularly with the adoption of advanced technologies like vacuumless braking systems. Leading economies such as China, India, and Japan are driving this transformation as they actively embrace cutting-edge developments to enhance automotive safety standards. With China and India emerging as significant players in the global automotive market, the region's rapid economic growth increased per capita income, and growing demand for vehicles contribute to the adoption of vacuumless braking, especially in passenger cars. This economic surge also fuels infrastructure development, leading to a heightened demand for commercial vehicles in the region.

Segment Overview

The market report forecasts market growth and forecasting by revenue at global, regional & country levels and provides an analysis of the latest market growth and trends opportunities from 2018 to 2028. 

  • Application Outlook
    • Passenger vehicle
    • Commercial vehicle
  • End-user Outlook 
    • OEM
    • Aftermarket
  • Region Outlook 
    • North America
      • The U.S.
      • Canada
    • Europe
      • The U.K.
      • Germany
      • France
      • Rest of Europe
    • APAC
      • China
      • India
    • South America
      • Chile
      • Brazil
      • Argentina
    • Middle East & Africa
      • Saudi Arabia
      • South Africa
      • Rest of the Middle East & Africa

Automotive Vacuumless Braking Market Scope

Report Coverage

Details

Page number

173

Base year

2023

Historic period

2018-2022

Forecast period

2024-2028

Growth momentum & CAGR

Accelerate at a CAGR of 7.73%

Market Growth 2024-2028

USD 3.08 billion

Market structure

Fragmented

YoY growth 2023-2024(%)

7.35

Regional analysis

APAC, Europe, North America, South America, and Middle East and Africa

Performing market contribution

APAC at 48%

Key countries

US, China, Japan, South Korea, and Germany

Competitive landscape

Leading Companies, Market Positioning of Companies, Competitive Strategies, and Industry Risks

Key companies profiled

Aptiv Plc, BorgWarner Inc., Brembo Spa, Continental AG, Cummins Inc., GUD Holdings Ltd., Haldex AB, Hitachi Ltd., Knorr Bremse AG, LSP Innovative Automotive Systems GmbH, Nabtesco Corp., Performance Friction Corp., Robert Bosch GmbH, TSE Brakes Inc., Westinghouse Air Brake Technologies Corp., and ZF Off Highway Solutions Minnesota Inc.

Market dynamics

Parent market analysis, Market growth inducers and obstacles, Fast-growing and slow-growing segment analysis, COVID-19 impact and recovery analysis and future consumer dynamics, and market condition analysis for the forecast period. 

Customization purview

If our report has not included the data that you are looking for, you can reach out to our analysts and get segments customized.

Download PDF Sample

What are the Key Data Covered in this Automotive Vacuumless Braking Market Research Report?

  • CAGR of the market during the forecast period
  • Detailed information on factors that will drive the growth of the market forecast between 2024 and 2028
  • Precise estimation of the market size and its contribution to the market in focus on the parent market
  • Accurate predictions about upcoming trends and changes in consumer behavior
  • Growth of the market industry across APAC, Europe, North America, South America, and Middle East and Africa
  • A thorough analysis of the market’s competitive landscape and detailed information about companies
  • Comprehensive analysis of factors that will challenge the growth of market companies

We can help! Our analysts can customize this market research report to meet your requirements. 

Get in touch

1 Executive Summary

  • 1.1 Market overview
    • Exhibit 01: Executive Summary – Chart on Market Overview
    • Exhibit 02: Executive Summary – Data Table on Market Overview
    • Exhibit 03: Executive Summary – Chart on Global Market Characteristics
    • Exhibit 04: Executive Summary – Chart on Market by Geography
    • Exhibit 05: Executive Summary – Chart on Market Segmentation by Application
    • Exhibit 06: Executive Summary – Chart on Market Segmentation by End-user
    • Exhibit 07: Executive Summary – Chart on Incremental Growth
    • Exhibit 08: Executive Summary – Data Table on Incremental Growth
    • Exhibit 09: Executive Summary – Chart on Vendor Market Positioning

2 Market Landscape

  • 2.1 Market ecosystem
    • Exhibit 10: Parent market
    • Exhibit 11: Market Characteristics

3 Market Sizing

  • 3.1 Market definition
    • Exhibit 12: Offerings of vendors included in the market definition
  • 3.2 Market segment analysis
    • Exhibit 13: Market segments
  • 3.3 Market size 2023
    • 3.4 Market outlook: Forecast for 2023-2028
      • Exhibit 14: Chart on Global - Market size and forecast 2023-2028 ($ billion)
      • Exhibit 15: Data Table on Global - Market size and forecast 2023-2028 ($ billion)
      • Exhibit 16: Chart on Global Market: Year-over-year growth 2023-2028 (%)
      • Exhibit 17: Data Table on Global Market: Year-over-year growth 2023-2028 (%)

    4 Historic Market Size

    • 4.1 Global automotive vacuum less braking market 2018 - 2022
      • Exhibit 18: Historic Market Size – Data Table on global automotive vacuum less braking market 2018 - 2022 ($ billion)
    • 4.2 Application Segment Analysis 2018 - 2022
      • Exhibit 19: Historic Market Size – Application Segment 2018 - 2022 ($ billion)
    • 4.3 End-user Segment Analysis 2018 - 2022
      • Exhibit 20: Historic Market Size – End-user Segment 2018 - 2022 ($ billion)
    • 4.4 Geography Segment Analysis 2018 - 2022
      • Exhibit 21: Historic Market Size – Geography Segment 2018 - 2022 ($ billion)
    • 4.5 Country Segment Analysis 2018 - 2022
      • Exhibit 22: Historic Market Size – Country Segment 2018 - 2022 ($ billion)

    5 Five Forces Analysis

    • 5.1 Five forces summary
      • Exhibit 23: Five forces analysis - Comparison between 2023 and 2028
    • 5.2 Bargaining power of buyers
      • Exhibit 24: Chart on Bargaining power of buyers – Impact of key factors 2023 and 2028
    • 5.3 Bargaining power of suppliers
      • Exhibit 25: Bargaining power of suppliers – Impact of key factors in 2023 and 2028
    • 5.4 Threat of new entrants
      • Exhibit 26: Threat of new entrants – Impact of key factors in 2023 and 2028
    • 5.5 Threat of substitutes
      • Exhibit 27: Threat of substitutes – Impact of key factors in 2023 and 2028
    • 5.6 Threat of rivalry
      • Exhibit 28: Threat of rivalry – Impact of key factors in 2023 and 2028
    • 5.7 Market condition
      • Exhibit 29: Chart on Market condition - Five forces 2023 and 2028

    6 Market Segmentation by Application

    • 6.1 Market segments
      • Exhibit 30: Chart on Application - Market share 2023-2028 (%)
      • Exhibit 31: Data Table on Application - Market share 2023-2028 (%)
    • 6.2 Comparison by Application
      • Exhibit 32: Chart on Comparison by Application
      • Exhibit 33: Data Table on Comparison by Application
    • 6.3 Passenger vehicle - Market size and forecast 2023-2028
      • Exhibit 34: Chart on Passenger vehicle - Market size and forecast 2023-2028 ($ billion)
      • Exhibit 35: Data Table on Passenger vehicle - Market size and forecast 2023-2028 ($ billion)
      • Exhibit 36: Chart on Passenger vehicle - Year-over-year growth 2023-2028 (%)
      • Exhibit 37: Data Table on Passenger vehicle - Year-over-year growth 2023-2028 (%)
    • 6.4 Commercial vehicle - Market size and forecast 2023-2028
      • Exhibit 38: Chart on Commercial vehicle - Market size and forecast 2023-2028 ($ billion)
      • Exhibit 39: Data Table on Commercial vehicle - Market size and forecast 2023-2028 ($ billion)
      • Exhibit 40: Chart on Commercial vehicle - Year-over-year growth 2023-2028 (%)
      • Exhibit 41: Data Table on Commercial vehicle - Year-over-year growth 2023-2028 (%)
    • 6.5 Market opportunity by Application
      • Exhibit 42: Market opportunity by Application ($ billion)
      • Exhibit 43: Data Table on Market opportunity by Application ($ billion)

    7 Market Segmentation by End-user

    • 7.1 Market segments
      • Exhibit 44: Chart on End-user - Market share 2023-2028 (%)
      • Exhibit 45: Data Table on End-user - Market share 2023-2028 (%)
    • 7.2 Comparison by End-user
      • Exhibit 46: Chart on Comparison by End-user
      • Exhibit 47: Data Table on Comparison by End-user
    • 7.3 OEM - Market size and forecast 2023-2028
      • Exhibit 48: Chart on OEM - Market size and forecast 2023-2028 ($ billion)
      • Exhibit 49: Data Table on OEM - Market size and forecast 2023-2028 ($ billion)
      • Exhibit 50: Chart on OEM - Year-over-year growth 2023-2028 (%)
      • Exhibit 51: Data Table on OEM - Year-over-year growth 2023-2028 (%)
    • 7.4 Aftermarket - Market size and forecast 2023-2028
      • Exhibit 52: Chart on Aftermarket - Market size and forecast 2023-2028 ($ billion)
      • Exhibit 53: Data Table on Aftermarket - Market size and forecast 2023-2028 ($ billion)
      • Exhibit 54: Chart on Aftermarket - Year-over-year growth 2023-2028 (%)
      • Exhibit 55: Data Table on Aftermarket - Year-over-year growth 2023-2028 (%)
    • 7.5 Market opportunity by End-user
      • Exhibit 56: Market opportunity by End-user ($ billion)
      • Exhibit 57: Data Table on Market opportunity by End-user ($ billion)

    8 Customer Landscape

    • 8.1 Customer landscape overview
      • Exhibit 58: Analysis of price sensitivity, lifecycle, customer purchase basket, adoption rates, and purchase criteria

    9 Geographic Landscape

    • 9.1 Geographic segmentation
      • Exhibit 59: Chart on Market share by geography 2023-2028 (%)
      • Exhibit 60: Data Table on Market share by geography 2023-2028 (%)
    • 9.2 Geographic comparison
      • Exhibit 61: Chart on Geographic comparison
      • Exhibit 62: Data Table on Geographic comparison
    • 9.3 APAC - Market size and forecast 2023-2028
      • Exhibit 63: Chart on APAC - Market size and forecast 2023-2028 ($ billion)
      • Exhibit 64: Data Table on APAC - Market size and forecast 2023-2028 ($ billion)
      • Exhibit 65: Chart on APAC - Year-over-year growth 2023-2028 (%)
      • Exhibit 66: Data Table on APAC - Year-over-year growth 2023-2028 (%)
    • 9.4 Europe - Market size and forecast 2023-2028
      • Exhibit 67: Chart on Europe - Market size and forecast 2023-2028 ($ billion)
      • Exhibit 68: Data Table on Europe - Market size and forecast 2023-2028 ($ billion)
      • Exhibit 69: Chart on Europe - Year-over-year growth 2023-2028 (%)
      • Exhibit 70: Data Table on Europe - Year-over-year growth 2023-2028 (%)
    • 9.5 North America - Market size and forecast 2023-2028
      • Exhibit 71: Chart on North America - Market size and forecast 2023-2028 ($ billion)
      • Exhibit 72: Data Table on North America - Market size and forecast 2023-2028 ($ billion)
      • Exhibit 73: Chart on North America - Year-over-year growth 2023-2028 (%)
      • Exhibit 74: Data Table on North America - Year-over-year growth 2023-2028 (%)
    • 9.6 South America - Market size and forecast 2023-2028
      • Exhibit 75: Chart on South America - Market size and forecast 2023-2028 ($ billion)
      • Exhibit 76: Data Table on South America - Market size and forecast 2023-2028 ($ billion)
      • Exhibit 77: Chart on South America - Year-over-year growth 2023-2028 (%)
      • Exhibit 78: Data Table on South America - Year-over-year growth 2023-2028 (%)
    • 9.7 Middle East and Africa - Market size and forecast 2023-2028
      • Exhibit 79: Chart on Middle East and Africa - Market size and forecast 2023-2028 ($ billion)
      • Exhibit 80: Data Table on Middle East and Africa - Market size and forecast 2023-2028 ($ billion)
      • Exhibit 81: Chart on Middle East and Africa - Year-over-year growth 2023-2028 (%)
      • Exhibit 82: Data Table on Middle East and Africa - Year-over-year growth 2023-2028 (%)
    • 9.8 China - Market size and forecast 2023-2028
      • Exhibit 83: Chart on China - Market size and forecast 2023-2028 ($ billion)
      • Exhibit 84: Data Table on China - Market size and forecast 2023-2028 ($ billion)
      • Exhibit 85: Chart on China - Year-over-year growth 2023-2028 (%)
      • Exhibit 86: Data Table on China - Year-over-year growth 2023-2028 (%)
    • 9.9 US - Market size and forecast 2023-2028
      • Exhibit 87: Chart on US - Market size and forecast 2023-2028 ($ billion)
      • Exhibit 88: Data Table on US - Market size and forecast 2023-2028 ($ billion)
      • Exhibit 89: Chart on US - Year-over-year growth 2023-2028 (%)
      • Exhibit 90: Data Table on US - Year-over-year growth 2023-2028 (%)
    • 9.10 Japan - Market size and forecast 2023-2028
      • Exhibit 91: Chart on Japan - Market size and forecast 2023-2028 ($ billion)
      • Exhibit 92: Data Table on Japan - Market size and forecast 2023-2028 ($ billion)
      • Exhibit 93: Chart on Japan - Year-over-year growth 2023-2028 (%)
      • Exhibit 94: Data Table on Japan - Year-over-year growth 2023-2028 (%)
    • 9.11 Germany - Market size and forecast 2023-2028
      • Exhibit 95: Chart on Germany - Market size and forecast 2023-2028 ($ billion)
      • Exhibit 96: Data Table on Germany - Market size and forecast 2023-2028 ($ billion)
      • Exhibit 97: Chart on Germany - Year-over-year growth 2023-2028 (%)
      • Exhibit 98: Data Table on Germany - Year-over-year growth 2023-2028 (%)
    • 9.12 South Korea - Market size and forecast 2023-2028
      • Exhibit 99: Chart on South Korea - Market size and forecast 2023-2028 ($ billion)
      • Exhibit 100: Data Table on South Korea - Market size and forecast 2023-2028 ($ billion)
      • Exhibit 101: Chart on South Korea - Year-over-year growth 2023-2028 (%)
      • Exhibit 102: Data Table on South Korea - Year-over-year growth 2023-2028 (%)
    • 9.13 Market opportunity by geography
      • Exhibit 103: Market opportunity by geography ($ billion)
      • Exhibit 104: Data Tables on Market opportunity by geography ($ billion)

    10 Drivers, Challenges, and Trends

    • 10.1 Market drivers
      • 10.2 Market challenges
        • 10.3 Impact of drivers and challenges
          • Exhibit 105: Impact of drivers and challenges in 2023 and 2028
        • 10.4 Market trends

          11 Vendor Landscape

          • 11.1 Overview
            • 11.2 Vendor landscape
              • Exhibit 106: Overview on Criticality of inputs and Factors of differentiation
            • 11.3 Landscape disruption
              • Exhibit 107: Overview on factors of disruption
            • 11.4 Industry risks
              • Exhibit 108: Impact of key risks on business

            12 Vendor Analysis

            • 12.1 Vendors covered
              • Exhibit 109: Vendors covered
            • 12.2 Market positioning of vendors
              • Exhibit 110: Matrix on vendor position and classification
            • 12.3 Aptiv Plc
              • Exhibit 111: Aptiv Plc - Overview
              • Exhibit 112: Aptiv Plc - Business segments
              • Exhibit 113: Aptiv Plc - Key offerings
              • Exhibit 114: Aptiv Plc - Segment focus
            • 12.4 BorgWarner Inc.
              • Exhibit 115: BorgWarner Inc. - Overview
              • Exhibit 116: BorgWarner Inc. - Business segments
              • Exhibit 117: BorgWarner Inc. - Key news
              • Exhibit 118: BorgWarner Inc. - Key offerings
              • Exhibit 119: BorgWarner Inc. - Segment focus
            • 12.5 Brembo Spa
              • Exhibit 120: Brembo Spa - Overview
              • Exhibit 121: Brembo Spa - Business segments
              • Exhibit 122: Brembo Spa - Key offerings
              • Exhibit 123: Brembo Spa - Segment focus
            • 12.6 Continental AG
              • Exhibit 124: Continental AG - Overview
              • Exhibit 125: Continental AG - Business segments
              • Exhibit 126: Continental AG - Key offerings
              • Exhibit 127: Continental AG - Segment focus
            • 12.7 Cummins Inc.
              • Exhibit 128: Cummins Inc. - Overview
              • Exhibit 129: Cummins Inc. - Business segments
              • Exhibit 130: Cummins Inc. - Key offerings
              • Exhibit 131: Cummins Inc. - Segment focus
            • 12.8 GUD Holdings Ltd.
              • Exhibit 132: GUD Holdings Ltd. - Overview
              • Exhibit 133: GUD Holdings Ltd. - Business segments
              • Exhibit 134: GUD Holdings Ltd. - Key offerings
              • Exhibit 135: GUD Holdings Ltd. - Segment focus
            • 12.9 Haldex AB
              • Exhibit 136: Haldex AB - Overview
              • Exhibit 137: Haldex AB - Product / Service
              • Exhibit 138: Haldex AB - Key offerings
            • 12.10 Hitachi Ltd.
              • Exhibit 139: Hitachi Ltd. - Overview
              • Exhibit 140: Hitachi Ltd. - Business segments
              • Exhibit 141: Hitachi Ltd. - Key news
              • Exhibit 142: Hitachi Ltd. - Key offerings
              • Exhibit 143: Hitachi Ltd. - Segment focus
            • 12.11 Knorr Bremse AG
              • Exhibit 144: Knorr Bremse AG - Overview
              • Exhibit 145: Knorr Bremse AG - Business segments
              • Exhibit 146: Knorr Bremse AG - Key offerings
              • Exhibit 147: Knorr Bremse AG - Segment focus
            • 12.12 LSP Innovative Automotive Systems GmbH
              • Exhibit 148: LSP Innovative Automotive Systems GmbH - Overview
              • Exhibit 149: LSP Innovative Automotive Systems GmbH - Product / Service
              • Exhibit 150: LSP Innovative Automotive Systems GmbH - Key offerings
            • 12.13 Nabtesco Corp.
              • Exhibit 151: Nabtesco Corp. - Overview
              • Exhibit 152: Nabtesco Corp. - Business segments
              • Exhibit 153: Nabtesco Corp. - Key offerings
              • Exhibit 154: Nabtesco Corp. - Segment focus
            • 12.14 Performance Friction Corp.
              • Exhibit 155: Performance Friction Corp. - Overview
              • Exhibit 156: Performance Friction Corp. - Product / Service
              • Exhibit 157: Performance Friction Corp. - Key offerings
            • 12.15 Robert Bosch GmbH
              • Exhibit 158: Robert Bosch GmbH - Overview
              • Exhibit 159: Robert Bosch GmbH - Business segments
              • Exhibit 160: Robert Bosch GmbH - Key news
              • Exhibit 161: Robert Bosch GmbH - Key offerings
              • Exhibit 162: Robert Bosch GmbH - Segment focus
            • 12.16 Westinghouse Air Brake Technologies Corp.
              • Exhibit 163: Westinghouse Air Brake Technologies Corp. - Overview
              • Exhibit 164: Westinghouse Air Brake Technologies Corp. - Business segments
              • Exhibit 165: Westinghouse Air Brake Technologies Corp. - Key news
              • Exhibit 166: Westinghouse Air Brake Technologies Corp. - Key offerings
              • Exhibit 167: Westinghouse Air Brake Technologies Corp. - Segment focus
            • 12.17 ZF Off Highway Solutions Minnesota Inc.
              • Exhibit 168: ZF Off Highway Solutions Minnesota Inc. - Overview
              • Exhibit 169: ZF Off Highway Solutions Minnesota Inc. - Product / Service
              • Exhibit 170: ZF Off Highway Solutions Minnesota Inc. - Key offerings

            13 Appendix

            • 13.1 Scope of the report
              • 13.2 Inclusions and exclusions checklist
                • Exhibit 171: Inclusions checklist
                • Exhibit 172: Exclusions checklist
              • 13.3 Currency conversion rates for US$
                • Exhibit 173: Currency conversion rates for US$
              • 13.4 Research methodology
                • Exhibit 174: Research methodology
                • Exhibit 175: Validation techniques employed for market sizing
                • Exhibit 176: Information sources
              • 13.5 List of abbreviations
                • Exhibit 177: List of abbreviations

              Research Methodology

              Technavio presents a detailed picture of the market by way of study, synthesis, and summation of data from multiple sources. The analysts have presented the various facets of the market with a particular focus on identifying the key industry influencers. The data thus presented is comprehensive, reliable, and the result of extensive research, both primary and secondary.

              INFORMATION SOURCES

              Primary sources

              • Manufacturers and suppliers
              • Channel partners
              • Industry experts
              • Strategic decision makers

              Secondary sources

              • Industry journals and periodicals
              • Government data
              • Financial reports of key industry players
              • Historical data
              • Press releases

              DATA ANALYSIS

              Data Synthesis

              • Collation of data
              • Estimation of key figures
              • Analysis of derived insights

              Data Validation

              • Triangulation with data models
              • Reference against proprietary databases
              • Corroboration with industry experts

              REPORT WRITING

              Qualitative

              • Market drivers
              • Market challenges
              • Market trends
              • Five forces analysis

              Quantitative

              • Market size and forecast
              • Market segmentation
              • Geographical insights
              • Competitive landscape

              Interested in this report?

              Get your sample now to see our research methodology and insights!

              Download Now

              Frequently Asked Questions

              Automotive Vacuumless Braking market growth will increase by $ 3.08 bn during 2024-2028.

              The Automotive Vacuumless Braking market is expected to grow at a CAGR of 7.73% during 2024-2028.

              Automotive Vacuumless Braking market is segmented by Application( Passenger vehicle, Commercial vehicle) End-user( OEM, Aftermarket, North America, Middle East and Africa, South America)

              Aptiv Plc, BorgWarner Inc., Brembo Spa, Continental AG, Cummins Inc., GUD Holdings Ltd., Haldex AB, Hitachi Ltd., Knorr Bremse AG, LSP Innovative Automotive Systems GmbH, Nabtesco Corp., Performance Friction Corp., Robert Bosch GmbH, TSE Brakes Inc., Westinghouse Air Brake Technologies Corp., ZF Off Highway Solutions Minnesota Inc. are a few of the key vendors in the Automotive Vacuumless Braking market.

              APAC will register the highest growth rate of 48% among the other regions. Therefore, the Automotive Vacuumless Braking market in APAC is expected to garner significant business opportunities for the vendors during the forecast period.

              US, China, Japan, South Korea, Germany

              • Increase in demand for environmentally sustainable solutionsEnvironmental sustainability serves as a pivotal driver in propelling the growth of the global automotive vacuumless braking market. As the automotive industry grapples with the imperative to reduce its environmental footprint is the driving factor this market.
              • vacuumless braking systems emerge as a transformative solution. By eliminating traditional vacuum boosters and optimizing braking efficiency is the driving factor this market.
              • these systems contribute significantly to energy conservation and reduce carbon emissions. The lightweight design of vacuumless braking components not only enhances vehicle fuel efficiency but also aligns with the industrys commitment to lightweight strategies is the driving factor this market.
              • further curbing greenhouse gas emissions. The seamless integration of vacuumless braking systems with electric and hybrid vehicles underscores their role in fostering sustainable practices within the automotive sector. Regulatory pressure for stringent emissions standards globally reinforces the demand for eco-friendly braking technologies is the driving factor this market.
              • positioning vacuumless braking systems as a key enabler for manufacturers to achieve compliance while bolstering their environmental stewardship credentials. As consumer preferences increasingly pivot toward sustainable automotive solutions is the driving factor this market.
              • the adoption of vacuumless braking systems not only addresses regulatory imperatives but also aligns with the industrys broader mission of achieving a more environmentally conscious and sustainable transportation ecosystem and is the driving factor this market.
              • hence is the driving factor this market.
              • will drive the growth of the global automotive vacuumless braking market during the forecast period. is the driving factor this market.

              The Automotive Vacuumless Braking market vendors should focus on grabbing business opportunities from the Passenger vehicle segment as it accounted for the largest market share in the base year.
              RIA - Research AI Assistant
              Ask RIA