Bearings Market Analysis, Size, and Forecast 2026-2030: APAC (China, Japan, and India), Europe (Germany, UK, and France), North America (US, Canada, and Mexico), South America (Brazil and Argentina), Middle East and Africa (South Africa, UAE, and Saudi Arabia), and Rest of World (ROW)

Bearings Market Analysis, Size, and Forecast 2026-2030:
APAC (China, Japan, and India), Europe (Germany, UK, and France), North America (US, Canada, and Mexico), South America (Brazil and Argentina), Middle East and Africa (South Africa, UAE, and Saudi Arabia), and Rest of World (ROW)

Published: Apr 2026 341 Pages SKU: IRTNTR43275

Market Overview at a Glance

$17.90 B
Market Opportunity
3.4%
CAGR 2025 - 2030
39.8%
APAC Growth
$57.94 B
Anti-friction bearings segment 2024

Bearings Market Size 2026-2030

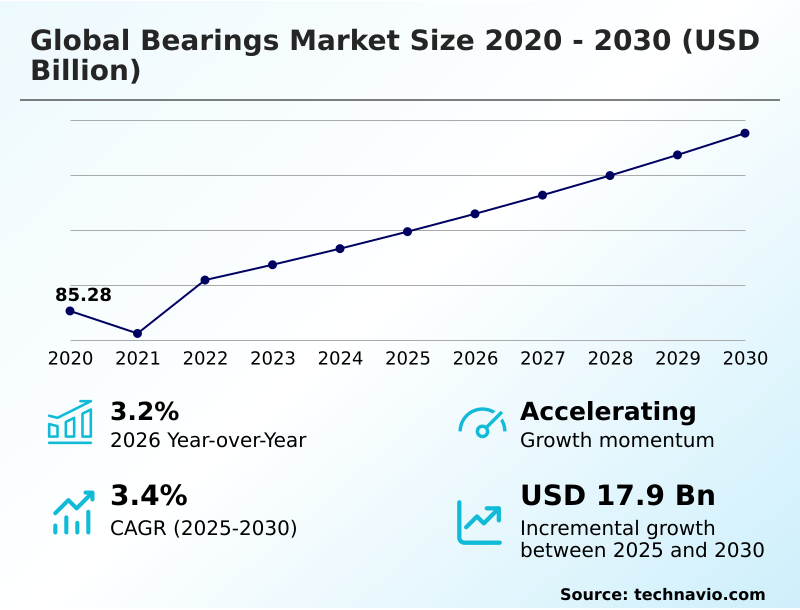
The bearings market size is valued to increase by USD 17.90 billion, at a CAGR of 3.4% from 2025 to 2030. Integration of industrial automation and predictive maintenance systems will drive the bearings market.

Major Market Trends & Insights

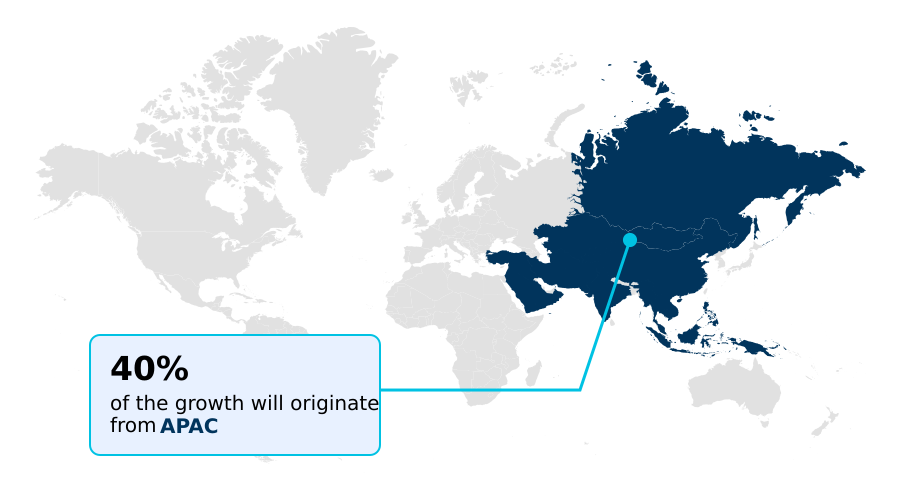
  • APAC dominated the market and accounted for a 39.8% growth during the forecast period.
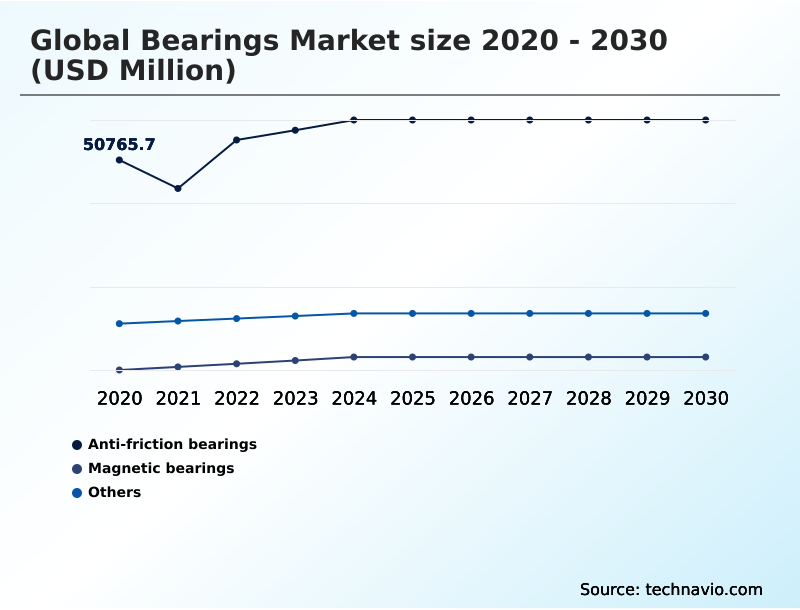
  • By Product - Anti-friction bearings segment was valued at USD 57.94 billion in 2024
  • By End-user - Automotive industry segment accounted for the largest market revenue share in 2024

Market Size & Forecast

  • Market Opportunities: USD 32.32 billion
  • Market Future Opportunities: USD 17.90 billion
  • CAGR from 2025 to 2030 : 3.4%

Market Summary

  • The bearings market is undergoing a significant transformation, driven by the convergence of advanced mechanical engineering and digital innovation. The global push towards sustainability and energy efficiency is compelling manufacturers to develop components with superior performance characteristics, including improved load carrying capacity and fatigue resistance.
  • A key driver is the rapid expansion of electric vehicle platforms, which demand specialized components like hybrid ceramic bearings and low friction bearing designs to optimize range and performance. Simultaneously, the integration of industrial automation and smart factory technologies is creating a strong demand for sensor-equipped bearings that enable predictive maintenance frameworks.
  • For example, a modern manufacturing facility can leverage real-time data from these mechatronic systems to anticipate equipment failures, scheduling MRO services proactively to avoid costly downtime. This shift toward intelligent motion technology is redefining the value of bearings from simple mechanical parts to critical data nodes in the industrial ecosystem.
  • However, the industry faces challenges from geopolitical instability, which disrupts supply chains and contributes to raw material cost inflation. Despite these hurdles, the focus on circular economy models and remanufacturing programs presents new avenues for growth and sustainability.

What will be the Size of the Bearings Market during the forecast period?

Get Key Insights on Market Forecast (PDF) Request Free Sample

How is the Bearings Market Segmented?

The bearings industry research report provides comprehensive data (region-wise segment analysis), with forecasts and estimates in "USD million" for the period 2026-2030, as well as historical data from 2020-2024 for the following segments.

  • Product
    • Anti-friction bearings
    • Magnetic bearings
    • Others
  • End-user
    • Automotive industry
    • Heavy industry
    • ARS industry
    • Others
  • Type
    • Mounted bearing
    • Unmounted bearing
  • Distribution channel
    • OEM
    • Aftermarket
  • Measurement
    • 30 to 40
    • 41 to 50
    • 51 to 60
    • 61 to 70
    • 70 and above
  • Geography
    • APAC
      • China
      • Japan
      • India
    • Europe
      • Germany
      • UK
      • France
    • North America
      • US
      • Canada
      • Mexico
    • South America
      • Brazil
      • Argentina
    • Middle East and Africa
      • South Africa
      • UAE
      • Saudi Arabia
    • Rest of World (ROW)

By Product Insights

The anti-friction bearings segment is estimated to witness significant growth during the forecast period.

The anti-friction bearings segment, including rolling element bearings, is fundamental to the industry, driven by global shifts toward electric vehicle platforms and industrial automation.

Demand is escalating for premium, high-capacity bearings that minimize parasitic losses to meet strict energy efficiency standards. This includes low friction bearing designs and those offering superior thermal management.

The integration of sensor-equipped anti-friction bearings into predictive maintenance frameworks is becoming standard, enabling real-time condition monitoring. These smart factory technologies improve operational efficiency and are pivotal in reducing total cost of ownership.

This evolution from simple components to data-gathering assets has extended the operational lifespan of heavy machinery by up to 15% in certain applications, showcasing a significant market transition.

Request Free Sample

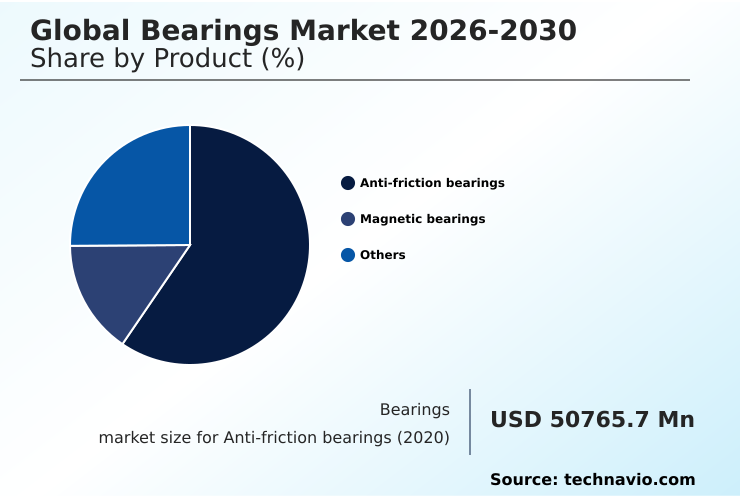
The Anti-friction bearings segment was valued at USD 57.94 billion in 2024 and showed a gradual increase during the forecast period.

Request Free Sample

Regional Analysis

APAC is estimated to contribute 39.8% to the growth of the global market during the forecast period.Technavio’s analysts have elaborately explained the regional trends and drivers that shape the market during the forecast period.

See How Bearings Market Demand is Rising in APAC Request Free Sample

The geographic landscape of the bearings market is dominated by the APAC region, which accounts for approximately 40% of the market and is driven by its expansive manufacturing sector.

The region's growth is fueled by heavy industrial machinery and a booming automotive drivetrain market.

In contrast, Europe and North America are mature markets that lead in technological innovation, particularly in high-precision engineering and motion technology for aerospace manufacturing and electric vehicle platforms.

Europe's market is heavily influenced by stringent sustainability regulations, pushing the adoption of circular economy models and energy efficiency. North America is experiencing a resurgence in domestic manufacturing, spurred by investments in industrial automation and supply chain regionalization.

South America and the Middle East and Africa represent smaller but growing markets, primarily driven by mining, agriculture, and new infrastructure projects.

Market Dynamics

Our researchers analyzed the data with 2025 as the base year, along with the key drivers, trends, and challenges. A holistic analysis of drivers will help companies refine their marketing strategies to gain a competitive advantage.

  • The strategic direction of the global bearings market is increasingly shaped by specialized, high-performance applications. The demand for low friction bearings for electric vehicles is accelerating, as automotive manufacturers prioritize range and efficiency. Similarly, the expansion of renewable energy sources drives the need for high capacity bearings for wind turbines, which must endure extreme operational stress.
  • The integration of smart bearings with integrated IoT sensors is revolutionizing industrial operations, making predictive maintenance for industrial bearings a standard practice rather than a luxury. This digital shift helps mitigate operational risks, although it does not fully solve the persistent skilled labor gap in precision bearing production, which is a significant concern.
  • In parallel, the development of lightweight bearing solutions for aerospace and corrosion resistant bearings for marine applications highlights the industry's focus on material science innovation. The adoption of self-lubricating bearings for heavy machinery addresses maintenance challenges in harsh environments. Strategically, businesses are also confronting the impact of raw material costs on bearings and broader supply chain challenges in bearing manufacturing.
  • The push towards sustainability is materializing through the circular economy in bearing remanufacturing, where some companies report brand reputation scores improving at nearly double the rate of those not engaged in such programs. Finally, creating high precision bearings for robotic applications remains a key growth area, reflecting the broader trend toward automation.

What are the key market drivers leading to the rise in the adoption of Bearings Industry?

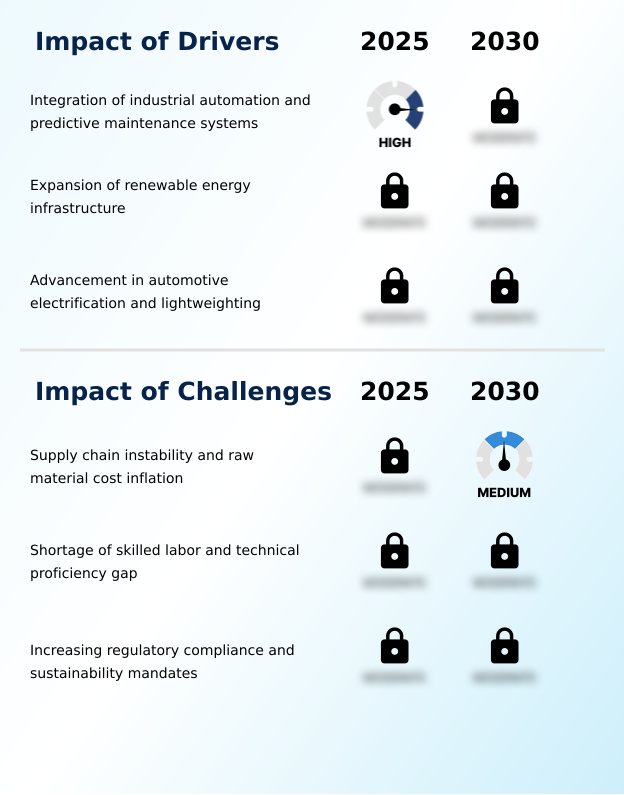
  • The integration of industrial automation and predictive maintenance systems stands as a key driver for market growth.

  • The market's growth is propelled by three primary drivers: the rapid integration of industrial automation, the global expansion of renewable energy infrastructure, and the electrification of the automotive sector.
  • In industrial settings, the demand for precision engineering is rising to improve operational efficiency.
  • The renewable energy sector, particularly wind power, relies on high capacity bearings for wind turbine main shafts, with advanced designs improving energy output by up to 5%.
  • The automotive industry's transition to electric vehicle platforms is creating significant demand for specialized bearings that enhance automotive drivetrain performance and support high-speed rotational applications.
  • These components are crucial for managing thermal stress and improving overall energy efficiency, extending vehicle range by as much as 8% in some models.

What are the market trends shaping the Bearings Industry?

  • The digitalization and integration of smart bearing technologies represent a significant upcoming market trend, driven by the increasing demand for data-driven insights and predictive maintenance capabilities.

  • Key trends reshaping the bearings market center on digitalization and sustainability. The deployment of smart bearings equipped with IoT sensors has become a critical element of modern asset management, enabling real-time condition monitoring that has been shown to reduce catastrophic equipment failures by up to 30%. This shift supports the broader adoption of predictive maintenance frameworks.
  • Concurrently, a strong focus on sustainability is driving the implementation of circular economy models, including comprehensive remanufacturing programs. These initiatives, along with advances in self-lubricating bearing technology, not only reduce environmental impact but also lower the total cost of ownership. The trend of supply chain regionalization continues to gain momentum as a strategy to mitigate risks associated with geopolitical instability.

What challenges does the Bearings Industry face during its growth?

  • Supply chain instability and raw material cost inflation pose a key challenge to industry growth.

  • The bearings market confronts significant headwinds from persistent supply chain disruptions and the skilled labor shortage. Volatility in global logistics has increased lead times for critical raw materials by over 40% in some cases, directly contributing to raw material cost inflation and making cost management a primary concern for manufacturers. This issue is compounded by a widening technical proficiency gap.
  • The increasing complexity of smart factory technologies and precision manufacturing requires a highly skilled workforce, yet the industry faces a talent shortage that has led to a 15% increase in production errors in certain specialized areas.
  • Additionally, navigating fragmented international regulations and increasing sustainability mandates adds a considerable layer of operational complexity and financial burden, challenging the industry's ability to standardize processes and maintain profitability.

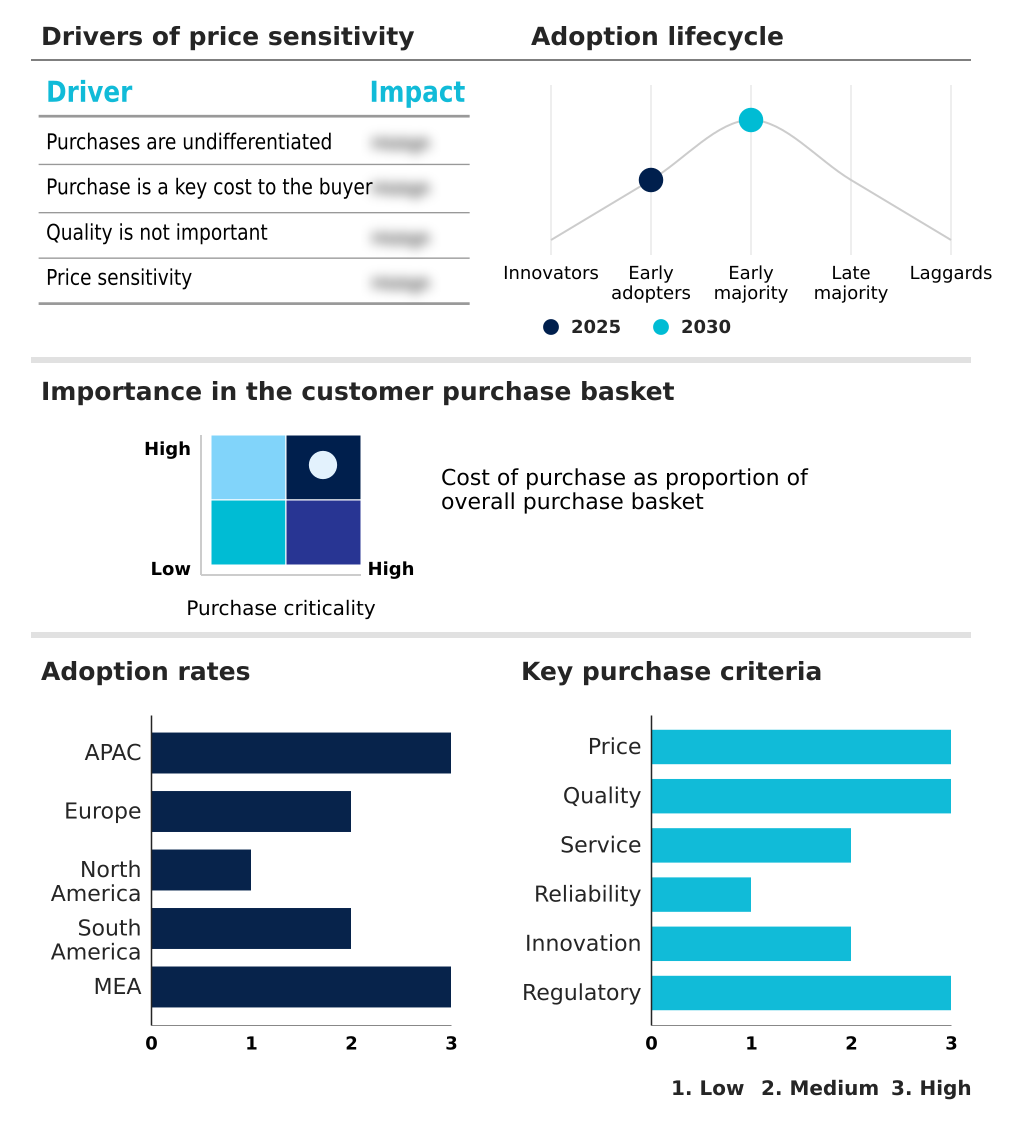
Exclusive Technavio Analysis on Customer Landscape

The bearings market forecasting report includes the adoption lifecycle of the market, covering from the innovator’s stage to the laggard’s stage. It focuses on adoption rates in different regions based on penetration. Furthermore, the bearings market report also includes key purchase criteria and drivers of price sensitivity to help companies evaluate and develop their market growth analysis strategies.

Customer Landscape of Bearings Industry

Competitive Landscape

Companies are implementing various strategies, such as strategic alliances, bearings market forecast, partnerships, mergers and acquisitions, geographical expansion, and product/service launches, to enhance their presence in the industry.

C and U Americas - The company offers a range of engine and industrial bearings, focusing on applications within the automotive and non-automotive sectors, including marine and industrial machinery.

The industry research and growth report includes detailed analyses of the competitive landscape of the market and information about key companies, including:

  • C and U Americas
  • Daido Metal Co Ltd
  • Fersa Bearings SA
  • GGB Bearing Technology
  • GMN Paul GmbH and Co. KG
  • GRW Bearing GmbH
  • JTEKT Corp.
  • Kaydon Bearings
  • LYC Bearing Corp.
  • MinebeaMitsumi Inc.
  • Nachi Fujikoshi Corp.
  • NKE Austria GmbH
  • NSK Ltd.
  • NTN Corp.
  • RBC Bearings Inc.
  • Regal Rexnord Corp.
  • Schaeffler AG
  • SKF AB
  • The Timken Co.
  • THK Co. Ltd.

Qualitative and quantitative analysis of companies has been conducted to help clients understand the wider business environment as well as the strengths and weaknesses of key industry players. Data is qualitatively analyzed to categorize companies as pure play, category-focused, industry-focused, and diversified; it is quantitatively analyzed to categorize companies as dominant, leading, strong, tentative, and weak.

Recent Development and News in Bearings market

  • In November 2024, NSK finalized the acquisition of its steering and control subsidiary, a strategic move to vertically integrate operations and streamline the manufacturing value chain in alignment with its mid-term growth plan.
  • In January 2025, Schaeffler AG presented its latest motion technology solutions at the International Automotive Technology Symposium, emphasizing innovations in vehicle electrification and energy efficiency.
  • In February 2025, SKF reorganized its corporate structure, formally separating its industrial and automotive business segments to enhance strategic focus and operational agility ahead of the automotive division's demerger.
  • In March 2025, The Timken Co. announced a strategic expansion of its engineered bearings portfolio, specifically targeting renewable energy applications to improve reliability and reduce maintenance in wind and solar power systems.

Dive into Technavio’s robust research methodology, blending expert interviews, extensive data synthesis, and validated models for unparalleled Bearings Market insights. See full methodology.

Market Scope
Page number 341
Base year 2025
Historic period 2020-2024
Forecast period 2026-2030
Growth momentum & CAGR Accelerate at a CAGR of 3.4%
Market growth 2026-2030 USD 17898.1 million
Market structure Fragmented
YoY growth 2025-2026(%) 3.2%
Key countries China, Japan, India, South Korea, Australia, Indonesia, Germany, UK, France, Italy, Spain, The Netherlands, US, Canada, Mexico, Brazil, Argentina, Chile, South Africa, UAE, Saudi Arabia, Turkey and Egypt
Competitive landscape Leading Companies, Market Positioning of Companies, Competitive Strategies, and Industry Risks

Request Free Sample

Research Analyst Overview

  • The global bearings market is defined by a relentless pursuit of mechanical and digital excellence. Core components such as the spherical roller bearing, tapered roller bearing, and deep groove ball bearing continue to evolve with advanced materials and manufacturing techniques. The integration of rolling element bearings into complex mechatronic systems is now standard, enabling unprecedented levels of control and monitoring.
  • Innovations in motion technology are focused on enhancing load carrying capacity and fatigue resistance to meet the demands of modern applications. A primary boardroom-level focus is on thermal management and vibration damping, as these factors directly impact equipment lifespan and operational costs.
  • Strategic investments are being directed towards lightweighting initiatives and developing products with superior corrosion resistance and rotational accuracy, particularly in high-value sectors. The adoption of smart technologies has led to the proliferation of predictive maintenance frameworks, with some facilities achieving a 30% reduction in unplanned downtime.
  • The market also sees growth in specialized products, including the cylindrical roller bearing, needle roller bearing, slewing ring bearing, and high-performance plain bearings, magnetic bearings, and hybrid ceramic bearings to address niche requirements.

What are the Key Data Covered in this Bearings Market Research and Growth Report?

  • What is the expected growth of the Bearings Market between 2026 and 2030?

    • USD 17.90 billion, at a CAGR of 3.4%

  • What segmentation does the market report cover?

    • The report is segmented by Product (Anti-friction bearings, Magnetic bearings, and Others), End-user (Automotive industry, Heavy industry, ARS industry, and Others), Type (Mounted bearing, and Unmounted bearing), Distribution Channel (OEM, and Aftermarket), Measurement (30 to 40, 41 to 50, 51 to 60, 61 to 70, and 70 and above) and Geography (APAC, Europe, North America, South America, Middle East and Africa)

  • Which regions are analyzed in the report?

    • APAC, Europe, North America, South America and Middle East and Africa

  • What are the key growth drivers and market challenges?

    • Integration of industrial automation and predictive maintenance systems, Supply chain instability and raw material cost inflation

  • Who are the major players in the Bearings Market?

    • C and U Americas, Daido Metal Co Ltd, Fersa Bearings SA, GGB Bearing Technology, GMN Paul GmbH and Co. KG, GRW Bearing GmbH, JTEKT Corp., Kaydon Bearings, LYC Bearing Corp., MinebeaMitsumi Inc., Nachi Fujikoshi Corp., NKE Austria GmbH, NSK Ltd., NTN Corp., RBC Bearings Inc., Regal Rexnord Corp., Schaeffler AG, SKF AB, The Timken Co. and THK Co. Ltd.

Market Research Insights

  • The bearings market dynamics are shaped by a strategic pivot towards high-value applications in renewable energy infrastructure and advanced aerospace manufacturing. This transition emphasizes operational efficiency, with firms adopting comprehensive asset management strategies reporting an 18% improvement in total cost of ownership.
  • The push for greater energy efficiency is universal; for instance, the adoption of specialized bearings in industrial automation has reduced energy consumption in certain processes by up to 12%. Concurrently, supply chain regionalization is being prioritized to mitigate risks from geopolitical instability, strengthening local MRO services and production capabilities.
  • This shift has already improved component availability by over 20% in critical sectors. The market's evolution is clearly tied to delivering measurable performance gains, with a strong focus on precision engineering and smart technologies.

We can help! Our analysts can customize this bearings market research report to meet your requirements.

Get in touch

1. Executive Summary

1.1 Market overview

Executive Summary - Chart on Market Overview
Executive Summary - Data Table on Market Overview
Executive Summary - Chart on Global Market Characteristics
Executive Summary - Chart on Market by Geography
Executive Summary - Chart on Market Segmentation by Product
Executive Summary - Chart on Market Segmentation by End-user
Executive Summary - Chart on Market Segmentation by Type
Executive Summary - Chart on Market Segmentation by Distribution Channel
Executive Summary - Chart on Market Segmentation by Measurement
Executive Summary - Chart on Incremental Growth
Executive Summary - Data Table on Incremental Growth
Executive Summary - Chart on Company Market Positioning

2. Technavio Analysis

2.1 Analysis of price sensitivity, lifecycle, customer purchase basket, adoption rates, and purchase criteria

2.2 Criticality of inputs and Factors of differentiation

Chart on Overview on criticality of inputs and factors of differentiation

2.3 Factors of disruption

Chart on Overview on factors of disruption

2.4 Impact of drivers and challenges

Chart on Impact of drivers and challenges in 2025 and 2030

3. Market Landscape

3.1 Market ecosystem

Chart on Parent Market
Data Table on - Parent Market

3.2 Market characteristics

Chart on Market characteristics analysis

3.3 Value chain analysis

Chart on Value chain analysis

4. Market Sizing

4.1 Market definition

Data Table on Offerings of companies included in the market definition

4.2 Market segment analysis

Market segments

4.3 Market size 2025

4.4 Market outlook: Forecast for 2025-2030

Chart on Global - Market size and forecast 2025-2030 ($ million)
Data Table on Global - Market size and forecast 2025-2030 ($ million)
Chart on Global Market: Year-over-year growth 2025-2030 (%)
Data Table on Global Market: Year-over-year growth 2025-2030 (%)

5. Historic Market Size

5.1 Global Bearings Market 2020 - 2024

Historic Market Size - Data Table on Global Bearings Market 2020 - 2024 ($ million)

5.2 Product segment analysis 2020 - 2024

Historic Market Size - Product Segment 2020 - 2024 ($ million)

5.3 End-user segment analysis 2020 - 2024

Historic Market Size - End-user Segment 2020 - 2024 ($ million)

5.4 Type segment analysis 2020 - 2024

Historic Market Size - Type Segment 2020 - 2024 ($ million)

5.5 Distribution Channel segment analysis 2020 - 2024

Historic Market Size - Distribution Channel Segment 2020 - 2024 ($ million)

5.6 Measurement segment analysis 2020 - 2024

Historic Market Size - Measurement Segment 2020 - 2024 ($ million)

5.7 Geography segment analysis 2020 - 2024

Historic Market Size - Geography Segment 2020 - 2024 ($ million)

5.8 Country segment analysis 2020 - 2024

Historic Market Size - Country Segment 2020 - 2024 ($ million)

6. Qualitative Analysis

6.1 Impact of AI on global bearings market

6.2 Impact of geopolitical conflicts on global bearings market

7. Five Forces Analysis

7.1 Five forces summary

Five forces analysis - Comparison between 2025 and 2030

7.2 Bargaining power of buyers

Bargaining power of buyers - Impact of key factors 2025 and 2030

7.3 Bargaining power of suppliers

Bargaining power of suppliers - Impact of key factors in 2025 and 2030

7.4 Threat of new entrants

Threat of new entrants - Impact of key factors in 2025 and 2030

7.5 Threat of substitutes

Threat of substitutes - Impact of key factors in 2025 and 2030

7.6 Threat of rivalry

Threat of rivalry - Impact of key factors in 2025 and 2030

7.7 Market condition

Chart on Market condition - Five forces 2025 and 2030

8. Market Segmentation by Product

8.1 Market segments

Chart on Product - Market share 2025-2030 (%)
Data Table on Product - Market share 2025-2030 (%)

8.2 Comparison by Product

Chart on Comparison by Product
Data Table on Comparison by Product

8.3 Anti-friction bearings - Market size and forecast 2025-2030

Chart on Anti-friction bearings - Market size and forecast 2025-2030 ($ million)
Data Table on Anti-friction bearings - Market size and forecast 2025-2030 ($ million)
Chart on Anti-friction bearings - Year-over-year growth 2025-2030 (%)
Data Table on Anti-friction bearings - Year-over-year growth 2025-2030 (%)

8.4 Magnetic bearings - Market size and forecast 2025-2030

Chart on Magnetic bearings - Market size and forecast 2025-2030 ($ million)
Data Table on Magnetic bearings - Market size and forecast 2025-2030 ($ million)
Chart on Magnetic bearings - Year-over-year growth 2025-2030 (%)
Data Table on Magnetic bearings - Year-over-year growth 2025-2030 (%)

8.5 Others - Market size and forecast 2025-2030

Chart on Others - Market size and forecast 2025-2030 ($ million)
Data Table on Others - Market size and forecast 2025-2030 ($ million)
Chart on Others - Year-over-year growth 2025-2030 (%)
Data Table on Others - Year-over-year growth 2025-2030 (%)

8.6 Market opportunity by Product

Market opportunity by Product ($ million)
Data Table on Market opportunity by Product ($ million)

9. Market Segmentation by End-user

9.1 Market segments

Chart on End-user - Market share 2025-2030 (%)
Data Table on End-user - Market share 2025-2030 (%)

9.2 Comparison by End-user

Chart on Comparison by End-user
Data Table on Comparison by End-user

9.3 Automotive industry - Market size and forecast 2025-2030

Chart on Automotive industry - Market size and forecast 2025-2030 ($ million)
Data Table on Automotive industry - Market size and forecast 2025-2030 ($ million)
Chart on Automotive industry - Year-over-year growth 2025-2030 (%)
Data Table on Automotive industry - Year-over-year growth 2025-2030 (%)

9.4 Heavy industry - Market size and forecast 2025-2030

Chart on Heavy industry - Market size and forecast 2025-2030 ($ million)
Data Table on Heavy industry - Market size and forecast 2025-2030 ($ million)
Chart on Heavy industry - Year-over-year growth 2025-2030 (%)
Data Table on Heavy industry - Year-over-year growth 2025-2030 (%)

9.5 ARS industry - Market size and forecast 2025-2030

Chart on ARS industry - Market size and forecast 2025-2030 ($ million)
Data Table on ARS industry - Market size and forecast 2025-2030 ($ million)
Chart on ARS industry - Year-over-year growth 2025-2030 (%)
Data Table on ARS industry - Year-over-year growth 2025-2030 (%)

9.6 Others - Market size and forecast 2025-2030

Chart on Others - Market size and forecast 2025-2030 ($ million)
Data Table on Others - Market size and forecast 2025-2030 ($ million)
Chart on Others - Year-over-year growth 2025-2030 (%)
Data Table on Others - Year-over-year growth 2025-2030 (%)

9.7 Market opportunity by End-user

Market opportunity by End-user ($ million)
Data Table on Market opportunity by End-user ($ million)

10. Market Segmentation by Type

10.1 Market segments

Chart on Type - Market share 2025-2030 (%)
Data Table on Type - Market share 2025-2030 (%)

10.2 Comparison by Type

Chart on Comparison by Type
Data Table on Comparison by Type

10.3 Mounted bearing - Market size and forecast 2025-2030

Chart on Mounted bearing - Market size and forecast 2025-2030 ($ million)
Data Table on Mounted bearing - Market size and forecast 2025-2030 ($ million)
Chart on Mounted bearing - Year-over-year growth 2025-2030 (%)
Data Table on Mounted bearing - Year-over-year growth 2025-2030 (%)

10.4 Unmounted bearing - Market size and forecast 2025-2030

Chart on Unmounted bearing - Market size and forecast 2025-2030 ($ million)
Data Table on Unmounted bearing - Market size and forecast 2025-2030 ($ million)
Chart on Unmounted bearing - Year-over-year growth 2025-2030 (%)
Data Table on Unmounted bearing - Year-over-year growth 2025-2030 (%)

10.5 Market opportunity by Type

Market opportunity by Type ($ million)
Data Table on Market opportunity by Type ($ million)

11. Market Segmentation by Distribution Channel

11.1 Market segments

Chart on Distribution Channel - Market share 2025-2030 (%)
Data Table on Distribution Channel - Market share 2025-2030 (%)

11.2 Comparison by Distribution Channel

Chart on Comparison by Distribution Channel
Data Table on Comparison by Distribution Channel

11.3 OEM - Market size and forecast 2025-2030

Chart on OEM - Market size and forecast 2025-2030 ($ million)
Data Table on OEM - Market size and forecast 2025-2030 ($ million)
Chart on OEM - Year-over-year growth 2025-2030 (%)
Data Table on OEM - Year-over-year growth 2025-2030 (%)

11.4 Aftermarket - Market size and forecast 2025-2030

Chart on Aftermarket - Market size and forecast 2025-2030 ($ million)
Data Table on Aftermarket - Market size and forecast 2025-2030 ($ million)
Chart on Aftermarket - Year-over-year growth 2025-2030 (%)
Data Table on Aftermarket - Year-over-year growth 2025-2030 (%)

11.5 Market opportunity by Distribution Channel

Market opportunity by Distribution Channel ($ million)
Data Table on Market opportunity by Distribution Channel ($ million)

12. Market Segmentation by Measurement

12.1 Market segments

Chart on Measurement - Market share 2025-2030 (%)
Data Table on Measurement - Market share 2025-2030 (%)

12.2 Comparison by Measurement

Chart on Comparison by Measurement
Data Table on Comparison by Measurement

12.3 30 to 40 - Market size and forecast 2025-2030

Chart on 30 to 40 - Market size and forecast 2025-2030 ($ million)
Data Table on 30 to 40 - Market size and forecast 2025-2030 ($ million)
Chart on 30 to 40 - Year-over-year growth 2025-2030 (%)
Data Table on 30 to 40 - Year-over-year growth 2025-2030 (%)

12.4 41 to 50 - Market size and forecast 2025-2030

Chart on 41 to 50 - Market size and forecast 2025-2030 ($ million)
Data Table on 41 to 50 - Market size and forecast 2025-2030 ($ million)
Chart on 41 to 50 - Year-over-year growth 2025-2030 (%)
Data Table on 41 to 50 - Year-over-year growth 2025-2030 (%)

12.5 51 to 60 - Market size and forecast 2025-2030

Chart on 51 to 60 - Market size and forecast 2025-2030 ($ million)
Data Table on 51 to 60 - Market size and forecast 2025-2030 ($ million)
Chart on 51 to 60 - Year-over-year growth 2025-2030 (%)
Data Table on 51 to 60 - Year-over-year growth 2025-2030 (%)

12.6 61 to 70 - Market size and forecast 2025-2030

Chart on 61 to 70 - Market size and forecast 2025-2030 ($ million)
Data Table on 61 to 70 - Market size and forecast 2025-2030 ($ million)
Chart on 61 to 70 - Year-over-year growth 2025-2030 (%)
Data Table on 61 to 70 - Year-over-year growth 2025-2030 (%)

12.7 70 and above - Market size and forecast 2025-2030

Chart on 70 and above - Market size and forecast 2025-2030 ($ million)
Data Table on 70 and above - Market size and forecast 2025-2030 ($ million)
Chart on 70 and above - Year-over-year growth 2025-2030 (%)
Data Table on 70 and above - Year-over-year growth 2025-2030 (%)

12.8 Market opportunity by Measurement

Market opportunity by Measurement ($ million)
Data Table on Market opportunity by Measurement ($ million)

13. Customer Landscape

13.1 Customer landscape overview

Analysis of price sensitivity, lifecycle, customer purchase basket, adoption rates, and purchase criteria

14. Geographic Landscape

14.1 Geographic segmentation

Chart on Market share by geography 2025-2030 (%)
Data Table on Market share by geography 2025-2030 (%)

14.2 Geographic comparison

Chart on Geographic comparison
Data Table on Geographic comparison

14.3 APAC - Market size and forecast 2025-2030

Chart on APAC - Market size and forecast 2025-2030 ($ million)
Data Table on APAC - Market size and forecast 2025-2030 ($ million)
Chart on APAC - Year-over-year growth 2025-2030 (%)
Data Table on APAC - Year-over-year growth 2025-2030 (%)
Chart on Regional Comparison - APAC
Data Table on Regional Comparison - APAC

14.3.1 China - Market size and forecast 2025-2030

Chart on China - Market size and forecast 2025-2030 ($ million)
Data Table on China - Market size and forecast 2025-2030 ($ million)
Chart on China - Year-over-year growth 2025-2030 (%)
Data Table on China - Year-over-year growth 2025-2030 (%)

14.3.2 Japan - Market size and forecast 2025-2030

Chart on Japan - Market size and forecast 2025-2030 ($ million)
Data Table on Japan - Market size and forecast 2025-2030 ($ million)
Chart on Japan - Year-over-year growth 2025-2030 (%)
Data Table on Japan - Year-over-year growth 2025-2030 (%)

14.3.3 India - Market size and forecast 2025-2030

Chart on India - Market size and forecast 2025-2030 ($ million)
Data Table on India - Market size and forecast 2025-2030 ($ million)
Chart on India - Year-over-year growth 2025-2030 (%)
Data Table on India - Year-over-year growth 2025-2030 (%)

14.3.4 South Korea - Market size and forecast 2025-2030

Chart on South Korea - Market size and forecast 2025-2030 ($ million)
Data Table on South Korea - Market size and forecast 2025-2030 ($ million)
Chart on South Korea - Year-over-year growth 2025-2030 (%)
Data Table on South Korea - Year-over-year growth 2025-2030 (%)

14.3.5 Australia - Market size and forecast 2025-2030

Chart on Australia - Market size and forecast 2025-2030 ($ million)
Data Table on Australia - Market size and forecast 2025-2030 ($ million)
Chart on Australia - Year-over-year growth 2025-2030 (%)
Data Table on Australia - Year-over-year growth 2025-2030 (%)

14.3.6 Indonesia - Market size and forecast 2025-2030

Chart on Indonesia - Market size and forecast 2025-2030 ($ million)
Data Table on Indonesia - Market size and forecast 2025-2030 ($ million)
Chart on Indonesia - Year-over-year growth 2025-2030 (%)
Data Table on Indonesia - Year-over-year growth 2025-2030 (%)

14.4 Europe - Market size and forecast 2025-2030

Chart on Europe - Market size and forecast 2025-2030 ($ million)
Data Table on Europe - Market size and forecast 2025-2030 ($ million)
Chart on Europe - Year-over-year growth 2025-2030 (%)
Data Table on Europe - Year-over-year growth 2025-2030 (%)
Chart on Regional Comparison - Europe
Data Table on Regional Comparison - Europe

14.4.1 Germany - Market size and forecast 2025-2030

Chart on Germany - Market size and forecast 2025-2030 ($ million)
Data Table on Germany - Market size and forecast 2025-2030 ($ million)
Chart on Germany - Year-over-year growth 2025-2030 (%)
Data Table on Germany - Year-over-year growth 2025-2030 (%)

14.4.2 UK - Market size and forecast 2025-2030

Chart on UK - Market size and forecast 2025-2030 ($ million)
Data Table on UK - Market size and forecast 2025-2030 ($ million)
Chart on UK - Year-over-year growth 2025-2030 (%)
Data Table on UK - Year-over-year growth 2025-2030 (%)

14.4.3 France - Market size and forecast 2025-2030

Chart on France - Market size and forecast 2025-2030 ($ million)
Data Table on France - Market size and forecast 2025-2030 ($ million)
Chart on France - Year-over-year growth 2025-2030 (%)
Data Table on France - Year-over-year growth 2025-2030 (%)

14.4.4 Italy - Market size and forecast 2025-2030

Chart on Italy - Market size and forecast 2025-2030 ($ million)
Data Table on Italy - Market size and forecast 2025-2030 ($ million)
Chart on Italy - Year-over-year growth 2025-2030 (%)
Data Table on Italy - Year-over-year growth 2025-2030 (%)

14.4.5 Spain - Market size and forecast 2025-2030

Chart on Spain - Market size and forecast 2025-2030 ($ million)
Data Table on Spain - Market size and forecast 2025-2030 ($ million)
Chart on Spain - Year-over-year growth 2025-2030 (%)
Data Table on Spain - Year-over-year growth 2025-2030 (%)

14.4.6 The Netherlands - Market size and forecast 2025-2030

Chart on The Netherlands - Market size and forecast 2025-2030 ($ million)
Data Table on The Netherlands - Market size and forecast 2025-2030 ($ million)
Chart on The Netherlands - Year-over-year growth 2025-2030 (%)
Data Table on The Netherlands - Year-over-year growth 2025-2030 (%)

14.5 North America - Market size and forecast 2025-2030

Chart on North America - Market size and forecast 2025-2030 ($ million)
Data Table on North America - Market size and forecast 2025-2030 ($ million)
Chart on North America - Year-over-year growth 2025-2030 (%)
Data Table on North America - Year-over-year growth 2025-2030 (%)
Chart on Regional Comparison - North America
Data Table on Regional Comparison - North America

14.5.1 US - Market size and forecast 2025-2030

Chart on US - Market size and forecast 2025-2030 ($ million)
Data Table on US - Market size and forecast 2025-2030 ($ million)
Chart on US - Year-over-year growth 2025-2030 (%)
Data Table on US - Year-over-year growth 2025-2030 (%)

14.5.2 Canada - Market size and forecast 2025-2030

Chart on Canada - Market size and forecast 2025-2030 ($ million)
Data Table on Canada - Market size and forecast 2025-2030 ($ million)
Chart on Canada - Year-over-year growth 2025-2030 (%)
Data Table on Canada - Year-over-year growth 2025-2030 (%)

14.5.3 Mexico - Market size and forecast 2025-2030

Chart on Mexico - Market size and forecast 2025-2030 ($ million)
Data Table on Mexico - Market size and forecast 2025-2030 ($ million)
Chart on Mexico - Year-over-year growth 2025-2030 (%)
Data Table on Mexico - Year-over-year growth 2025-2030 (%)

14.6 South America - Market size and forecast 2025-2030

Chart on South America - Market size and forecast 2025-2030 ($ million)
Data Table on South America - Market size and forecast 2025-2030 ($ million)
Chart on South America - Year-over-year growth 2025-2030 (%)
Data Table on South America - Year-over-year growth 2025-2030 (%)
Chart on Regional Comparison - South America
Data Table on Regional Comparison - South America

14.6.1 Brazil - Market size and forecast 2025-2030

Chart on Brazil - Market size and forecast 2025-2030 ($ million)
Data Table on Brazil - Market size and forecast 2025-2030 ($ million)
Chart on Brazil - Year-over-year growth 2025-2030 (%)
Data Table on Brazil - Year-over-year growth 2025-2030 (%)

14.6.2 Argentina - Market size and forecast 2025-2030

Chart on Argentina - Market size and forecast 2025-2030 ($ million)
Data Table on Argentina - Market size and forecast 2025-2030 ($ million)
Chart on Argentina - Year-over-year growth 2025-2030 (%)
Data Table on Argentina - Year-over-year growth 2025-2030 (%)

14.6.3 Chile - Market size and forecast 2025-2030

Chart on Chile - Market size and forecast 2025-2030 ($ million)
Data Table on Chile - Market size and forecast 2025-2030 ($ million)
Chart on Chile - Year-over-year growth 2025-2030 (%)
Data Table on Chile - Year-over-year growth 2025-2030 (%)

14.7 Middle East and Africa - Market size and forecast 2025-2030

Chart on Middle East and Africa - Market size and forecast 2025-2030 ($ million)
Data Table on Middle East and Africa - Market size and forecast 2025-2030 ($ million)
Chart on Middle East and Africa - Year-over-year growth 2025-2030 (%)
Data Table on Middle East and Africa - Year-over-year growth 2025-2030 (%)
Chart on Regional Comparison - Middle East and Africa
Data Table on Regional Comparison - Middle East and Africa

14.7.1 South Africa - Market size and forecast 2025-2030

Chart on South Africa - Market size and forecast 2025-2030 ($ million)
Data Table on South Africa - Market size and forecast 2025-2030 ($ million)
Chart on South Africa - Year-over-year growth 2025-2030 (%)
Data Table on South Africa - Year-over-year growth 2025-2030 (%)

14.7.2 UAE - Market size and forecast 2025-2030

Chart on UAE - Market size and forecast 2025-2030 ($ million)
Data Table on UAE - Market size and forecast 2025-2030 ($ million)
Chart on UAE - Year-over-year growth 2025-2030 (%)
Data Table on UAE - Year-over-year growth 2025-2030 (%)

14.7.3 Saudi Arabia - Market size and forecast 2025-2030

Chart on Saudi Arabia - Market size and forecast 2025-2030 ($ million)
Data Table on Saudi Arabia - Market size and forecast 2025-2030 ($ million)
Chart on Saudi Arabia - Year-over-year growth 2025-2030 (%)
Data Table on Saudi Arabia - Year-over-year growth 2025-2030 (%)

14.7.4 Turkey - Market size and forecast 2025-2030

Chart on Turkey - Market size and forecast 2025-2030 ($ million)
Data Table on Turkey - Market size and forecast 2025-2030 ($ million)
Chart on Turkey - Year-over-year growth 2025-2030 (%)
Data Table on Turkey - Year-over-year growth 2025-2030 (%)

14.7.5 Egypt - Market size and forecast 2025-2030

Chart on Egypt - Market size and forecast 2025-2030 ($ million)
Data Table on Egypt - Market size and forecast 2025-2030 ($ million)
Chart on Egypt - Year-over-year growth 2025-2030 (%)
Data Table on Egypt - Year-over-year growth 2025-2030 (%)

14.8 Market opportunity by geography

Market opportunity by geography ($ million)
Data Tables on Market opportunity by geography ($ million)

15. Drivers, Challenges, and Opportunity

15.1 Market drivers

Integration of industrial automation and predictive maintenance systems
Expansion of renewable energy infrastructure
Advancement in automotive electrification and lightweighting

15.2 Market challenges

Supply chain instability and raw material cost inflation
Shortage of skilled labor and technical proficiency gap
Increasing regulatory compliance and sustainability mandates

15.3 Impact of drivers and challenges

Impact of drivers and challenges in 2025 and 2030

15.4 Market opportunities

Digitalization and integration of smart bearing technologies
Advancement in circular economy and sustainability initiatives
Regionalization of supply chains for resilience and security

16. Competitive Landscape

16.1 Overview

16.2

Overview on criticality of inputs and factors of differentiation

16.3 Landscape disruption

Overview on factors of disruption

16.4 Industry risks

Impact of key risks on business

17. Competitive Analysis

17.1 Companies profiled

Companies covered

17.2 Company ranking index

17.3 Market positioning of companies

Matrix on companies position and classification

17.4 C and U Americas

C and U Americas - Overview
C and U Americas - Product / Service
C and U Americas - Key offerings
SWOT

17.5 Daido Metal Co Ltd

Daido Metal Co Ltd - Overview
Daido Metal Co Ltd - Business segments
Daido Metal Co Ltd - Key offerings
Daido Metal Co Ltd - Segment focus
SWOT

17.6 Fersa Bearings SA

Fersa Bearings SA - Overview
Fersa Bearings SA - Product / Service
Fersa Bearings SA - Key offerings
SWOT

17.7 GGB Bearing Technology

GGB Bearing Technology - Overview
GGB Bearing Technology - Product / Service
GGB Bearing Technology - Key offerings
SWOT

17.8 GMN Paul GmbH and Co. KG

GMN Paul GmbH and Co. KG - Overview
GMN Paul GmbH and Co. KG - Product / Service
GMN Paul GmbH and Co. KG - Key offerings
SWOT

17.9 JTEKT Corp.

JTEKT Corp. - Overview
JTEKT Corp. - Business segments
JTEKT Corp. - Key offerings
JTEKT Corp. - Segment focus
SWOT

17.10 Kaydon Bearings

Kaydon Bearings - Overview
Kaydon Bearings - Product / Service
Kaydon Bearings - Key offerings
SWOT

17.11 MinebeaMitsumi Inc.

MinebeaMitsumi Inc. - Overview
MinebeaMitsumi Inc. - Business segments
MinebeaMitsumi Inc. - Key offerings
MinebeaMitsumi Inc. - Segment focus
SWOT

17.12 Nachi Fujikoshi Corp.

Nachi Fujikoshi Corp. - Overview
Nachi Fujikoshi Corp. - Business segments
Nachi Fujikoshi Corp. - Key offerings
Nachi Fujikoshi Corp. - Segment focus
SWOT

17.13 NKE Austria GmbH

NKE Austria GmbH - Overview
NKE Austria GmbH - Product / Service
NKE Austria GmbH - Key offerings
SWOT

17.14 RBC Bearings Inc.

RBC Bearings Inc. - Overview
RBC Bearings Inc. - Business segments
RBC Bearings Inc. - Key offerings
RBC Bearings Inc. - Segment focus
SWOT

17.15 Regal Rexnord Corp.

Regal Rexnord Corp. - Overview
Regal Rexnord Corp. - Business segments
Regal Rexnord Corp. - Key offerings
Regal Rexnord Corp. - Segment focus
SWOT

17.16 Schaeffler AG

Schaeffler AG - Overview
Schaeffler AG - Business segments
Schaeffler AG - Key offerings
Schaeffler AG - Segment focus
SWOT

17.17 The Timken Co.

The Timken Co. - Overview
The Timken Co. - Business segments
The Timken Co. - Key offerings
The Timken Co. - Segment focus
SWOT

17.18 THK Co. Ltd.

THK Co. Ltd. - Overview
THK Co. Ltd. - Business segments
THK Co. Ltd. - Key offerings
THK Co. Ltd. - Segment focus
SWOT

18. Appendix

18.1 Scope of the report

Market definition
Objectives
Notes and caveats

18.2 Inclusions and exclusions checklist

Inclusions checklist
Exclusions checklist

18.3 Currency conversion rates for US$

18.4 Research methodology

18.5 Data procurement

Information sources

18.6 Data validation

18.7 Validation techniques employed for market sizing

18.8 Data synthesis

18.9 360 degree market analysis

18.10 List of abbreviations

Research Methodology

Technavio presents a detailed picture of the market by way of study, synthesis, and summation of data from multiple sources. The analysts have presented the various facets of the market with a particular focus on identifying the key industry influencers. The data thus presented is comprehensive, reliable, and the result of extensive research, both primary and secondary.

INFORMATION SOURCES

Primary sources

  • Manufacturers and suppliers
  • Channel partners
  • Industry experts
  • Strategic decision makers

Secondary sources

  • Industry journals and periodicals
  • Government data
  • Financial reports of key industry players
  • Historical data
  • Press releases

DATA ANALYSIS

Data Synthesis

  • Collation of data
  • Estimation of key figures
  • Analysis of derived insights

Data Validation

  • Triangulation with data models
  • Reference against proprietary databases
  • Corroboration with industry experts

REPORT WRITING

Qualitative

  • Market drivers
  • Market challenges
  • Market trends
  • Five forces analysis

Quantitative

  • Market size and forecast
  • Market segmentation
  • Geographical insights
  • Competitive landscape

Interested in this report?

Get your sample now to see our research methodology and insights!

Download Now

Frequently Asked Questions

Bearings market growth will increase by USD 17898.1 million during 2026-2030.

The Bearings market is expected to grow at a CAGR of 3.4% during 2026-2030.

Bearings market is segmented by Product (Anti-friction bearings, Magnetic bearings, Others) End-user (Automotive industry, Heavy industry, ARS industry, Others) Type (Mounted bearing, Unmounted bearing) Distribution channel (OEM, Aftermarket) Measurement (30 to 40, 41 to 50, 51 to 60, 61 to 70, 70 and above)

C and U Americas, Daido Metal Co Ltd, Fersa Bearings SA, GGB Bearing Technology, GMN Paul GmbH and Co. KG, GRW Bearing GmbH, JTEKT Corp., Kaydon Bearings, LYC Bearing Corp., MinebeaMitsumi Inc., Nachi Fujikoshi Corp., NKE Austria GmbH, NSK Ltd., NTN Corp., RBC Bearings Inc., Regal Rexnord Corp., Schaeffler AG, SKF AB, The Timken Co., THK Co. Ltd. are a few of the key vendors in the Bearings market.

APAC will register the highest growth rate of 39.8% among the other regions. Therefore, the Bearings market in APAC is expected to garner significant business opportunities for the vendors during the forecast period.

China, Japan, India, South Korea, Australia, Indonesia, Germany, UK, France, Italy, Spain, The Netherlands, US, Canada, Mexico, Brazil, Argentina, Chile, South Africa, UAE, Saudi Arabia, Turkey, Egypt

  • Integration of industrial automation and predictive maintenance systems is the driving factor this market.

The Bearings market vendors should focus on grabbing business opportunities from the Product segment as it accounted for the largest market share in the base year.
RIA - Research AI Assistant
Ask RIA