Bioremediation Market Size 2024-2028
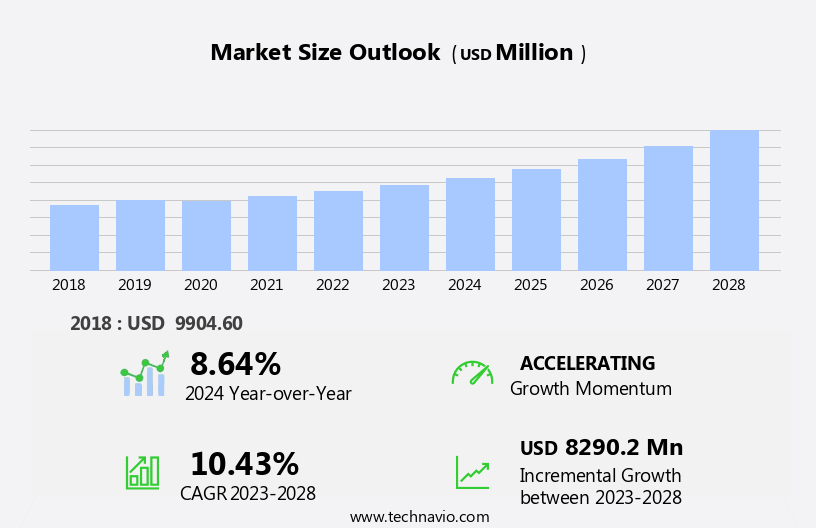
The bioremediation market size is forecast to increase by USD 8.29 billion at a CAGR of 10.43% between 2023 and 2028.
What will be the Size of the Bioremediation Market during the forecast period?
How is this Bioremediation Industry segmented?
The bioremediation industry research report provides comprehensive data (region-wise segment analysis), with forecasts and estimates in "USD million" for the period 2024-2028, as well as historical data from 2018-2022 for the following segments.
- Type
- In situ
- Ex situ
- Service
- Soil remediation
- Wastewater remediation
- Oilfield remediation
- Geography
- North America
- Canada
- US
- Europe
- Germany
- UK
- APAC
- China
- Middle East and Africa
- South America
- North America
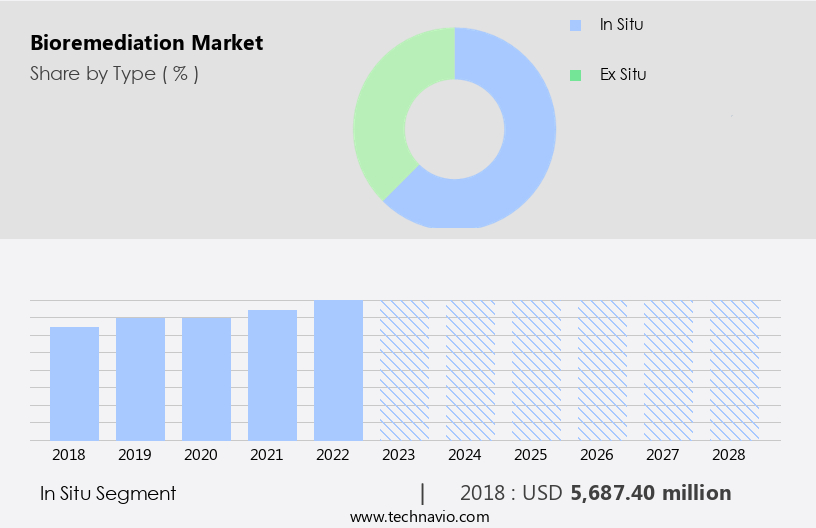
By Type Insights
The in situ segment is estimated to witness significant growth during the forecast period.Bioremediation is a process that utilizes biological agents to degrade or detoxify contaminants in contaminated areas, including public spaces, homes, and industrially developed sites. This in-situ technique, which involves treating contaminated soil or groundwater in its original location without excavation or removal, employs methods such as bioaugmentation, biostimulation, biosparging, and bioventing. Bioventing enhances local bacteria activity for bioremediation by carefully stimulating airflow and supplying oxygen to the unsaturated zone, while adding nutrients and moisture to the environment. Contaminants undergo microbial change and become harmless through this process. Bioremediation services address various contamination-related issues, including water pollution, soil contamination from metals like lead and mercury, toxic chemicals, and potential contaminations from medical waste.
By promoting in-situ aerobic biological activity through pressurized air or gas injection, bioremediation offers a versatile, efficient, and low-energy footprint solution for contaminant removal. Government agencies and public health organizations, including the Superfund program, provide funding opportunities for bioremediation initiatives to mitigate the risk of contamination, negative health consequences, and potential congenital abnormalities, cancer, and high mortality rates.
Get a glance at the market report of share of various segments Request Free Sample
The In situ segment was valued at USD 5.69 billion in 2018 and showed a gradual increase during the forecast period.
Regional Analysis
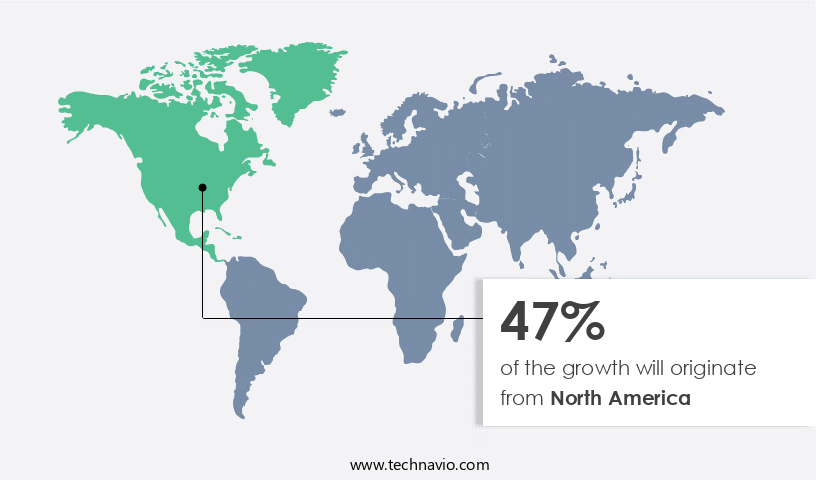
North America is estimated to contribute 47% to the growth of the global market during the forecast period.Technavio’s analysts have elaborately explained the regional trends and drivers that shape the market during the forecast period.
For more insights on the market size of various regions, Request Free Sample
The market in North America is experiencing notable expansion, with the US and Canada being key contributors to its revenue growth. This market expansion is driven by heightened environmental awareness, increasing government initiatives, and the adoption of sustainable practices. Strict environmental regulations and policies, such as those set by the US Environmental Protection Agency (EPA) and various state-level agencies, necessitate pollution cleanup and impose requirements on industries and responsible parties. These regulations foster demand for bioremediation technologies and services, enabling companies to comply with environmental standards. Bioremediation offers several advantages over traditional physical and chemical methods, including a lower energy footprint, versatility, and efficient contaminant removal.
The market encompasses the remediation of contaminated areas in public spaces, homes, and industries, addressing potential contaminations from metals, lead, mercury, heavy metals, toxic chemicals, and other pollutants. Bioremediation plays a crucial role In the restoration of contamination sites, mitigating risks of contamination, and protecting public health from negative health consequences, including congenital abnormalities, cancer, and low birth weights.
Market Dynamics
Our researchers analyzed the data with 2023 as the base year, along with the key drivers, trends, and challenges. A holistic analysis of drivers will help companies refine their marketing strategies to gain a competitive advantage.
What are the key market drivers leading to the rise In the adoption of Bioremediation Industry?
- Several benefits associated with bioremediation solutions is the key driver of the market.
- Bioremediation solutions offer several advantages, making them an increasingly popular choice for pollution control and site remediation. These benefits include environmental sustainability and cost-effectiveness. Bioremediation is an environmentally sustainable approach as it utilizes natural processes and biological agents to degrade or transform contaminants, minimizing the need for invasive methods. The emphasis on environmental sustainability has fueled the demand for bioremediation solutions. Additionally, bioremediation can be more cost-effective than traditional methods due to lower equipment and labor costs, shorter project durations, and reduced transportation and disposal expenses. These factors contribute to the growing adoption of bioremediation solutions.
What are the market trends shaping the Bioremediation Industry?
- Increasing government initiatives and funding support in bioremediation is the upcoming market trend.
- Bioremediation is a critical area of research and development for governments worldwide, with funding allocated to advance technologies and processes. These investments support scientific studies, foster innovation, and improve existing bioremediation methods. The Environmental Protection Agency (EPA) In the US is a key player in upholding environmental laws and regulations. Globally, similar organizations exist to ensure compliance with environmental legislation and protect public health. For instance, the EiCLaR project was launched in January 2021. Research and development funding enables the creation of new bioremediation technologies, enhancements to existing methods, and exploration of new applications. This commitment to innovation contributes significantly to the growth and effectiveness of the bioremediation industry.
What challenges does the Bioremediation Industry face during its growth?
- Site-specific challenges associated with bioremediation is a key challenge affecting the industry growth.
- The market encounters significant site-specific challenges due to the unique characteristics and complexities of contaminated sites. Each location presents distinct contaminants with varying chemical compositions, concentrations, and persistence. Some contaminants may be resistant to biodegradation or possess specific properties that hinder their removal. The geology and hydrogeology of a site significantly impact the movement and distribution of contaminants. Soil type, permeability, porosity, and groundwater flow patterns are crucial factors that influence the efficacy of bioremediation. Thorough site characterization is essential to identify the most suitable bioremediation approach and design, taking into account the site-specific parameters.
Exclusive Customer Landscape
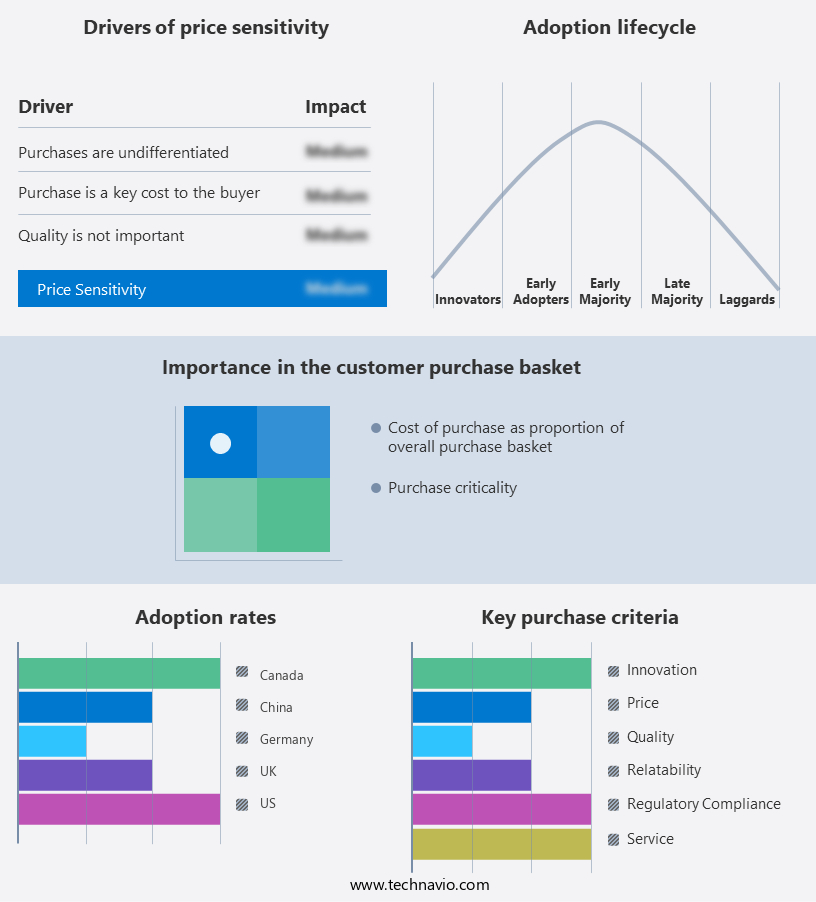
The bioremediation market forecasting report includes the adoption lifecycle of the market, covering from the innovator’s stage to the laggard’s stage. It focuses on adoption rates in different regions based on penetration. Furthermore, the bioremediation market report also includes key purchase criteria and drivers of price sensitivity to help companies evaluate and develop their market growth analysis strategies.
Customer Landscape
Key Companies & Market Insights
Companies are implementing various strategies, such as strategic alliances, bioremediation market forecast, partnerships, mergers and acquisitions, geographical expansion, and product/service launches, to enhance their presence In the industry.
Altogen labs - The company specializes in providing contract research services, focusing on bioremediation studies and testing. Our expertise lies in utilizing advanced techniques to address environmental contamination issues, ensuring regulatory compliance and promoting sustainable solutions. We prioritize accuracy, efficiency, and innovation in our research methodologies, delivering valuable insights to clients In the environmental sector.
The industry research and growth report includes detailed analyses of the competitive landscape of the market and information about key companies, including:
- Altogen labs
- BioPetroClean
- Carus Group Inc.
- Drylet Inc.
- Envirogen Group UK Ltd.
- Geovation Engineering P.C.
- Ivey International Inc.
- JRW Bioremediation LLC
- Kankyo Group
- OSEI Corp.
- REGENESIS
- RNAS Remediation Products
- Sarva Bio Remed LLC
- Shandong Sukahan Bio Technology Co. Ltd.
- Sumas Remediation Services Inc.
- The BioSolve Co.
- The ServiceMaster Co. LLC
Qualitative and quantitative analysis of companies has been conducted to help clients understand the wider business environment as well as the strengths and weaknesses of key industry players. Data is qualitatively analyzed to categorize companies as pure play, category-focused, industry-focused, and diversified; it is quantitatively analyzed to categorize companies as dominant, leading, strong, tentative, and weak.
Research Analyst Overview
Bioremediation: A Sustainable Solution for Contaminated Areas and Public Spaces Bioremediation, a process that utilizes naturally occurring microorganisms to break down and eliminate contaminants, has emerged as a viable and sustainable alternative to traditional physical and chemical methods for addressing contaminated areas and public spaces. This process is particularly relevant in industrially developed regions where potential contaminations pose risks to both the environment and public health. Contaminated areas and public spaces, including homes, offices, and public facilities, can harbor various contaminants such as toxic chemicals, heavy metals, and industrial pollutants. These contaminants can lead to negative health consequences, including congenital abnormalities, cancer, and high mortality rates.
Water and soil contamination are common issues, with sources including medical waste and industrial processes. Bioremediation offers several advantages over traditional methods for addressing contaminated areas. First and foremost, it is a biological process that utilizes naturally occurring microorganisms to remove contaminants. This approach is more versatile and efficient than traditional methods, which can be expensive and often require the use of oxidizing agents or other chemicals. Moreover, bioremediation has a low energy footprint and is less likely to produce secondary contaminants or mutations, as can occur with the use of certain chemicals. This makes it an attractive option for addressing contamination-related issues in a sustainable and environmentally friendly manner.
The bioremediation industry has seen significant growth in recent years, driven by increasing awareness of the negative health consequences of contamination and the need for cost-effective and sustainable solutions. Government agencies and public health organizations have also played a role in promoting the use of bioremediation through funding opportunities and initiatives such as the Superfund program, which focuses on cleaning up the most contaminated sites. Despite its advantages, bioremediation is not a one-size-fits-all solution. The effectiveness of the process depends on several factors, including the concentrations of contaminants, the specific microorganisms used, and the conditions under which the remediation takes place.
Additionally, proper safety measures, such as the use of PPE and disposal protocols, are essential to ensure the safety of those involved In the remediation process. In conclusion, bioremediation offers a sustainable and efficient solution for addressing contaminated areas and public spaces. This process utilizes naturally occurring microorganisms to break down and eliminate contaminants, making it a cost-effective and environmentally friendly alternative to traditional physical and chemical methods. As awareness of the negative health consequences of contamination continues to grow, the bioremediation industry is poised for continued growth and innovation.
|
Market Scope |
|
|
Report Coverage |
Details |
|
Page number |
161 |
|
Base year |
2023 |
|
Historic period |
2018-2022 |
|
Forecast period |
2024-2028 |
|
Growth momentum & CAGR |
Accelerate at a CAGR of 10.43% |
|
Market growth 2024-2028 |
USD 8290.2 million |
|
Market structure |
Fragmented |
|
YoY growth 2023-2024(%) |
8.64 |
|
Key countries |
US, Germany, UK, China, and Canada |
|
Competitive landscape |
Leading Companies, Market Positioning of Companies, Competitive Strategies, and Industry Risks |
What are the Key Data Covered in this Bioremediation Market Research and Growth Report?
- CAGR of the Bioremediation industry during the forecast period
- Detailed information on factors that will drive the growth and forecasting between 2024 and 2028
- Precise estimation of the size of the market and its contribution of the industry in focus to the parent market
- Accurate predictions about upcoming growth and trends and changes in consumer behaviour
- Growth of the market across North America, Europe, APAC, Middle East and Africa, and South America
- Thorough analysis of the market’s competitive landscape and detailed information about companies
- Comprehensive analysis of factors that will challenge the bioremediation market growth of industry companies
We can help! Our analysts can customize this bioremediation market research report to meet your requirements.
 RIA -
RIA - 
