Biosurfactants Market Analysis, Size, and Forecast 2026-2030: Europe (Germany, UK, and France), North America (US, Canada, and Mexico), APAC (China, Japan, and India), Middle East and Africa (Saudi Arabia, UAE, and South Africa), South America (Brazil and Argentina), and Rest of World (ROW)

Biosurfactants Market Analysis, Size, and Forecast 2026-2030:
Europe (Germany, UK, and France), North America (US, Canada, and Mexico), APAC (China, Japan, and India), Middle East and Africa (Saudi Arabia, UAE, and South Africa), South America (Brazil and Argentina), and Rest of World (ROW)

Published: Apr 2026 316 Pages SKU: IRTNTR44099

Market Overview at a Glance

$4.23 B
Market Opportunity
5.8%
CAGR 2025 - 2030
51.5%
Europe Growth
$6.40 B
Detergents segment 2024

Biosurfactants Market Size 2026-2030

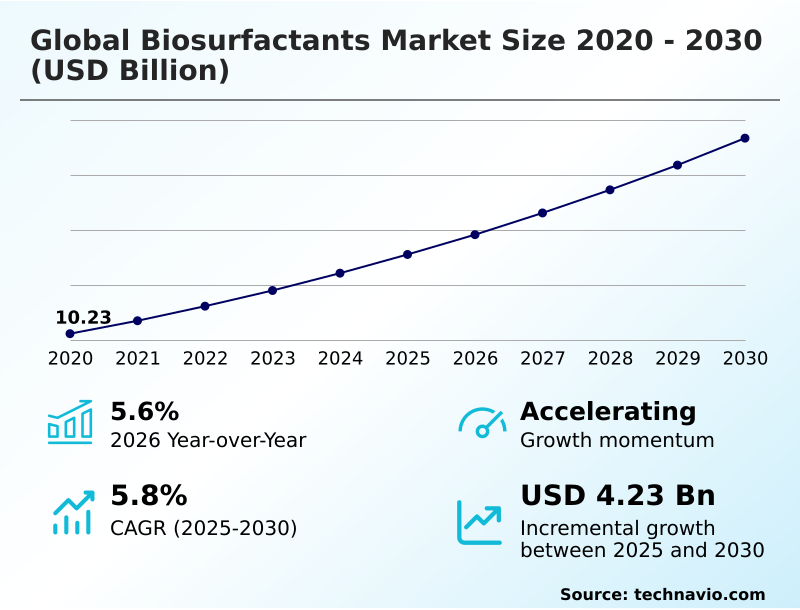
The biosurfactants market size is valued to increase by USD 4.23 billion, at a CAGR of 5.8% from 2025 to 2030. Heightened regulatory pressure and environmental mandates will drive the biosurfactants market.

Major Market Trends & Insights

  • Europe dominated the market and accounted for a 51.5% growth during the forecast period.
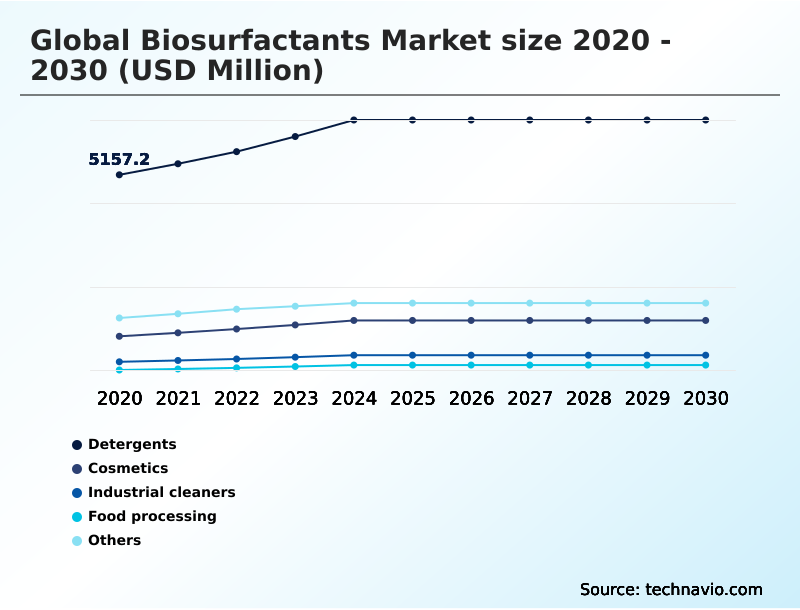
  • By Application - Detergents segment was valued at USD 6.40 billion in 2024
  • By Type - Glycolipids segment accounted for the largest market revenue share in 2024

Market Size & Forecast

  • Market Opportunities: USD 7.11 billion
  • Market Future Opportunities: USD 4.23 billion
  • CAGR from 2025 to 2030 : 5.8%

Market Summary

  • The biosurfactants market is advancing as industries prioritize sustainability and green chemistry principles. These microbially-produced compounds offer a compelling alternative to synthetic surfactants, characterized by high biodegradability, low toxicity, and production from renewable sources, including circular economy feedstocks. Demand is driven by stringent environmental regulations and a consumer shift toward natural ingredients, particularly in personal care and household cleaning.
  • A key business scenario involves detergent manufacturers reformulating products to meet eco-label standards, replacing petroleum-derived chemicals with biosurfactants to enhance product safety and appeal to environmentally conscious consumers. While high production costs remain a challenge, ongoing advancements in biotechnology are improving yields and reducing expenses.
  • The market's evolution is marked by a transition from niche applications to mainstream adoption, supported by the development of cost-effective manufacturing and a stable supply chain for these versatile, high-performance biological agents.

What will be the Size of the Biosurfactants Market during the forecast period?

Get Key Insights on Market Forecast (PDF) Request Free Sample

How is the Biosurfactants Market Segmented?

The biosurfactants industry research report provides comprehensive data (region-wise segment analysis), with forecasts and estimates in "USD million" for the period 2026-2030, as well as historical data from 2020-2024 for the following segments.

  • Application
    • Detergents
    • Cosmetics
    • Industrial cleaners
    • Food processing
    • Others
  • Type
    • Glycolipids
    • Lipopeptides and lipoproteins
    • Surfactin
    • Others
  • Source
    • Bacterial
    • Fungal
    • Others
  • Geography
    • Europe
      • Germany
      • UK
      • France
    • North America
      • US
      • Canada
      • Mexico
    • APAC
      • China
      • Japan
      • India
    • Middle East and Africa
      • Saudi Arabia
      • UAE
      • South Africa
    • South America
      • Brazil
      • Argentina
    • Rest of World (ROW)

By Application Insights

The detergents segment is estimated to witness significant growth during the forecast period.

The detergents segment is a primary application area, driven by consumer and regulatory demand for eco-friendly cleaning agents and effective petroleum-based surfactant alternatives.

Formulations are evolving to prioritize sustainable detergent formulation, leveraging advanced biosurfactants to achieve superior surface tension reduction without compromising performance.

Innovations in aqueous phase behavior and interfacial tension dynamics are key to developing products with enhanced water solubility enhancement and controlled foaming capacity control.

These low-toxicity surfactants are integral to green cleaning products, with detergents accounting for over 55% of market consumption, demonstrating a significant shift away from traditional chemical agents in the household and industrial cleaning sectors.

Request Free Sample

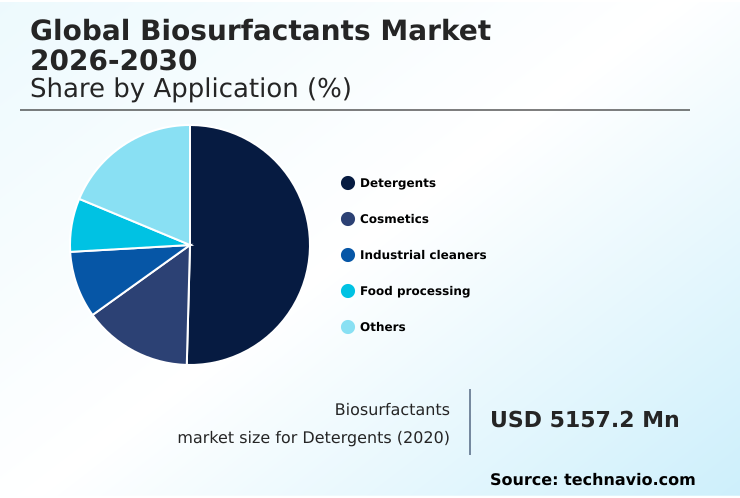
The Detergents segment was valued at USD 6.40 billion in 2024 and showed a gradual increase during the forecast period.

Request Free Sample

Regional Analysis

Europe is estimated to contribute 51.5% to the growth of the global market during the forecast period.Technavio’s analysts have elaborately explained the regional trends and drivers that shape the market during the forecast period.

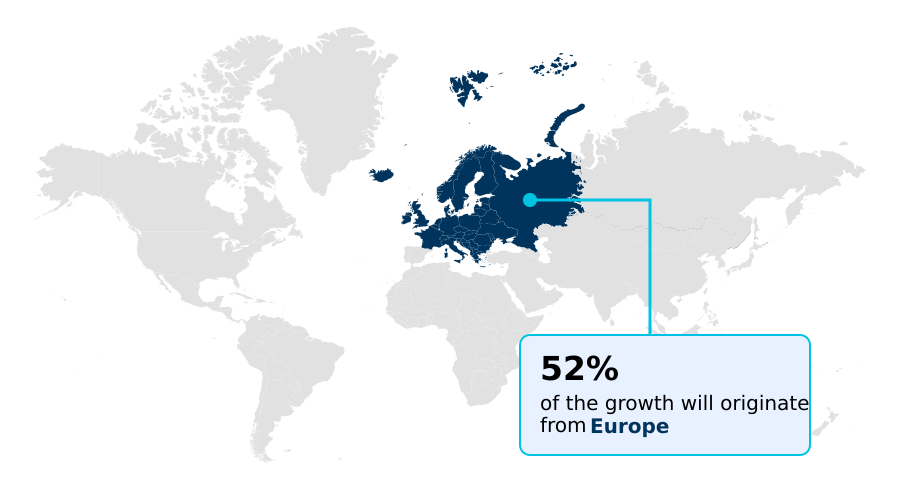
See How Biosurfactants Market Demand is Rising in Europe Request Free Sample

The geographic landscape is shifting, with APAC poised for the highest expansion at 6.8%, surpassing North America at 6.2% and Europe's 5.6% growth rate. This is driven by large-scale investments in rhamnolipid biosynthesis and sophorolipid fermentation infrastructure.

In North America, microbial enhanced oil recovery presents a significant opportunity for surface active biologics. Meanwhile, Europe's mature market continues to lead in the adoption of bio-based ingredients for cosmetics, leveraging advanced yeast derived biosurfactants and bacterial biosurfactant production techniques.

The rising use of bio-based emulsifiers and anti-biofilm agent applications in industrial processes further diversifies regional demand, highlighting a global move towards more sustainable chemical solutions.

Market Dynamics

Our researchers analyzed the data with 2025 as the base year, along with the key drivers, trends, and challenges. A holistic analysis of drivers will help companies refine their marketing strategies to gain a competitive advantage.

  • The expanding role of biosurfactants in personal care formulations is driving innovation, as brands seek safer, nature-derived ingredients to meet consumer demand. Concurrently, the use of rhamnolipids for agricultural soil remediation is gaining traction, demonstrating how biosurfactants can improve crop yield with biosurfactants by enhancing nutrient availability.
  • In the energy sector, microbial enhanced oil recovery applications are becoming more viable, showcasing the effectiveness of these compounds in harsh environments. The industry-wide challenge is developing cost-effective sophorolipid production methods to compete with synthetics. Glycolipid-based food emulsifier use is growing in the food industry, alongside efforts focused on stabilizing emulsions with lipopeptide activity.
  • The role of biosurfactants in pharmaceuticals is also expanding, with research into novel drug delivery systems. The performance of biosurfactants in detergents is a key focus, particularly their effectiveness in hard water, leading to the creation of high-foaming biosurfactant products.
  • The environmental impact of biosurfactant production is being mitigated by using waste streams for biosurfactant production and scaling up biosurfactant fermentation processes, which is now 40% more efficient than legacy methods. As biosurfactant stability in industrial applications improves, their use in sectors like the biosurfactant applications in the textile industry is increasing.
  • A significant hurdle remains the regulatory approval for cosmetic biosurfactants, which is critical for market access when comparing biosurfactants and synthetic surfactants. Finally, research into biosurfactants for bioremediation of pollutants continues to open new avenues for environmental cleanup.

What are the key market drivers leading to the rise in the adoption of Biosurfactants Industry?

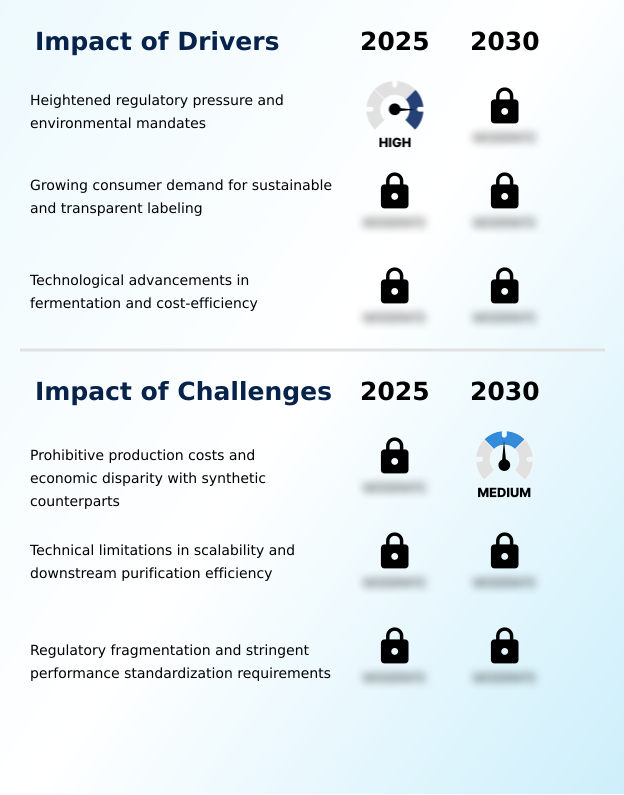
  • Heightened regulatory pressure and increasing environmental mandates are key drivers for market growth.

  • Market growth is significantly driven by the adoption of green chemistry principles and the increasing use of circular economy feedstocks.
  • Stringent regulatory compliance for bio-chemicals is compelling manufacturers to prioritize sustainable supply chain management and conduct thorough life cycle assessment of surfactants.
  • This shift leads to quantifiable benefits, such as carbon footprint reduction strategies that lower emissions by up to 50% compared to petrochemical processes. The functional versatility of microbial metabolites as agricultural adjuvants also creates new revenue streams.
  • As a result, companies are investing in technologies that not only meet environmental mandates but also provide a competitive advantage through enhanced sustainability profiles.

What are the market trends shaping the Biosurfactants Industry?

  • A key market trend is the expansion of industrial-scale fermentation processes. This involves developing specialized production facilities to meet escalating demand.

  • Key trends are centered on technological maturation, particularly in fermentation process optimization and advanced downstream processing techniques. Innovations in strain optimization are enabling higher yields and greater purity, with some processes now achieving batch-to-batch consistency improvements of over 98%. The exploration of cell-free biosurfactant synthesis and enzymatic surfactant modification is opening pathways for creating highly specialized molecules.
  • These advancements improve biodegradable surfactant properties and facilitate better fermentation substrate utilization, including waste streams. The focus on scalability of bioreactor production is crucial for generating cost-effective bio-surfactants, directly addressing historical market barriers and making these green chemicals viable for mass-market applications.

What challenges does the Biosurfactants Industry face during its growth?

  • Prohibitive production costs and the economic disparity with synthetic counterparts present a key challenge to industry growth.

  • The primary challenge remains achieving competitive functional performance of surfactants while managing costs associated with complex purification methods for biosurfactants. The intricate glycolipid structure and specific lipopeptide activity that make each amphiphilic molecule effective also complicate production. For instance, controlling the critical micelle concentration of mannosylerythritol lipids requires precise process control, contributing to costs.
  • The goal of surfactant yield improvement is often hindered by the efficiency of downstream separation, which can constitute up to 60% of total expenses. While researchers explore various plant-derived surfactant sources, scaling production to compete with established synthetics on price and volume remains a significant hurdle for the industry.

Exclusive Technavio Analysis on Customer Landscape

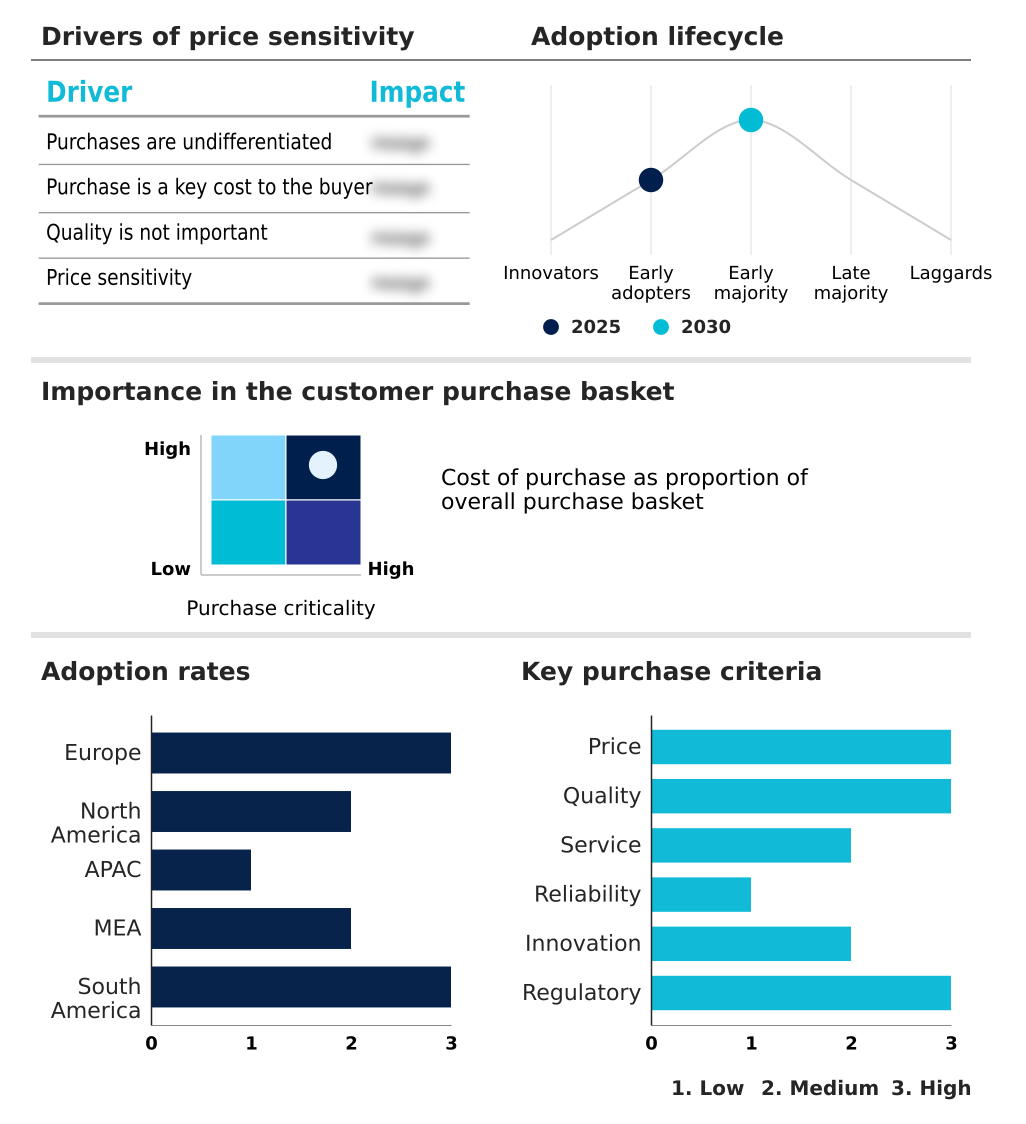
The biosurfactants market forecasting report includes the adoption lifecycle of the market, covering from the innovator’s stage to the laggard’s stage. It focuses on adoption rates in different regions based on penetration. Furthermore, the biosurfactants market report also includes key purchase criteria and drivers of price sensitivity to help companies evaluate and develop their market growth analysis strategies.

Customer Landscape of Biosurfactants Industry

Competitive Landscape

Companies are implementing various strategies, such as strategic alliances, biosurfactants market forecast, partnerships, mergers and acquisitions, geographical expansion, and product/service launches, to enhance their presence in the industry.

AGAE Technologies LLC - Delivering a portfolio of bio-based surfactants, including high-purity glycolipids and lipopeptides, for diverse industrial and consumer applications.

The industry research and growth report includes detailed analyses of the competitive landscape of the market and information about key companies, including:

  • AGAE Technologies LLC
  • BASF SE
  • Biotensidon GmbH
  • Clariant International Ltd.
  • Croda International Plc
  • Evonik Industries AG
  • Givaudan SA
  • Holiferm
  • Innospec Inc.
  • Jeneil Biotech Inc.
  • Kaneka Corp.
  • Kemin Industries Inc.
  • Lion Corp.
  • Nouryon Chemicals Holding B.V.
  • Saraya Co. Ltd.
  • Solvay SA
  • Stepan Co.
  • TeeGene Biotech Ltd.
  • TensioGreen Technology Corp.
  • Thermo Fisher Scientific Inc.

Qualitative and quantitative analysis of companies has been conducted to help clients understand the wider business environment as well as the strengths and weaknesses of key industry players. Data is qualitatively analyzed to categorize companies as pure play, category-focused, industry-focused, and diversified; it is quantitatively analyzed to categorize companies as dominant, leading, strong, tentative, and weak.

Recent Development and News in Biosurfactants market

  • In May 2025, Evonik Industries AG outlined plans to boost core profit by $1.2 billion by 2027, with a strategic emphasis on expanding its biosurfactant portfolio, including rhamnolipids and sophorolipids, to meet growing demand.
  • In April 2025, BASF launched new natural-based ingredients for personal care, including Dehyton PK45 GA/RA, a biodegradable betaine surfactant derived from certified coconut oil, enhancing its eco-friendly product line.
  • In February 2025, AGAE Technologies LLC inaugurated a 41,000-square-foot manufacturing plant in Asia with an annual capacity exceeding 1,000 metric tons of rhamnolipid biosurfactants to address surging global demand.
  • In December 2024, Holiferm and Indorama Ventures announced a strategic partnership to market and distribute Holiferm's biosurfactants, including rhamnolipids and sophorolipids, in South America.

Dive into Technavio’s robust research methodology, blending expert interviews, extensive data synthesis, and validated models for unparalleled Biosurfactants Market insights. See full methodology.

Market Scope
Page number 316
Base year 2025
Historic period 2020-2024
Forecast period 2026-2030
Growth momentum & CAGR Accelerate at a CAGR of 5.8%
Market growth 2026-2030 USD 4230.4 million
Market structure Fragmented
YoY growth 2025-2026(%) 5.6%
Key countries Germany, UK, France, Italy, Spain, The Netherlands, US, Canada, Mexico, China, Japan, India, South Korea, Australia, Indonesia, Saudi Arabia, UAE, South Africa, Israel, Turkey, Brazil, Argentina and Chile
Competitive landscape Leading Companies, Market Positioning of Companies, Competitive Strategies, and Industry Risks

Request Free Sample

Research Analyst Overview

  • The market's trajectory is defined by advancements in metabolic engineering and fermentation process optimization, which are crucial for enhancing the commercial viability of microbial metabolites. A key boardroom consideration is the investment in downstream processing techniques to improve the purity and yield of sophorolipid fermentation and rhamnolipid biosynthesis.
  • The unique glycolipid structure and lipopeptide activity of these compounds enable superior surface tension reduction and interfacial tension dynamics, making them ideal for microbial enhanced oil recovery and as agricultural adjuvants. The development of mannosylerythritol lipids and other surface active biologics addresses the demand for low-toxicity surfactants.
  • Understanding the aqueous phase behavior and critical micelle concentration of each amphiphilic molecule is vital for effective sustainable detergent formulation. Innovations in strain optimization, cell-free biosurfactant synthesis, and enzymatic surfactant modification are driven by green chemistry principles.
  • These bio-based emulsifiers, often derived from circular economy feedstocks, are achieving performance metrics once exclusive to synthetics, with some showing a 25% improvement in emulsion stability.

What are the Key Data Covered in this Biosurfactants Market Research and Growth Report?

  • What is the expected growth of the Biosurfactants Market between 2026 and 2030?

    • USD 4.23 billion, at a CAGR of 5.8%

  • What segmentation does the market report cover?

    • The report is segmented by Application (Detergents, Cosmetics, Industrial cleaners, Food processing, and Others), Type (Glycolipids, Lipopeptides and lipoproteins, Surfactin, and Others), Source (Bacterial, Fungal, and Others) and Geography (Europe, North America, APAC, Middle East and Africa, South America)

  • Which regions are analyzed in the report?

    • Europe, North America, APAC, Middle East and Africa and South America

  • What are the key growth drivers and market challenges?

    • Heightened regulatory pressure and environmental mandates, Prohibitive production costs and economic disparity with synthetic counterparts

  • Who are the major players in the Biosurfactants Market?

    • AGAE Technologies LLC, BASF SE, Biotensidon GmbH, Clariant International Ltd., Croda International Plc, Evonik Industries AG, Givaudan SA, Holiferm, Innospec Inc., Jeneil Biotech Inc., Kaneka Corp., Kemin Industries Inc., Lion Corp., Nouryon Chemicals Holding B.V., Saraya Co. Ltd., Solvay SA, Stepan Co., TeeGene Biotech Ltd., TensioGreen Technology Corp. and Thermo Fisher Scientific Inc.

Market Research Insights

  • Market dynamics are increasingly shaped by the adoption of sustainable supply chain management and a focus on carbon footprint reduction strategies. Companies are leveraging biodegradable surfactant properties to meet stringent regulatory compliance for bio-chemicals, with successful implementations showing a 95% reduction in aquatic ecotoxicity compared to conventional alternatives.
  • The push for cost-effective bio-surfactants is driving innovation in fermentation substrate utilization, where optimizing inputs can increase yields by over 30%. Furthermore, the life cycle assessment of surfactants is becoming a standard practice, guiding research and development toward solutions that offer superior environmental and performance benefits throughout their entire value chain.

We can help! Our analysts can customize this biosurfactants market research report to meet your requirements.

Get in touch

1. Executive Summary

1.1 Market overview

Executive Summary - Chart on Market Overview
Executive Summary - Data Table on Market Overview
Executive Summary - Chart on Global Market Characteristics
Executive Summary - Chart on Market by Geography
Executive Summary - Chart on Market Segmentation by Application
Executive Summary - Chart on Market Segmentation by Type
Executive Summary - Chart on Market Segmentation by Source
Executive Summary - Chart on Incremental Growth
Executive Summary - Data Table on Incremental Growth
Executive Summary - Chart on Company Market Positioning

2. Technavio Analysis

2.1 Analysis of price sensitivity, lifecycle, customer purchase basket, adoption rates, and purchase criteria

2.2 Criticality of inputs and Factors of differentiation

Chart on Overview on criticality of inputs and factors of differentiation

2.3 Factors of disruption

Chart on Overview on factors of disruption

2.4 Impact of drivers and challenges

Chart on Impact of drivers and challenges in 2025 and 2030

3. Market Landscape

3.1 Market ecosystem

Chart on Parent Market
Data Table on - Parent Market

3.2 Market characteristics

Chart on Market characteristics analysis

3.3 Value chain analysis

Chart on Value chain analysis

4. Market Sizing

4.1 Market definition

Data Table on Offerings of companies included in the market definition

4.2 Market segment analysis

Market segments

4.3 Market size 2025

4.4 Market outlook: Forecast for 2025-2030

Chart on Global - Market size and forecast 2025-2030 ($ million)
Data Table on Global - Market size and forecast 2025-2030 ($ million)
Chart on Global Market: Year-over-year growth 2025-2030 (%)
Data Table on Global Market: Year-over-year growth 2025-2030 (%)

5. Historic Market Size

5.1 Global Biosurfactants Market 2020 - 2024

Historic Market Size - Data Table on Global Biosurfactants Market 2020 - 2024 ($ million)

5.2 Application segment analysis 2020 - 2024

Historic Market Size - Application Segment 2020 - 2024 ($ million)

5.3 Type segment analysis 2020 - 2024

Historic Market Size - Type Segment 2020 - 2024 ($ million)

5.4 Source segment analysis 2020 - 2024

Historic Market Size - Source Segment 2020 - 2024 ($ million)

5.5 Geography segment analysis 2020 - 2024

Historic Market Size - Geography Segment 2020 - 2024 ($ million)

5.6 Country segment analysis 2020 - 2024

Historic Market Size - Country Segment 2020 - 2024 ($ million)

6. Qualitative Analysis

6.1 Impact of AI on global biosurfactants market

6.2 Impact of geopolitical conflict on global biosurfactants market

7. Five Forces Analysis

7.1 Five forces summary

Five forces analysis - Comparison between 2025 and 2030

7.2 Bargaining power of buyers

Bargaining power of buyers - Impact of key factors 2025 and 2030

7.3 Bargaining power of suppliers

Bargaining power of suppliers - Impact of key factors in 2025 and 2030

7.4 Threat of new entrants

Threat of new entrants - Impact of key factors in 2025 and 2030

7.5 Threat of substitutes

Threat of substitutes - Impact of key factors in 2025 and 2030

7.6 Threat of rivalry

Threat of rivalry - Impact of key factors in 2025 and 2030

7.7 Market condition

Chart on Market condition - Five forces 2025 and 2030

8. Market Segmentation by Application

8.1 Market segments

Chart on Application - Market share 2025-2030 (%)
Data Table on Application - Market share 2025-2030 (%)

8.2 Comparison by Application

Chart on Comparison by Application
Data Table on Comparison by Application

8.3 Detergents - Market size and forecast 2025-2030

Chart on Detergents - Market size and forecast 2025-2030 ($ million)
Data Table on Detergents - Market size and forecast 2025-2030 ($ million)
Chart on Detergents - Year-over-year growth 2025-2030 (%)
Data Table on Detergents - Year-over-year growth 2025-2030 (%)

8.4 Cosmetics - Market size and forecast 2025-2030

Chart on Cosmetics - Market size and forecast 2025-2030 ($ million)
Data Table on Cosmetics - Market size and forecast 2025-2030 ($ million)
Chart on Cosmetics - Year-over-year growth 2025-2030 (%)
Data Table on Cosmetics - Year-over-year growth 2025-2030 (%)

8.5 Industrial cleaners - Market size and forecast 2025-2030

Chart on Industrial cleaners - Market size and forecast 2025-2030 ($ million)
Data Table on Industrial cleaners - Market size and forecast 2025-2030 ($ million)
Chart on Industrial cleaners - Year-over-year growth 2025-2030 (%)
Data Table on Industrial cleaners - Year-over-year growth 2025-2030 (%)

8.6 Food processing - Market size and forecast 2025-2030

Chart on Food processing - Market size and forecast 2025-2030 ($ million)
Data Table on Food processing - Market size and forecast 2025-2030 ($ million)
Chart on Food processing - Year-over-year growth 2025-2030 (%)
Data Table on Food processing - Year-over-year growth 2025-2030 (%)

8.7 Others - Market size and forecast 2025-2030

Chart on Others - Market size and forecast 2025-2030 ($ million)
Data Table on Others - Market size and forecast 2025-2030 ($ million)
Chart on Others - Year-over-year growth 2025-2030 (%)
Data Table on Others - Year-over-year growth 2025-2030 (%)

8.8 Market opportunity by Application

Market opportunity by Application ($ million)
Data Table on Market opportunity by Application ($ million)

9. Market Segmentation by Type

9.1 Market segments

Chart on Type - Market share 2025-2030 (%)
Data Table on Type - Market share 2025-2030 (%)

9.2 Comparison by Type

Chart on Comparison by Type
Data Table on Comparison by Type

9.3 Glycolipids - Market size and forecast 2025-2030

Chart on Glycolipids - Market size and forecast 2025-2030 ($ million)
Data Table on Glycolipids - Market size and forecast 2025-2030 ($ million)
Chart on Glycolipids - Year-over-year growth 2025-2030 (%)
Data Table on Glycolipids - Year-over-year growth 2025-2030 (%)

9.4 Lipopeptides and lipoproteins - Market size and forecast 2025-2030

Chart on Lipopeptides and lipoproteins - Market size and forecast 2025-2030 ($ million)
Data Table on Lipopeptides and lipoproteins - Market size and forecast 2025-2030 ($ million)
Chart on Lipopeptides and lipoproteins - Year-over-year growth 2025-2030 (%)
Data Table on Lipopeptides and lipoproteins - Year-over-year growth 2025-2030 (%)

9.5 Surfactin - Market size and forecast 2025-2030

Chart on Surfactin - Market size and forecast 2025-2030 ($ million)
Data Table on Surfactin - Market size and forecast 2025-2030 ($ million)
Chart on Surfactin - Year-over-year growth 2025-2030 (%)
Data Table on Surfactin - Year-over-year growth 2025-2030 (%)

9.6 Others - Market size and forecast 2025-2030

Chart on Others - Market size and forecast 2025-2030 ($ million)
Data Table on Others - Market size and forecast 2025-2030 ($ million)
Chart on Others - Year-over-year growth 2025-2030 (%)
Data Table on Others - Year-over-year growth 2025-2030 (%)

9.7 Market opportunity by Type

Market opportunity by Type ($ million)
Data Table on Market opportunity by Type ($ million)

10. Market Segmentation by Source

10.1 Market segments

Chart on Source - Market share 2025-2030 (%)
Data Table on Source - Market share 2025-2030 (%)

10.2 Comparison by Source

Chart on Comparison by Source
Data Table on Comparison by Source

10.3 Bacterial - Market size and forecast 2025-2030

Chart on Bacterial - Market size and forecast 2025-2030 ($ million)
Data Table on Bacterial - Market size and forecast 2025-2030 ($ million)
Chart on Bacterial - Year-over-year growth 2025-2030 (%)
Data Table on Bacterial - Year-over-year growth 2025-2030 (%)

10.4 Fungal - Market size and forecast 2025-2030

Chart on Fungal - Market size and forecast 2025-2030 ($ million)
Data Table on Fungal - Market size and forecast 2025-2030 ($ million)
Chart on Fungal - Year-over-year growth 2025-2030 (%)
Data Table on Fungal - Year-over-year growth 2025-2030 (%)

10.5 Others - Market size and forecast 2025-2030

Chart on Others - Market size and forecast 2025-2030 ($ million)
Data Table on Others - Market size and forecast 2025-2030 ($ million)
Chart on Others - Year-over-year growth 2025-2030 (%)
Data Table on Others - Year-over-year growth 2025-2030 (%)

10.6 Market opportunity by Source

Market opportunity by Source ($ million)
Data Table on Market opportunity by Source ($ million)

11. Customer Landscape

11.1 Customer landscape overview

Analysis of price sensitivity, lifecycle, customer purchase basket, adoption rates, and purchase criteria

12. Geographic Landscape

12.1 Geographic segmentation

Chart on Market share by geography 2025-2030 (%)
Data Table on Market share by geography 2025-2030 (%)

12.2 Geographic comparison

Chart on Geographic comparison
Data Table on Geographic comparison

12.3 Europe - Market size and forecast 2025-2030

Chart on Europe - Market size and forecast 2025-2030 ($ million)
Data Table on Europe - Market size and forecast 2025-2030 ($ million)
Chart on Europe - Year-over-year growth 2025-2030 (%)
Data Table on Europe - Year-over-year growth 2025-2030 (%)
Chart on Regional Comparison - Europe
Data Table on Regional Comparison - Europe

12.3.1 Germany - Market size and forecast 2025-2030

Chart on Germany - Market size and forecast 2025-2030 ($ million)
Data Table on Germany - Market size and forecast 2025-2030 ($ million)
Chart on Germany - Year-over-year growth 2025-2030 (%)
Data Table on Germany - Year-over-year growth 2025-2030 (%)

12.3.2 UK - Market size and forecast 2025-2030

Chart on UK - Market size and forecast 2025-2030 ($ million)
Data Table on UK - Market size and forecast 2025-2030 ($ million)
Chart on UK - Year-over-year growth 2025-2030 (%)
Data Table on UK - Year-over-year growth 2025-2030 (%)

12.3.3 France - Market size and forecast 2025-2030

Chart on France - Market size and forecast 2025-2030 ($ million)
Data Table on France - Market size and forecast 2025-2030 ($ million)
Chart on France - Year-over-year growth 2025-2030 (%)
Data Table on France - Year-over-year growth 2025-2030 (%)

12.3.4 Italy - Market size and forecast 2025-2030

Chart on Italy - Market size and forecast 2025-2030 ($ million)
Data Table on Italy - Market size and forecast 2025-2030 ($ million)
Chart on Italy - Year-over-year growth 2025-2030 (%)
Data Table on Italy - Year-over-year growth 2025-2030 (%)

12.3.5 Spain - Market size and forecast 2025-2030

Chart on Spain - Market size and forecast 2025-2030 ($ million)
Data Table on Spain - Market size and forecast 2025-2030 ($ million)
Chart on Spain - Year-over-year growth 2025-2030 (%)
Data Table on Spain - Year-over-year growth 2025-2030 (%)

12.3.6 The Netherlands - Market size and forecast 2025-2030

Chart on The Netherlands - Market size and forecast 2025-2030 ($ million)
Data Table on The Netherlands - Market size and forecast 2025-2030 ($ million)
Chart on The Netherlands - Year-over-year growth 2025-2030 (%)
Data Table on The Netherlands - Year-over-year growth 2025-2030 (%)

12.4 North America - Market size and forecast 2025-2030

Chart on North America - Market size and forecast 2025-2030 ($ million)
Data Table on North America - Market size and forecast 2025-2030 ($ million)
Chart on North America - Year-over-year growth 2025-2030 (%)
Data Table on North America - Year-over-year growth 2025-2030 (%)
Chart on Regional Comparison - North America
Data Table on Regional Comparison - North America

12.4.1 US - Market size and forecast 2025-2030

Chart on US - Market size and forecast 2025-2030 ($ million)
Data Table on US - Market size and forecast 2025-2030 ($ million)
Chart on US - Year-over-year growth 2025-2030 (%)
Data Table on US - Year-over-year growth 2025-2030 (%)

12.4.2 Canada - Market size and forecast 2025-2030

Chart on Canada - Market size and forecast 2025-2030 ($ million)
Data Table on Canada - Market size and forecast 2025-2030 ($ million)
Chart on Canada - Year-over-year growth 2025-2030 (%)
Data Table on Canada - Year-over-year growth 2025-2030 (%)

12.4.3 Mexico - Market size and forecast 2025-2030

Chart on Mexico - Market size and forecast 2025-2030 ($ million)
Data Table on Mexico - Market size and forecast 2025-2030 ($ million)
Chart on Mexico - Year-over-year growth 2025-2030 (%)
Data Table on Mexico - Year-over-year growth 2025-2030 (%)

12.5 APAC - Market size and forecast 2025-2030

Chart on APAC - Market size and forecast 2025-2030 ($ million)
Data Table on APAC - Market size and forecast 2025-2030 ($ million)
Chart on APAC - Year-over-year growth 2025-2030 (%)
Data Table on APAC - Year-over-year growth 2025-2030 (%)
Chart on Regional Comparison - APAC
Data Table on Regional Comparison - APAC

12.5.1 China - Market size and forecast 2025-2030

Chart on China - Market size and forecast 2025-2030 ($ million)
Data Table on China - Market size and forecast 2025-2030 ($ million)
Chart on China - Year-over-year growth 2025-2030 (%)
Data Table on China - Year-over-year growth 2025-2030 (%)

12.5.2 Japan - Market size and forecast 2025-2030

Chart on Japan - Market size and forecast 2025-2030 ($ million)
Data Table on Japan - Market size and forecast 2025-2030 ($ million)
Chart on Japan - Year-over-year growth 2025-2030 (%)
Data Table on Japan - Year-over-year growth 2025-2030 (%)

12.5.3 India - Market size and forecast 2025-2030

Chart on India - Market size and forecast 2025-2030 ($ million)
Data Table on India - Market size and forecast 2025-2030 ($ million)
Chart on India - Year-over-year growth 2025-2030 (%)
Data Table on India - Year-over-year growth 2025-2030 (%)

12.5.4 South Korea - Market size and forecast 2025-2030

Chart on South Korea - Market size and forecast 2025-2030 ($ million)
Data Table on South Korea - Market size and forecast 2025-2030 ($ million)
Chart on South Korea - Year-over-year growth 2025-2030 (%)
Data Table on South Korea - Year-over-year growth 2025-2030 (%)

12.5.5 Australia - Market size and forecast 2025-2030

Chart on Australia - Market size and forecast 2025-2030 ($ million)
Data Table on Australia - Market size and forecast 2025-2030 ($ million)
Chart on Australia - Year-over-year growth 2025-2030 (%)
Data Table on Australia - Year-over-year growth 2025-2030 (%)

12.5.6 Indonesia - Market size and forecast 2025-2030

Chart on Indonesia - Market size and forecast 2025-2030 ($ million)
Data Table on Indonesia - Market size and forecast 2025-2030 ($ million)
Chart on Indonesia - Year-over-year growth 2025-2030 (%)
Data Table on Indonesia - Year-over-year growth 2025-2030 (%)

12.6 Middle East and Africa - Market size and forecast 2025-2030

Chart on Middle East and Africa - Market size and forecast 2025-2030 ($ million)
Data Table on Middle East and Africa - Market size and forecast 2025-2030 ($ million)
Chart on Middle East and Africa - Year-over-year growth 2025-2030 (%)
Data Table on Middle East and Africa - Year-over-year growth 2025-2030 (%)
Chart on Regional Comparison - Middle East and Africa
Data Table on Regional Comparison - Middle East and Africa

12.6.1 Saudi Arabia - Market size and forecast 2025-2030

Chart on Saudi Arabia - Market size and forecast 2025-2030 ($ million)
Data Table on Saudi Arabia - Market size and forecast 2025-2030 ($ million)
Chart on Saudi Arabia - Year-over-year growth 2025-2030 (%)
Data Table on Saudi Arabia - Year-over-year growth 2025-2030 (%)

12.6.2 UAE - Market size and forecast 2025-2030

Chart on UAE - Market size and forecast 2025-2030 ($ million)
Data Table on UAE - Market size and forecast 2025-2030 ($ million)
Chart on UAE - Year-over-year growth 2025-2030 (%)
Data Table on UAE - Year-over-year growth 2025-2030 (%)

12.6.3 South Africa - Market size and forecast 2025-2030

Chart on South Africa - Market size and forecast 2025-2030 ($ million)
Data Table on South Africa - Market size and forecast 2025-2030 ($ million)
Chart on South Africa - Year-over-year growth 2025-2030 (%)
Data Table on South Africa - Year-over-year growth 2025-2030 (%)

12.6.4 Israel - Market size and forecast 2025-2030

Chart on Israel - Market size and forecast 2025-2030 ($ million)
Data Table on Israel - Market size and forecast 2025-2030 ($ million)
Chart on Israel - Year-over-year growth 2025-2030 (%)
Data Table on Israel - Year-over-year growth 2025-2030 (%)

12.6.5 Turkey - Market size and forecast 2025-2030

Chart on Turkey - Market size and forecast 2025-2030 ($ million)
Data Table on Turkey - Market size and forecast 2025-2030 ($ million)
Chart on Turkey - Year-over-year growth 2025-2030 (%)
Data Table on Turkey - Year-over-year growth 2025-2030 (%)

12.7 South America - Market size and forecast 2025-2030

Chart on South America - Market size and forecast 2025-2030 ($ million)
Data Table on South America - Market size and forecast 2025-2030 ($ million)
Chart on South America - Year-over-year growth 2025-2030 (%)
Data Table on South America - Year-over-year growth 2025-2030 (%)
Chart on Regional Comparison - South America
Data Table on Regional Comparison - South America

12.7.1 Brazil - Market size and forecast 2025-2030

Chart on Brazil - Market size and forecast 2025-2030 ($ million)
Data Table on Brazil - Market size and forecast 2025-2030 ($ million)
Chart on Brazil - Year-over-year growth 2025-2030 (%)
Data Table on Brazil - Year-over-year growth 2025-2030 (%)

12.7.2 Argentina - Market size and forecast 2025-2030

Chart on Argentina - Market size and forecast 2025-2030 ($ million)
Data Table on Argentina - Market size and forecast 2025-2030 ($ million)
Chart on Argentina - Year-over-year growth 2025-2030 (%)
Data Table on Argentina - Year-over-year growth 2025-2030 (%)

12.7.3 Chile - Market size and forecast 2025-2030

Chart on Chile - Market size and forecast 2025-2030 ($ million)
Data Table on Chile - Market size and forecast 2025-2030 ($ million)
Chart on Chile - Year-over-year growth 2025-2030 (%)
Data Table on Chile - Year-over-year growth 2025-2030 (%)

12.8 Market opportunity by geography

Market opportunity by geography ($ million)
Data Tables on Market opportunity by geography ($ million)

13. Drivers, Challenges, and Opportunity

13.1 Market drivers

Heightened regulatory pressure and environmental mandates
Growing consumer demand for sustainable and transparent labeling
Technological advancements in fermentation and cost-efficiency

13.2 Market challenges

Prohibitive production costs and economic disparity with synthetic counterparts
Technical limitations in scalability and downstream purification efficiency
Regulatory fragmentation and stringent performance standardization requirements

13.3 Impact of drivers and challenges

Impact of drivers and challenges in 2025 and 2030

13.4 Market opportunities

Expansion of industrial-scale fermentation and specialized production facilities
Integration of advanced biotechnology and AI in strain optimization
Mainstreaming of bio-based ingredients in personal care and household hygiene

14. Competitive Landscape

14.1 Overview

14.2

Overview on criticality of inputs and factors of differentiation

14.3 Landscape disruption

Overview on factors of disruption

14.4 Industry risks

Impact of key risks on business

15. Competitive Analysis

15.1 Companies profiled

Companies covered

15.2 Company ranking index

15.3 Market positioning of companies

Matrix on companies position and classification

15.4 BASF SE

BASF SE - Overview
BASF SE - Business segments
BASF SE - Key news
BASF SE - Key offerings
BASF SE - Segment focus
SWOT

15.5 Clariant International Ltd.

Clariant International Ltd. - Overview
Clariant International Ltd. - Business segments
Clariant International Ltd. - Key offerings
Clariant International Ltd. - Segment focus
SWOT

15.6 Croda International Plc

Croda International Plc - Overview
Croda International Plc - Business segments
Croda International Plc - Key offerings
Croda International Plc - Segment focus
SWOT

15.7 Evonik Industries AG

Evonik Industries AG - Overview
Evonik Industries AG - Business segments
Evonik Industries AG - Key offerings
Evonik Industries AG - Segment focus
SWOT

15.8 Givaudan SA

Givaudan SA - Overview
Givaudan SA - Business segments
Givaudan SA - Key offerings
Givaudan SA - Segment focus
SWOT

15.9 Innospec Inc.

Innospec Inc. - Overview
Innospec Inc. - Business segments
Innospec Inc. - Key offerings
Innospec Inc. - Segment focus
SWOT

15.10 Jeneil Biotech Inc.

Jeneil Biotech Inc. - Overview
Jeneil Biotech Inc. - Product / Service
Jeneil Biotech Inc. - Key offerings
SWOT

15.11 Kaneka Corp.

Kaneka Corp. - Overview
Kaneka Corp. - Business segments
Kaneka Corp. - Key offerings
Kaneka Corp. - Segment focus
SWOT

15.12 Kemin Industries Inc.

Kemin Industries Inc. - Overview
Kemin Industries Inc. - Product / Service
Kemin Industries Inc. - Key offerings
SWOT

15.13 Lion Corp.

Lion Corp. - Overview
Lion Corp. - Business segments
Lion Corp. - Key offerings
Lion Corp. - Segment focus
SWOT

15.14 Nouryon Chemicals Holding B.V.

Nouryon Chemicals Holding B.V. - Overview
Nouryon Chemicals Holding B.V. - Product / Service
Nouryon Chemicals Holding B.V. - Key offerings
SWOT

15.15 Solvay SA

Solvay SA - Overview
Solvay SA - Business segments
Solvay SA - Key offerings
Solvay SA - Segment focus
SWOT

15.16 Stepan Co.

Stepan Co. - Overview
Stepan Co. - Business segments
Stepan Co. - Key offerings
Stepan Co. - Segment focus
SWOT

15.17 TensioGreen Technology Corp.

TensioGreen Technology Corp. - Overview
TensioGreen Technology Corp. - Product / Service
TensioGreen Technology Corp. - Key offerings
SWOT

15.18 Thermo Fisher Scientific Inc.

Thermo Fisher Scientific Inc. - Overview
Thermo Fisher Scientific Inc. - Business segments
Thermo Fisher Scientific Inc. - Key news
Thermo Fisher Scientific Inc. - Key offerings
Thermo Fisher Scientific Inc. - Segment focus
SWOT

16. Appendix

16.1 Scope of the report

Market definition
Objectives
Notes and caveats

16.2 Inclusions and exclusions checklist

Inclusions checklist
Exclusions checklist

16.3 Currency conversion rates for US$

16.4 Research methodology

16.5 Data procurement

Information sources

16.6 Data validation

16.7 Validation techniques employed for market sizing

16.8 Data synthesis

16.9 360 degree market analysis

16.10 List of abbreviations

Research Methodology

Technavio presents a detailed picture of the market by way of study, synthesis, and summation of data from multiple sources. The analysts have presented the various facets of the market with a particular focus on identifying the key industry influencers. The data thus presented is comprehensive, reliable, and the result of extensive research, both primary and secondary.

INFORMATION SOURCES

Primary sources

  • Manufacturers and suppliers
  • Channel partners
  • Industry experts
  • Strategic decision makers

Secondary sources

  • Industry journals and periodicals
  • Government data
  • Financial reports of key industry players
  • Historical data
  • Press releases

DATA ANALYSIS

Data Synthesis

  • Collation of data
  • Estimation of key figures
  • Analysis of derived insights

Data Validation

  • Triangulation with data models
  • Reference against proprietary databases
  • Corroboration with industry experts

REPORT WRITING

Qualitative

  • Market drivers
  • Market challenges
  • Market trends
  • Five forces analysis

Quantitative

  • Market size and forecast
  • Market segmentation
  • Geographical insights
  • Competitive landscape

Interested in this report?

Get your sample now to see our research methodology and insights!

Download Now

Frequently Asked Questions

Biosurfactants market growth will increase by USD 4230.4 million during 2026-2030.

The Biosurfactants market is expected to grow at a CAGR of 5.8% during 2026-2030.

Biosurfactants market is segmented by Application (Detergents, Cosmetics, Industrial cleaners, Food processing, Others) Type (Glycolipids, Lipopeptides and lipoproteins, Surfactin, Others) Source (Bacterial, Fungal, Others)

AGAE Technologies LLC, BASF SE, Biotensidon GmbH, Clariant International Ltd., Croda International Plc, Evonik Industries AG, Givaudan SA, Holiferm, Innospec Inc., Jeneil Biotech Inc., Kaneka Corp., Kemin Industries Inc., Lion Corp., Nouryon Chemicals Holding B.V., Saraya Co. Ltd., Solvay SA, Stepan Co., TeeGene Biotech Ltd., TensioGreen Technology Corp., Thermo Fisher Scientific Inc. are a few of the key vendors in the Biosurfactants market.

Europe will register the highest growth rate of 51.5% among the other regions. Therefore, the Biosurfactants market in Europe is expected to garner significant business opportunities for the vendors during the forecast period.

Germany, UK, France, Italy, Spain, The Netherlands, US, Canada, Mexico, China, Japan, India, South Korea, Australia, Indonesia, Saudi Arabia, UAE, South Africa, Israel, Turkey, Brazil, Argentina, Chile

  • Heightened regulatory pressure and environmental mandates is the driving factor this market.

The Biosurfactants market vendors should focus on grabbing business opportunities from the Application segment as it accounted for the largest market share in the base year.
RIA - Research AI Assistant
Ask RIA