Bunker Oil Market by Product and Geography - Forecast and Analysis 2022-2026

Bunker Oil Market by Product and Geography - Forecast and Analysis 2022-2026

Published: Sep 2022 137 Pages SKU: IRTNTR45371

Market Overview at a Glance

$93.47 million t
Market Opportunity
5.1%
CAGR
4.68
YoY growth 2021-2022(%)

Bunker Oil Market Size 2022-2026

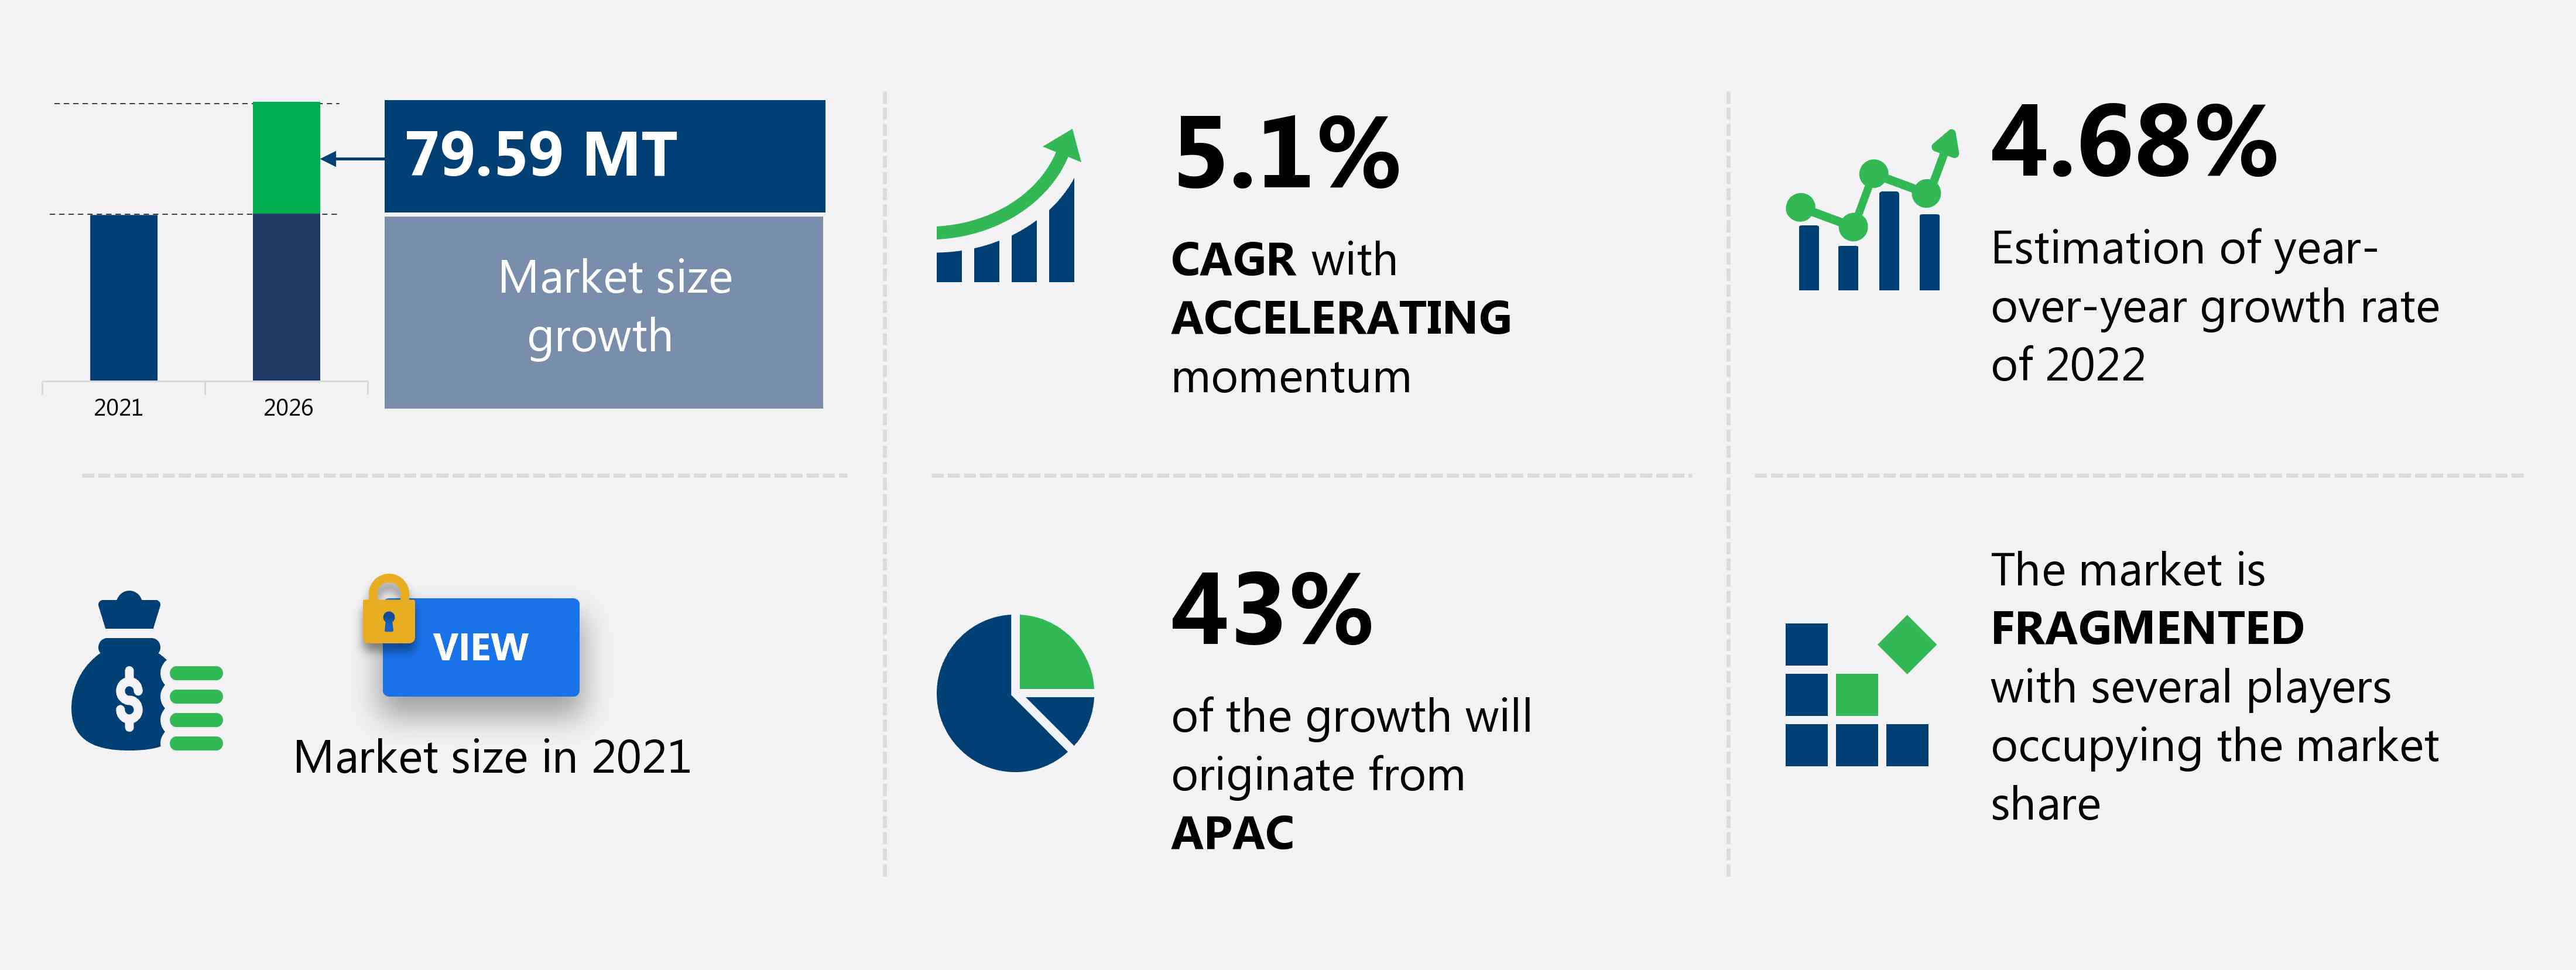
The bunker oil market share is expected to increase by 79.59 million tons from 2021 to 2026, and the market's growth momentum will accelerate at a CAGR of 5.1%.

The maritime transportation sector strives to balance the demand for cargo, shipping efficiency, and environmental responsibility, the adoption of LNG, scrubbers, and eco-friendly fuels like liquefied natural gas is transforming the industry. Emission regulations, coupled with research and development, are driving the creation of cleaner, more efficient technologies that reduce air pollution, improve operational efficiency, and ensure sustainable shipping routes well into the future.The bunker oil market is evolving rapidly due to advancements in shipping technology and growing demand for fuel efficiency and clean fuels. Green shipping initiatives are encouraging the adoption of alternative marine fuels such as biofuels, LNG, and hydrogen fuel cells, driving changes in LNG bunkering infrastructure and fuel optimization technologies. The rise of autonomous shipping and digital shipping is enhancing shipping logistics, while maritime data analytics and shipping analytics provide insights into fuel supply, port operations, and shipping emissions. With maritime decarbonization efforts, shipping finance and shipbuilding are shifting towards high-performance vessels powered by renewable energy sources. The market also faces challenges related to maritime cybersecurity, maritime law, and shipping regulations, driving the need for maritime security and shipping insurance.

What will the Bunker Oil Market Size be During the Forecast Period?

Bunker Oil Market Size

Download the Free Report Sample

The shipping industry is undergoing significant transformation as it faces increasing pressure to reduce its carbon footprint and comply with stringent emission regulations. This shift is particularly evident in the adoption of eco-friendly fuels and exhaust cleaning technologies, such as scrubbers, which are now commonly used on maritime vessels like tankers, container ships, and bulk carriers to reduce sulphur oxides and nitrogen oxides emissions. One of the most notable changes is the switch to low-sulphur fuels, in line with global initiatives to cut down on air pollution, particularly in shipping routes near major urban areas and coastal regions.

In addition to low-sulphur fuels, the industry is increasingly turning to liquefied natural gas (LNG) as an alternative to traditional heavy fuel oil. LNG-based vessels are more efficient and emit fewer pollutants, offering an attractive solution for maritime transportation. Companies are also looking into LPG (liquefied petroleum gas) for power generation on vessels. As part of efforts to decarbonize shipping, organizations like SEA-LNG are advocating for the widespread adoption of LNG-based vessels as an alternative to more polluting fuels.The demand for fuel supply stability and reliability has also led to the rise of logistical networks that support the growing number of LNG-based vessels, and this includes securing reserves and ensuring proper bunker fuels availability at ports. Vessels that run on liquefied petroleum gas or LNG are seen as a viable option to meet both regulatory compliance and the shipping industry's operational needs.

Bunker Oil Market Dynamics

Based on our research output, there has been a negative impact on the market growth during and post-COVID-19 era. The increasing naval expenditure is notably driving the bunker oil market growth, although factors such as fluctuations in oil and gas prices may impede the market growth. Our research analysts have studied the historical data and deduced the key market drivers and the COVID-19 pandemic's impact on the bunker oil industry. The holistic analysis of the drivers will help in deducing end goals and refining marketing strategies to gain a competitive edge.

Key Bunker Oil Market Driver

The increasing naval expenditure is one of the key factors driving the growth of the global bunker oil market. In the current scenario, the external threats that any country faces pertain to security issues. These external threats may be another country, a terrorist organization, or an individual. To combat this, governments in various countries are increasing their spending to raise the defense capacities of their countries. As a crucial part of the armed forces, overall naval spending has also witnessed a significant increase. Moreover, global military expenditure is likely to increase during the forecast period. In 2019, The US topped the list of the largest defense spending nations globally, followed by China, Saudi Arabia, India, and Russia. In addition, certain countries such as Indonesia and South Korea have also increased their military spending substantially over the past few years. However, most naval ships perform patrolling operations around the globe apart from their littoral zones; they also conduct joint naval exercises as well as rescue operations in times of natural calamities. The increase in naval spending, as well as naval operational activities, will boost the growth of the global bunker oil market.

Key Bunker Oil Market Trend

The growing LNG market will fuel the global bunker oil market growth. The demand for LNG as a marine fuel is increasing significantly. LNG is used to reduce emissions of greenhouse gases (GHG), as it is odorless, non-toxic, and non-corrosive. It also evaporates quickly when exposed to air, leaving no residue behind. Though oil-based fuels serve as the main fuel type for ocean-going vessels, LNG is also gradually gaining importance. The number of vessels that are using LNG as fuel is increasing rapidly, which is spurred by the many LNG projects that are under execution and in the planning stage. The main reason for LNG becoming an important alternative fuel is that it complies with the current emission norms, as its usage can reduce SOx, nitrogen oxide (NOx), and carbon dioxide (CO2) emissions considerably. Thus, the increase in the use of LNG will be crucial for the growth of the global bunker oil market.

Key Bunker Oil Market Challenge

The fluctuations in oil and gas prices are a major challenge for the global bunker oil market growth. The price of bunker oil is directly linked to global crude oil prices, and its success or failure depends on the pricing of this commodity. The oil and gas industry has witnessed a prolonged period of low crude oil prices since July 2014. The prices declined continuously owing to the supply-demand imbalance. Upstream oil and gas companies experienced a phase of reduced revenues, which directly impacted their cash flows. As per the data published by the Organisation for Economic Co-operation and Development (OECD) in 2021, crude oil import prices witnessed fluctuations globally. However, with global crude oil prices gradually stabilizing, the cost of bunker oil is also expected to increase, thereby affecting the operating cost of vendors. Also, the new routes chosen for transportation during the phase of low commodity prices may need to be changed, as they might not be feasible with the current or future pricing of bunker fuel. Such fluctuations in global crude oil prices can provide a temporary increase in the profit margins but pose a challenge for the global bunker oil market during the forecast period.

This bunker oil market analysis report also provides detailed information on other upcoming trends and challenges that will have a far-reaching effect on the market growth. The actionable insights on the trends and challenges will help companies evaluate and develop growth strategies for 2022-2026.

Parent Market Analysis

Technavio categorizes the global bunker oil market as a part of the global oil and gas storage and transportation market within the global oil and gas market. Our research report has extensively covered external factors influencing the parent market growth potential in the coming years, which will determine the levels of growth of the bunker oil market during the forecast period.

Who are the Major Bunker Oil Market Vendors?

The report analyzes the market's competitive landscape and offers information on several market vendors, including:

  • BP Plc
  • Chevron Corp.
  • China National Petroleum Corp.
  • Exxon Mobil Corp.
  • Hindustan Petroleum Corp. Ltd.
  • Marquard and Bahls AG
  • Public Joint Stock Company Gazprom
  • Royal Dutch Shell Plc
  • TotalEnergies SE
  • Toyota Tsusho Petroleum Pte. Ltd.

Product Insights and News

  • BP Plc - The company offers different kinds of industrial fuel, namely BP 80 fuel oil, BP fuel oil F60, BP 180 fuel oil, and underground mining fuel

To make the most of the opportunities and recover from the post-COVID-19 impact, market vendors should focus more on the growth prospects in the fast-growing segments while maintaining their positions in the slow-growing segments.

The bunker oil market forecast report offers in-depth insights into key vendor profiles. The profiles include information on the leading companies' production, sustainability, and prospects.

Bunker Oil Market Value Chain Analysis

Our report provides extensive information on the value chain analysis for the bunker oil market, which vendors can leverage to gain a competitive advantage during the forecast period. The end-to-end understanding of the value chain is essential in profit margin optimization and evaluation of business strategies. The data available in our value chain analysis segment can help vendors drive costs and enhance customer services during the forecast period.

The value chain of the global oil and gas market includes the following core components:

  • Inputs
  • Inbound logistics
  • Operations
  • Outbound logistics
  • Marketing and sales
  • Service
  • Support activities
  • Innovation

The report has further elucidated other innovative approaches being followed by manufacturers to ensure a sustainable market presence.

Which are the Key Regions for Bunker Oil Market?

For more insights on the market share of various regions Request for a FREE sample now!

43% of the market's growth will originate from APAC during the forecast period. Singapore and China are the key markets for the bunker oil market in APAC. Market growth in this region will be faster than the growth of the market in other regions.

The increasing naval expenditure will facilitate the bunker oil market growth in APAC over the forecast period. This market research report entails detailed information on the competitive intelligence, marketing gaps, and regional opportunities in store for vendors, which will assist in creating efficient business plans.

COVID-19 Impact and Recovery Analysis

In 2020, China and India were the most affected countries in the region by the COVID-19 pandemic. Moreover, many APAC countries were hit by the second wave of the outbreak during the Q1 and Q2 of 2021. Governments in the region imposed nationwide lockdowns in 2020, which resulted in the suspension of business activities and restricted trade activities. This led to market disruptions in 2020.  However, in Q4 2020, many countries across APAC lifted restrictions on various business activities. Vendors were then able to resume their routine operations by adhering to COVID-19 guidelines that mandated social distancing measures and restrictions on the entry of non-essential visitors at their facilities. Such initiatives are expected to help vendors remain operational and allow the regional market to recover slowly and grow during the forecast period.

What are the Revenue-generating Product Segments in the Bunker Oil Market?

To gain further insights on the market contribution of various segments Request for a FREE sample

The bunker oil market share growth by the Residual fuel segment will be significant during the forecast period. The fuel oil that is obtained from the refinery after the distillation process has various classifications based on its further use across different industries. This fuel oil is primarily obtained as a distillate or a residue. The classification depends on the boiling point as well as the composition of the product.

This report provides an accurate prediction of the contribution of all the segments to the growth of the bunker oil market size and actionable market insights on the post-COVID-19 impact on each segment.

Bunker Oil Market Scope

Report Coverage

Details

Page number

120

Base year

2021

Forecast period

2022-2026

Growth momentum & CAGR

Accelerate at a CAGR of 5.1%

Market growth 2022-2026

79.59 mn tons

Market structure

Fragmented

YoY growth (%)

4.68

Regional analysis

North America, Europe, APAC, South America, and MEA

Performing market contribution

APAC at 43%

Key consumer countries

Singapore, US, China, UAE, and The Netherlands

Competitive landscape

Leading companies, Competitive Strategies, Consumer engagement scope

Key companies profiled

BP Plc, Chevron Corp., China National Petroleum Corp., Exxon Mobil Corp., Hindustan Petroleum Corp. Ltd., Marquard and Bahls AG, Public Joint Stock Company Gazprom, Royal Dutch Shell Plc, TotalEnergies SE, and Toyota Tsusho Petroleum Pte. Ltd.

Market dynamics

Parent market analysis, Market growth inducers and obstacles, Fast-growing and slow-growing segment analysis, COVID-19 impact and recovery analysis and future consumer dynamics, and Market condition analysis for the forecast period.

Customization purview

If our report has not included the data that you are looking for, you can reach out to our analysts and get segments customized.

Request for a FREE sample

What are the Key Data Covered in this Bunker Oil Market Report?

  • CAGR of the market during the forecast period 2022-2026
  • Detailed information on factors that will drive bunker oil market growth during the next five years
  • Precise estimation of the bunker oil market size and its contribution to the parent market
  • Accurate predictions on upcoming trends and changes in consumer behavior
  • The growth of the bunker oil industry across North America, Europe, APAC, South America, and MEA
  • A thorough analysis of the market's competitive landscape and detailed information on vendors
  • Comprehensive details of factors that will challenge the growth of bunker oil market vendors

We can help! Our analysts can customize this report to meet your requirements. Get in touch

1 Executive Summary

  • 1.1 Market overview
    • Exhibit 01: Executive Summary – Chart on Market Overview
    • Exhibit 02: Executive Summary – Data Table on Market Overview
    • Exhibit 03: Executive Summary – Chart on Global Market Characteristics
    • Exhibit 04: Executive Summary – Chart on Market by Geography
    • Exhibit 05: Executive Summary – Chart on Market Segmentation by Product Type
    • Exhibit 06: Executive Summary – Chart on Incremental Growth
    • Exhibit 07: Executive Summary – Data Table on Incremental Growth
    • Exhibit 08: Executive Summary – Chart on Vendor Market Positioning

2 Market Landscape

  • 2.1 Market ecosystem
    • Exhibit 09: Parent market
    • Exhibit 10: Market Characteristics

3 Market Sizing

  • 3.1 Market definition
    • Exhibit 11: Offerings of vendors included in the market definition
  • 3.2 Market segment analysis
    • Exhibit 12: Market segments
  • 3.3 Market size 2021
    • 3.4 Market outlook: Forecast for 2021-2026
      • Exhibit 13: Chart on Global - Market size and forecast 2021-2026 (million t)
      • Exhibit 14: Data Table on Global - Market size and forecast 2021-2026 (million t)
      • Exhibit 15: Chart on Global Market- Year-over-year growth 2021-2026 (%)
      • Exhibit 16: Data Table on Global Market- Year-over-year growth 2021-2026 (%)

    4 Five Forces Analysis

    • 4.1 Five forces summary
      • Exhibit 17: Five forces analysis - Comparison between 2021 and 2026
    • 4.2 Bargaining power of buyers
      • Exhibit 18: Chart on Bargaining power of buyers – Impact of key factors 2021 and 2026
    • 4.3 Bargaining power of suppliers
      • Exhibit 19: Bargaining power of suppliers – Impact of key factors in 2021 and 2026
    • 4.4 Threat of new entrants
      • Exhibit 20: Threat of new entrants – Impact of key factors in 2021 and 2026
    • 4.5 Threat of substitutes
      • Exhibit 21: Threat of substitutes – Impact of key factors in 2021 and 2026
    • 4.6 Threat of rivalry
      • Exhibit 22: Threat of rivalry – Impact of key factors in 2021 and 2026
    • 4.7 Market condition
      • Exhibit 23: Chart on Market condition - Five forces 2021 and 2026

    5 Market Segmentation by Product Type

    • 5.1 Market segments
      • Exhibit 24: Chart on Product Type - Market share 2021-2026 (%)
      • Exhibit 25: Data Table on Product Type - Market share 2021-2026 (%)
    • 5.2 Comparison by Product Type
      • Exhibit 26: Chart on Comparison by Product Type
      • Exhibit 27: Data Table on Comparison by Product Type
    • 5.3 Residual fuel - Market size and forecast 2021-2026
      • Exhibit 28: Chart on Residual fuel - Market size and forecast 2021-2026 (million t)
      • Exhibit 29: Data Table on Residual fuel - Market size and forecast 2021-2026 (million t)
      • Exhibit 30: Chart on Residual fuel - Year-over-year growth 2021-2026 (%)
      • Exhibit 31: Data Table on Residual fuel - Year-over-year growth 2021-2026 (%)
    • 5.4 Distillate fuel - Market size and forecast 2021-2026
      • Exhibit 32: Chart on Distillate fuel - Market size and forecast 2021-2026 (million t)
      • Exhibit 33: Data Table on Distillate fuel - Market size and forecast 2021-2026 (million t)
      • Exhibit 34: Chart on Distillate fuel - Year-over-year growth 2021-2026 (%)
      • Exhibit 35: Data Table on Distillate fuel - Year-over-year growth 2021-2026 (%)
    • 5.5 Market opportunity by Product Type
      • Exhibit 36: Market opportunity by Product Type (million t)

    6 Customer Landscape

    • 6.1 Customer landscape overview
      • Exhibit 37: Analysis of price sensitivity, lifecycle, customer purchase basket, adoption rates, and purchase criteria

    7 Geographic Landscape

    • 7.1 Geographic segmentation
      • Exhibit 38: Chart on Market share by geography 2021-2026 (%)
      • Exhibit 39: Data Table on Market share by geography 2021-2026 (%)
    • 7.2 Geographic comparison
      • Exhibit 40: Chart on Geographic comparison
      • Exhibit 41: Data Table on Geographic comparison
    • 7.3 APAC - Market size and forecast 2021-2026
      • Exhibit 42: Chart on APAC - Market size and forecast 2021-2026 (million t)
      • Exhibit 43: Data Table on APAC - Market size and forecast 2021-2026 (million t)
      • Exhibit 44: Chart on APAC - Year-over-year growth 2021-2026 (%)
      • Exhibit 45: Data Table on APAC - Year-over-year growth 2021-2026 (%)
    • 7.4 Europe - Market size and forecast 2021-2026
      • Exhibit 46: Chart on Europe - Market size and forecast 2021-2026 (million t)
      • Exhibit 47: Data Table on Europe - Market size and forecast 2021-2026 (million t)
      • Exhibit 48: Chart on Europe - Year-over-year growth 2021-2026 (%)
      • Exhibit 49: Data Table on Europe - Year-over-year growth 2021-2026 (%)
    • 7.5 North America - Market size and forecast 2021-2026
      • Exhibit 50: Chart on North America - Market size and forecast 2021-2026 (million t)
      • Exhibit 51: Data Table on North America - Market size and forecast 2021-2026 (million t)
      • Exhibit 52: Chart on North America - Year-over-year growth 2021-2026 (%)
      • Exhibit 53: Data Table on North America - Year-over-year growth 2021-2026 (%)
    • 7.6 Middle East and Africa - Market size and forecast 2021-2026
      • Exhibit 54: Chart on Middle East and Africa - Market size and forecast 2021-2026 (million t)
      • Exhibit 55: Data Table on Middle East and Africa - Market size and forecast 2021-2026 (million t)
      • Exhibit 56: Chart on Middle East and Africa - Year-over-year growth 2021-2026 (%)
      • Exhibit 57: Data Table on Middle East and Africa - Year-over-year growth 2021-2026 (%)
    • 7.7 South America - Market size and forecast 2021-2026
      • Exhibit 58: Chart on South America - Market size and forecast 2021-2026 (million t)
      • Exhibit 59: Data Table on South America - Market size and forecast 2021-2026 (million t)
      • Exhibit 60: Chart on South America - Year-over-year growth 2021-2026 (%)
      • Exhibit 61: Data Table on South America - Year-over-year growth 2021-2026 (%)
    • 7.8 Singapore - Market size and forecast 2021-2026
      • Exhibit 62: Chart on Singapore - Market size and forecast 2021-2026 (million t)
      • Exhibit 63: Data Table on Singapore - Market size and forecast 2021-2026 (million t)
      • Exhibit 64: Chart on Singapore - Year-over-year growth 2021-2026 (%)
      • Exhibit 65: Data Table on Singapore - Year-over-year growth 2021-2026 (%)
    • 7.9 US - Market size and forecast 2021-2026
      • Exhibit 66: Chart on US - Market size and forecast 2021-2026 (million t)
      • Exhibit 67: Data Table on US - Market size and forecast 2021-2026 (million t)
      • Exhibit 68: Chart on US - Year-over-year growth 2021-2026 (%)
      • Exhibit 69: Data Table on US - Year-over-year growth 2021-2026 (%)
    • 7.10 China - Market size and forecast 2021-2026
      • Exhibit 70: Chart on China - Market size and forecast 2021-2026 (million t)
      • Exhibit 71: Data Table on China - Market size and forecast 2021-2026 (million t)
      • Exhibit 72: Chart on China - Year-over-year growth 2021-2026 (%)
      • Exhibit 73: Data Table on China - Year-over-year growth 2021-2026 (%)
    • 7.11 United Arab Emirates - Market size and forecast 2021-2026
      • Exhibit 74: Chart on United Arab Emirates - Market size and forecast 2021-2026 (million t)
      • Exhibit 75: Data Table on United Arab Emirates - Market size and forecast 2021-2026 (million t)
      • Exhibit 76: Chart on United Arab Emirates - Year-over-year growth 2021-2026 (%)
      • Exhibit 77: Data Table on United Arab Emirates - Year-over-year growth 2021-2026 (%)
    • 7.12 The Netherlands - Market size and forecast 2021-2026
      • Exhibit 78: Chart on The Netherlands - Market size and forecast 2021-2026 (million t)
      • Exhibit 79: Data Table on The Netherlands - Market size and forecast 2021-2026 (million t)
      • Exhibit 80: Chart on The Netherlands - Year-over-year growth 2021-2026 (%)
      • Exhibit 81: Data Table on The Netherlands - Year-over-year growth 2021-2026 (%)
    • 7.13 Market opportunity by geography
      • Exhibit 82: Market opportunity by geography (million t)

    8 Drivers, Challenges, and Trends

    • 8.1 Market drivers
      • 8.2 Market challenges
        • 8.3 Impact of drivers and challenges
          • Exhibit 83: Impact of drivers and challenges in 2021 and 2026
        • 8.4 Market trends

          9 Vendor Landscape

          • 9.1 Overview
            • 9.2 Vendor landscape
              • Exhibit 84: Overview on Criticality of inputs and Factors of differentiation
            • 9.3 Landscape disruption
              • Exhibit 85: Overview on factors of disruption
            • 9.4 Industry risks
              • Exhibit 86: Impact of key risks on business

            10 Vendor Analysis

            • 10.1 Vendors covered
              • Exhibit 87: Vendors covered
            • 10.2 Market positioning of vendors
              • Exhibit 88: Matrix on vendor position and classification
            • 10.3 BP Plc
              • Exhibit 89: BP Plc - Overview
              • Exhibit 90: BP Plc - Business segments
              • Exhibit 91: BP Plc - Key offerings
              • Exhibit 92: BP Plc - Segment focus
            • 10.4 Chevron Corp.
              • Exhibit 93: Chevron Corp. - Overview
              • Exhibit 94: Chevron Corp. - Business segments
              • Exhibit 95: Chevron Corp. - Key news
              • Exhibit 96: Chevron Corp. - Key offerings
              • Exhibit 97: Chevron Corp. - Segment focus
            • 10.5 China National Petroleum Corp.
              • Exhibit 98: China National Petroleum Corp. - Overview
              • Exhibit 99: China National Petroleum Corp. - Product / Service
              • Exhibit 100: China National Petroleum Corp. - Key offerings
            • 10.6 Exxon Mobil Corp.
              • Exhibit 101: Exxon Mobil Corp. - Overview
              • Exhibit 102: Exxon Mobil Corp. - Business segments
              • Exhibit 103: Exxon Mobil Corp. - Key offerings
              • Exhibit 104: Exxon Mobil Corp. - Segment focus
            • 10.7 Glencore Plc
              • Exhibit 105: Glencore Plc - Overview
              • Exhibit 106: Glencore Plc - Business segments
              • Exhibit 107: Glencore Plc - Key offerings
              • Exhibit 108: Glencore Plc - Segment focus
            • 10.8 Hindustan Petroleum Corp. Ltd.
              • Exhibit 109: Hindustan Petroleum Corp. Ltd. - Overview
              • Exhibit 110: Hindustan Petroleum Corp. Ltd. - Business segments
              • Exhibit 111: Hindustan Petroleum Corp. Ltd. - Key offerings
              • Exhibit 112: Hindustan Petroleum Corp. Ltd. - Segment focus
            • 10.9 Marquard and Bahls AG
              • Exhibit 113: Marquard and Bahls AG - Overview
              • Exhibit 114: Marquard and Bahls AG - Product / Service
              • Exhibit 115: Marquard and Bahls AG - Key offerings
            • 10.10 Shell plc
              • Exhibit 116: Shell plc - Overview
              • Exhibit 117: Shell plc - Business segments
              • Exhibit 118: Shell plc - Key news
              • Exhibit 119: Shell plc - Key offerings
              • Exhibit 120: Shell plc - Segment focus
            • 10.11 TotalEnergies SE
              • Exhibit 121: TotalEnergies SE - Overview
              • Exhibit 122: TotalEnergies SE - Business segments
              • Exhibit 123: TotalEnergies SE - Key news
              • Exhibit 124: TotalEnergies SE - Key offerings
              • Exhibit 125: TotalEnergies SE - Segment focus
            • 10.12 Toyota Tsusho Corp.
              • Exhibit 126: Toyota Tsusho Corp. - Overview
              • Exhibit 127: Toyota Tsusho Corp. - Business segments
              • Exhibit 128: Toyota Tsusho Corp. - Key news
              • Exhibit 129: Toyota Tsusho Corp. - Key offerings
              • Exhibit 130: Toyota Tsusho Corp. - Segment focus

            11 Appendix

            • 11.1 Scope of the report
              • 11.2 Inclusions and exclusions checklist
                • Exhibit 131: Inclusions checklist
                • Exhibit 132: Exclusions checklist
              • 11.3 Currency conversion rates for US$
                • Exhibit 133: Currency conversion rates for US$
              • 11.4 Research methodology
                • Exhibit 134: Research methodology
                • Exhibit 135: Validation techniques employed for market sizing
                • Exhibit 136: Information sources
              • 11.5 List of abbreviations
                • Exhibit 137: List of abbreviations

              Research Methodology

              Technavio presents a detailed picture of the market by way of study, synthesis, and summation of data from multiple sources. The analysts have presented the various facets of the market with a particular focus on identifying the key industry influencers. The data thus presented is comprehensive, reliable, and the result of extensive research, both primary and secondary.

              INFORMATION SOURCES

              Primary sources

              • Manufacturers and suppliers
              • Channel partners
              • Industry experts
              • Strategic decision makers

              Secondary sources

              • Industry journals and periodicals
              • Government data
              • Financial reports of key industry players
              • Historical data
              • Press releases

              DATA ANALYSIS

              Data Synthesis

              • Collation of data
              • Estimation of key figures
              • Analysis of derived insights

              Data Validation

              • Triangulation with data models
              • Reference against proprietary databases
              • Corroboration with industry experts

              REPORT WRITING

              Qualitative

              • Market drivers
              • Market challenges
              • Market trends
              • Five forces analysis

              Quantitative

              • Market size and forecast
              • Market segmentation
              • Geographical insights
              • Competitive landscape

              Interested in this report?

              Get your sample now to see our research methodology and insights!

              Download Now

              Frequently Asked Questions

              Bunker Oil market growth will increase by 93.47 million t during 2022-2026.

              The Bunker Oil market is expected to grow at a CAGR of 5.1% during 2022-2026.

              Bunker Oil market is segmented by Product Type( Residual fuel, Distillate fuel) Geographic( APAC, Europe, North America, Middle East and Africa, South America)

              BP Plc, Chevron Corp., China National Petroleum Corp., Consort Bunkers Pte. Ltd., Equatorial Marine Fuel Management Services Pte. Ltd., Exxon Mobil Corp., Glencore Plc, Global Energy International Ltd., Hindustan Petroleum Corp. Ltd., Hong Lam Marine Pte. Ltd., Marquard and Bahls AG, Mercuria Energy Group Ltd., SENTEK Marine Pte. Ltd., Shell plc, Shenzhen Petroglory Group Co. Ltd., SK B and T Pte. Ltd., TotalEnergies SE, Toyota Tsusho Corp., Vitol Netherlands Cooperatief UA, World Fuel Services Corp. are a few of the key vendors in the Bunker Oil market.

              APAC will register the highest growth rate of 44.51% among the other regions. Therefore, the Bunker Oil market in APAC is expected to garner significant business opportunities for the vendors during the forecast period.

              US, United Arab Emirates, Singapore, China, The Netherlands

              • Increasing naval expenditureIn the current scenario is the driving factor this market.
              • the external threats that any country face pertains to security issues. These external threats may be another country is the driving factor this market.
              • a terrorist organization is the driving factor this market.
              • or an individual. To combat this is the driving factor this market.
              • governments in various countries are increasing their spending to raise the defense capacities of their countries. As a crucial part of the armed forces is the driving factor this market.
              • the overall naval spending has also witnessed a significant increase.  The global military expenditure is likely to increase during the forecast period. In 2021 is the driving factor this market.
              • the US topped the list of the largest defense spending nations globally is the driving factor this market.
              • followed by China is the driving factor this market.
              • India is the driving factor this market.
              • the UK is the driving factor this market.
              • Russia is the driving factor this market.
              • and France with $801 is the driving factor this market.
              • $292 is the driving factor this market.
              • $76.6 is the driving factor this market.
              • $68.4 is the driving factor this market.
              • $65.9 is the driving factor this market.
              • and $56.6 billion budget is the driving factor this market.
              • respectively. In addition is the driving factor this market.
              • certain countries such as Indonesia and South Korea have also increased their military spending substantially over the past few years.  Most of the naval ships perform patrolling operations around the globe apart from their littoral zones; they are also conducting joint naval exercises as well as rescue operations in times of natural calamities. The increase in naval spending is the driving factor this market.
              • as well as operational activities is the driving factor this market.
              • will boost the growth of the global bunker oil market.   is the driving factor this market.

              The Bunker Oil market vendors should focus on grabbing business opportunities from the Residual fuel segment as it accounted for the largest market share in the base year.
              RIA - Research AI Assistant
              Ask RIA