Cataract Surgery Devices Market Size 2026-2030
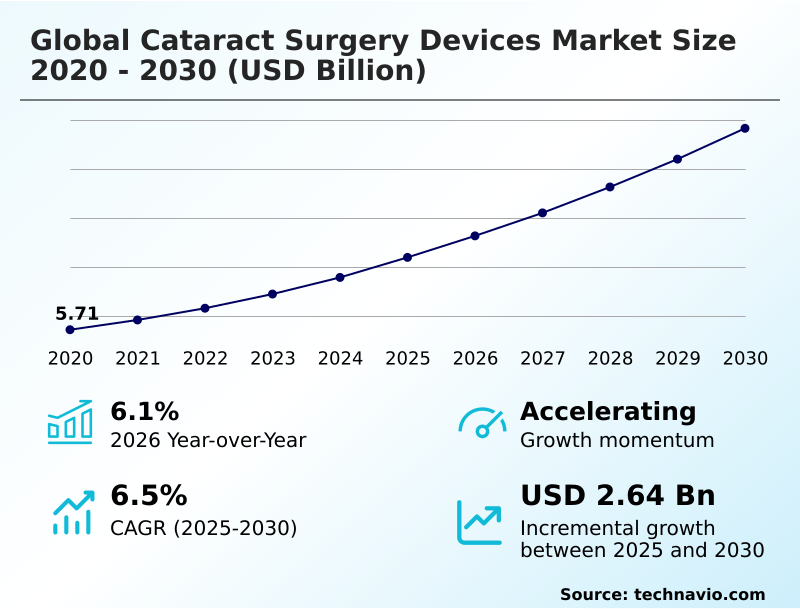
The cataract surgery devices market size is valued to increase by USD 2.64 billion, at a CAGR of 6.5% from 2025 to 2030. Increasing prevalence of cataracts and rise in geriatric population will drive the cataract surgery devices market.
Major Market Trends & Insights
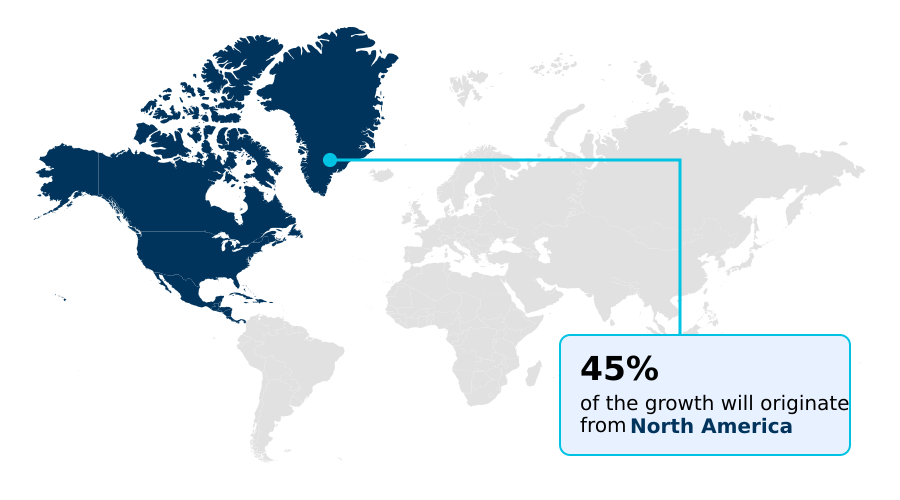
- North America dominated the market and accounted for a 45% growth during the forecast period.
- By Product - Intraocular lens (IOLs) segment was valued at USD 3.73 billion in 2024
- By End-user - Hospitals and clinics segment accounted for the largest market revenue share in 2024
Market Size & Forecast
- Market Opportunities: USD 4.11 billion
- Market Future Opportunities: USD 2.64 billion
- CAGR from 2025 to 2030 : 6.5%
Market Summary
What will be the Size of the Cataract Surgery Devices Market during the forecast period?
Get Key Insights on Market Forecast (PDF) Get Free Sample
How is the Cataract Surgery Devices Market Segmented?
The cataract surgery devices industry research report provides comprehensive data (region-wise segment analysis), with forecasts and estimates in "USD million" for the period 2026-2030, as well as historical data from 2020-2024 for the following segments.
- Product
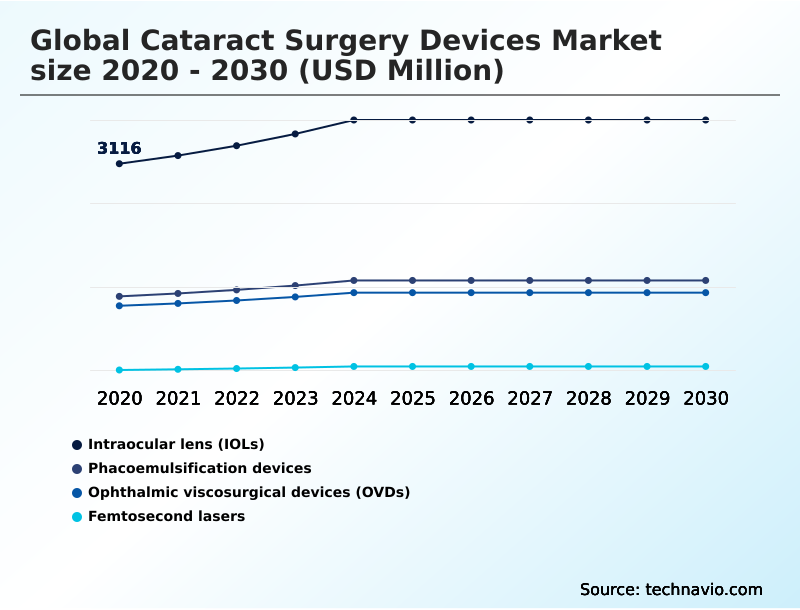
- Intraocular lens (IOLs)
- Phacoemulsification devices
- Ophthalmic viscosurgical devices (OVDs)
- Femtosecond lasers
- End-user
- Hospitals and clinics
- Ophthalmology centers
- Application
- Nuclear sclerotic
- Posterior sub capsular
- Cortical cataracts
- Others
- Geography
- North America
- US
- Canada
- Mexico
- Europe
- Germany
- UK
- France
- Asia
- Rest of World (ROW)
- North America
By Product Insights
The intraocular lens (iols) segment is estimated to witness significant growth during the forecast period.
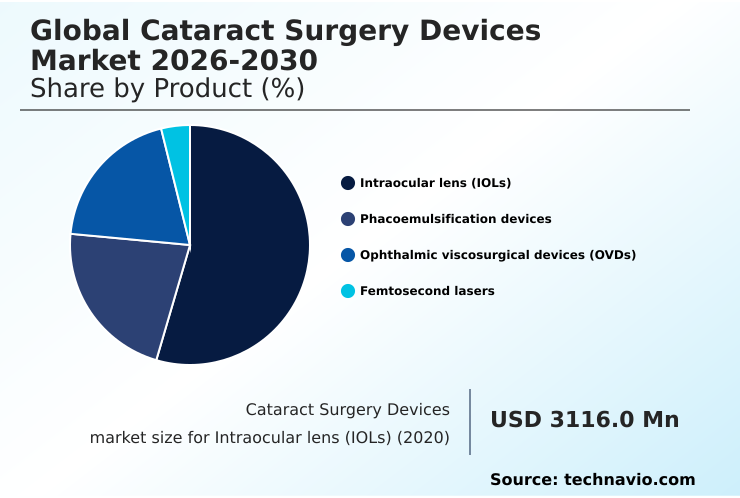
The Intraocular lens (IOLs) segment was valued at USD 3.73 billion in 2024 and showed a gradual increase during the forecast period.
Regional Analysis
North America is estimated to contribute 45% to the growth of the global market during the forecast period.Technavio’s analysts have elaborately explained the regional trends and drivers that shape the market during the forecast period.
See How Cataract Surgery Devices Market Demand is Rising in North America Get Free Sample
Market Dynamics
Our researchers analyzed the data with 2025 as the base year, along with the key drivers, trends, and challenges. A holistic analysis of drivers will help companies refine their marketing strategies to gain a competitive advantage.
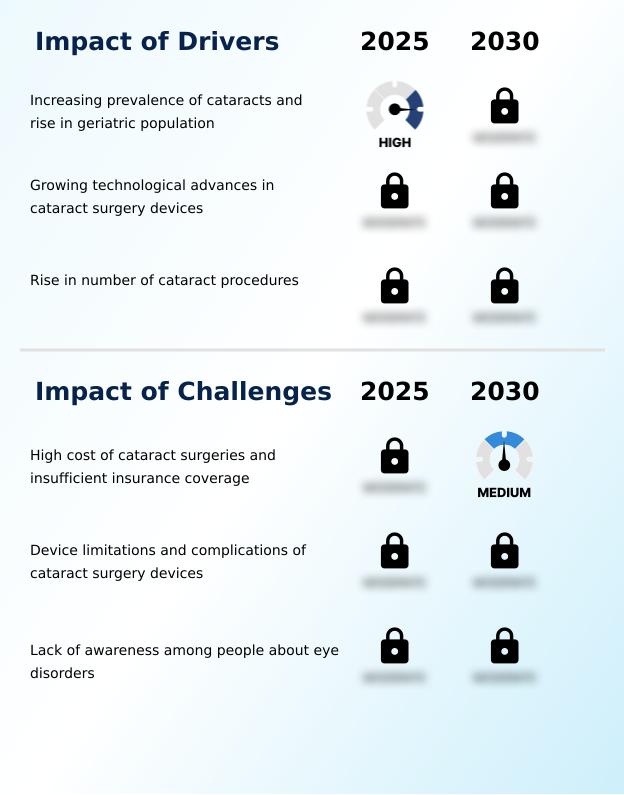
What are the key market drivers leading to the rise in the adoption of Cataract Surgery Devices Industry?
What are the market trends shaping the Cataract Surgery Devices Industry?
What challenges does the Cataract Surgery Devices Industry face during its growth?
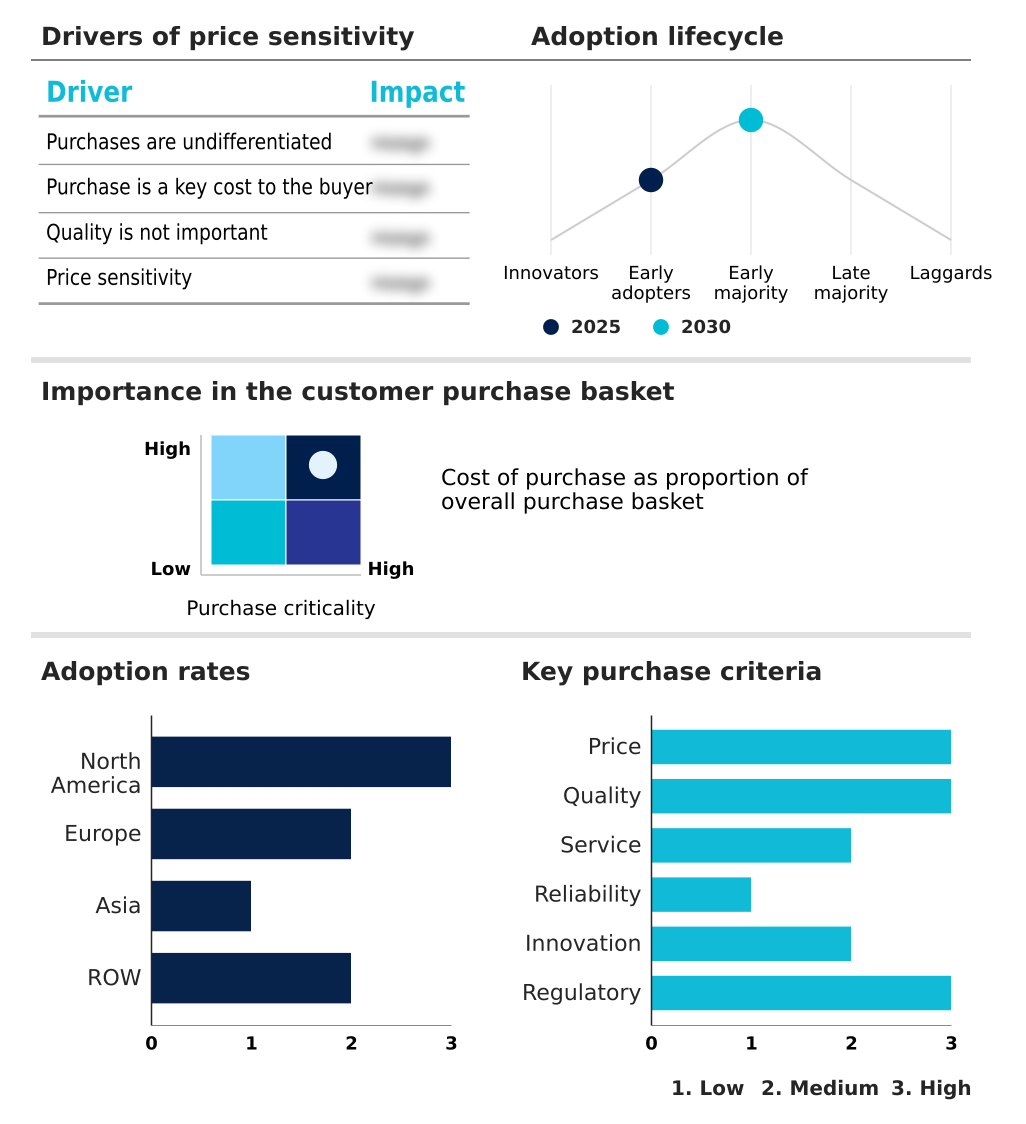
Exclusive Technavio Analysis on Customer Landscape
The cataract surgery devices market forecasting report includes the adoption lifecycle of the market, covering from the innovator’s stage to the laggard’s stage. It focuses on adoption rates in different regions based on penetration. Furthermore, the cataract surgery devices market report also includes key purchase criteria and drivers of price sensitivity to help companies evaluate and develop their market growth analysis strategies.
Customer Landscape of Cataract Surgery Devices Industry
Competitive Landscape
Companies are implementing various strategies, such as strategic alliances, cataract surgery devices market forecast, partnerships, mergers and acquisitions, geographical expansion, and product/service launches, to enhance their presence in the industry.
Abbott Laboratories -
The industry research and growth report includes detailed analyses of the competitive landscape of the market and information about key companies, including:
- Abbott Laboratories
- AbbVie Inc.
- Alcon Inc.
- Bausch Health Companies Inc.
- Carl Zeiss AG
- CRISTALENS
- EssilorLuxottica
- HOYA CORP.
- Johnson and Johnson Services
- Lenstec Inc.
- Metall Zug AG
- Mitsui Chemicals Inc.
- NIDEK Co. Ltd.
- Oertli Instrumente AG
- Rayner
- ROWIAK GmbH
- SIFI SPA
- STAAR Surgical Co.
- Topcon Corp.
- Ziemer Ophthalmic Systems
Qualitative and quantitative analysis of companies has been conducted to help clients understand the wider business environment as well as the strengths and weaknesses of key industry players. Data is qualitatively analyzed to categorize companies as pure play, category-focused, industry-focused, and diversified; it is quantitatively analyzed to categorize companies as dominant, leading, strong, tentative, and weak.
Recent Development and News in Cataract surgery devices market
Dive into Technavio’s robust research methodology, blending expert interviews, extensive data synthesis, and validated models for unparalleled Cataract Surgery Devices Market insights. See full methodology.
| Market Scope | |
|---|---|
| Page number | 301 |
| Base year | 2025 |
| Historic period | 2020-2024 |
| Forecast period | 2026-2030 |
| Growth momentum & CAGR | Accelerate at a CAGR of 6.5% |
| Market growth 2026-2030 | USD 2637.9 million |
| Market structure | Fragmented |
| YoY growth 2025-2026(%) | 6.1% |
| Key countries | US, Canada, Mexico, Germany, UK, France, Italy, Spain, The Netherlands, Russia, China, Japan, India, South Korea, Indonesia, Thailand, Singapore, Australia, UAE, Brazil, South Africa, Saudi Arabia and Turkey |
| Competitive landscape | Leading Companies, Market Positioning of Companies, Competitive Strategies, and Industry Risks |
Research Analyst Overview
What are the Key Data Covered in this Cataract Surgery Devices Market Research and Growth Report?
-
What is the expected growth of the Cataract Surgery Devices Market between 2026 and 2030?
-
USD 2.64 billion, at a CAGR of 6.5%
-
-
What segmentation does the market report cover?
-
The report is segmented by Product (Intraocular lens (IOLs), Phacoemulsification devices, Ophthalmic viscosurgical devices (OVDs), and Femtosecond lasers), End-user (Hospitals and clinics, and Ophthalmology centers), Application (Nuclear sclerotic, Posterior sub capsular, Cortical cataracts, and Others) and Geography (North America, Europe, Asia, Rest of World (ROW))
-
-
Which regions are analyzed in the report?
-
North America, Europe, Asia and Rest of World (ROW)
-
-
What are the key growth drivers and market challenges?
-
Increasing prevalence of cataracts and rise in geriatric population, High cost of cataract surgeries and insufficient insurance coverage
-
-
Who are the major players in the Cataract Surgery Devices Market?
-
Abbott Laboratories, AbbVie Inc., Alcon Inc., Bausch Health Companies Inc., Carl Zeiss AG, CRISTALENS, EssilorLuxottica, HOYA CORP., Johnson and Johnson Services, Lenstec Inc., Metall Zug AG, Mitsui Chemicals Inc., NIDEK Co. Ltd., Oertli Instrumente AG, Rayner, ROWIAK GmbH, SIFI SPA, STAAR Surgical Co., Topcon Corp. and Ziemer Ophthalmic Systems
-
Market Research Insights
We can help! Our analysts can customize this cataract surgery devices market research report to meet your requirements.
 RIA -
RIA - 
