
Ceramic Substrate Market Size 2025-2029
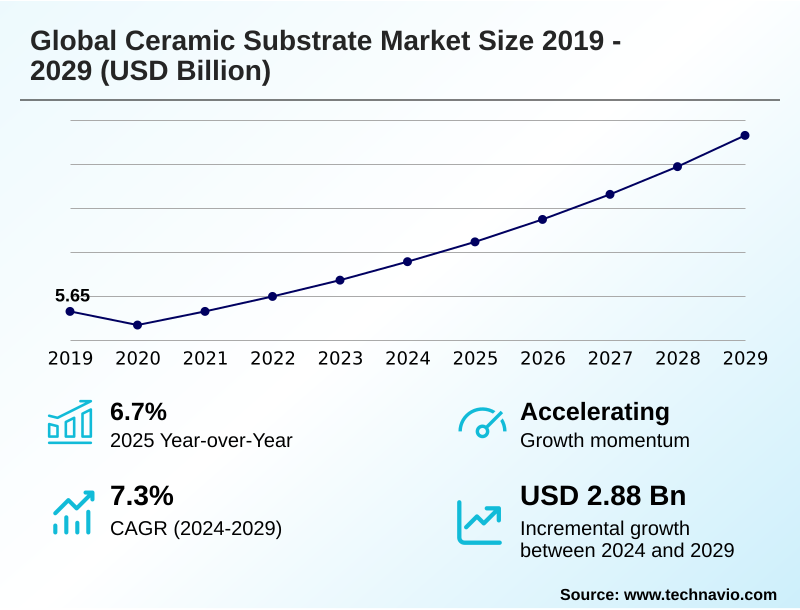
The ceramic substrate market size is valued to increase by USD 2.88 billion, at a CAGR of 7.3% from 2024 to 2029. Proliferation of EV and associated power electronics will drive the ceramic substrate market.
Major Market Trends & Insights
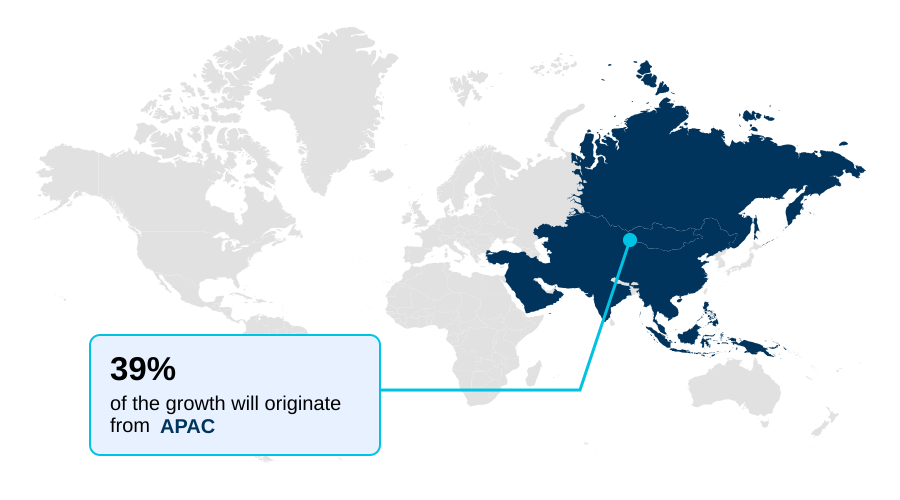
- APAC dominated the market and accounted for a 39.2% growth during the forecast period.
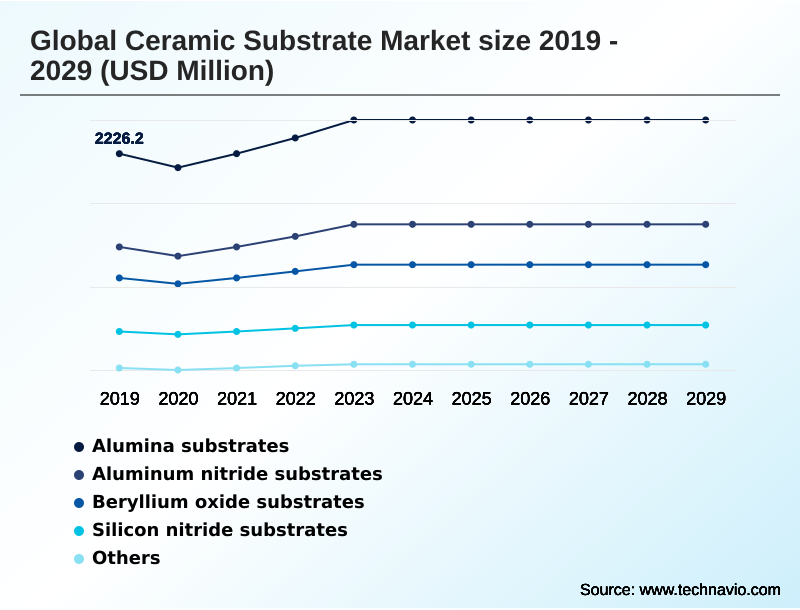
- By Product Type - Alumina substrates segment was valued at USD 2.53 billion in 2023
- By End-user - Consumer electronics segment accounted for the largest market revenue share in 2023
Market Size & Forecast
- Market Opportunities: USD 4.01 billion
- Market Future Opportunities: USD 2.88 billion
- CAGR from 2024 to 2029 : 7.3%
Market Summary
- The ceramic substrate market is undergoing robust expansion, driven by its critical role in high-technology sectors. These substrates, valued for their superior thermal management, electrical insulation, and mechanical stability, are foundational to modern electronics.
- A key driver is the global shift toward electric mobility, where ceramic materials are essential for managing heat in power modules, ensuring the reliability of EV powertrains. Simultaneously, the rollout of 5G networks and advancements in semiconductor packaging create sustained demand for substrates with excellent high-frequency performance and dimensional stability.
- A real-world business scenario involves automotive manufacturers collaborating with substrate suppliers to co-design power electronics solutions that maximize thermal efficiency, thereby extending battery range and component lifespan. While innovations in materials like silicon nitride and aluminum nitride open new application frontiers, the industry contends with manufacturing complexities and raw material cost volatility.
- This dynamic landscape requires continuous investment in R&D to meet the evolving performance demands of next-generation electronic systems, solidifying the market's position as an enabler of technological progress.
What will be the Size of the Ceramic Substrate Market during the forecast period?
Get Key Insights on Market Forecast (PDF) Get Free Sample
How is the Ceramic Substrate Market Segmented?
The ceramic substrate industry research report provides comprehensive data (region-wise segment analysis), with forecasts and estimates in "USD million" for the period 2025-2029, as well as historical data from 2019-2023 for the following segments.
- Product type
- Alumina substrates
- Aluminum nitride substrates
- Beryllium oxide substrates
- Silicon nitride substrates
- Others
- End-user
- Consumer electronics
- Automotive
- Telecom
- Others
- Application
- Light emitting diodes
- Automotive sensors
- Semiconductors
- Power modules
- RF devices
- Geography
- APAC
- China
- Japan
- India
- Europe
- Germany
- UK
- France
- North America
- US
- Canada
- Mexico
- South America
- Brazil
- Argentina
- Colombia
- Middle East and Africa
- Saudi Arabia
- UAE
- South Africa
- Rest of World (ROW)
- APAC
By Product Type Insights
The alumina substrates segment is estimated to witness significant growth during the forecast period.
Alumina substrates form the largest and most established segment, prized for their balanced cost-performance and robust properties. Their superior electrical insulation and moderate thermal conductivity make them the workhorse material for a vast array of applications.
In the power electronics solutions sector, they provide reliable platforms for industrial power modules where high power density is a key requirement.
The material's adaptability to both thick-film technology and thin-film technology enables complex circuit designs, supporting the ongoing miniaturization of electronics. This versatility extends to LED packaging and antenna modules for 5G telecommunications infrastructure.
While advanced materials offer superior thermal management in niche cases, the reliability of alumina in less-demanding environments, with process optimizations leading to a 15% reduction in metallization defects, secures its market dominance.
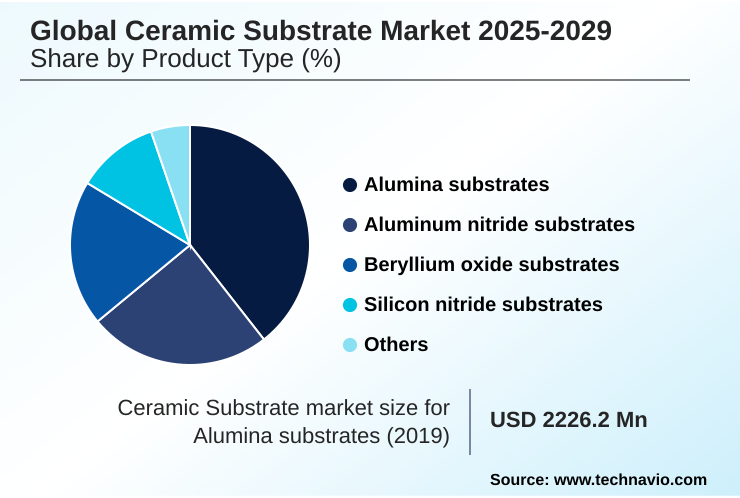
The Alumina substrates segment was valued at USD 2.53 billion in 2023 and showed a gradual increase during the forecast period.
Regional Analysis
APAC is estimated to contribute 39.2% to the growth of the global market during the forecast period.Technavio’s analysts have elaborately explained the regional trends and drivers that shape the market during the forecast period.
See How Ceramic Substrate Market Demand is Rising in APAC Get Free Sample
The geographic landscape is dominated by APAC, which accounts for over 39% of the market's incremental growth, driven by its expansive electronics manufacturing ecosystem in countries like China and Japan.
North America and Europe remain critical innovation hubs, focusing on high-value applications in aerospace and defense, such as electronic warfare systems. The US and Germany are leading the charge in developing advanced direct bonded copper technologies.
This regional focus is amplified by friendshoring policies, with North American facilities demonstrating a 10% lower defect rate in substrates designed for high thermal resistance.
These specialized applications leverage materials with superior dielectric strength, ensuring performance in demanding sectors and shaping regional competitive advantages.
Market Dynamics
Our researchers analyzed the data with 2024 as the base year, along with the key drivers, trends, and challenges. A holistic analysis of drivers will help companies refine their marketing strategies to gain a competitive advantage.
- Strategic decision-making in the global ceramic substrate market 2025-2029 requires a deep understanding of material trade-offs and manufacturing nuances. The debate over alumina vs aluminum nitride substrates continues, with cost-performance of alumina substrates making it ideal for many applications, while AlN is essential for high-power thermal management in semiconductor packaging.
- For automotive electronics, silicon nitride for automotive electronics is gaining traction due to its reliability in thermal cycling. The choice of an LTCC substrate for RF applications is driven by the need for integration in 5G components. Concurrently, advancements in direct bonded copper technology are improving performance in power modules.
- Understanding the ceramic substrate manufacturing process, including the challenges in ceramic metallization and the impact of SiC on substrate choice, is critical. For instance, firms adopting silicon carbide (SiC) devices have seen a need for substrates with thermal conductivity that is at least 5 times higher than traditional alumina.
- Emerging areas like additive manufacturing of ceramic components and laser structuring for fine-pitch circuits offer new design possibilities. However, concerns over beryllium oxide substrate toxicity concerns and efforts toward regionalization of substrate supply chains influence material selection and sourcing strategies.
- Specialized components like ceramic interposers for advanced packaging, zirconia substrates for medical sensors, and glass-ceramic for hermetic packaging represent high-margin growth segments.
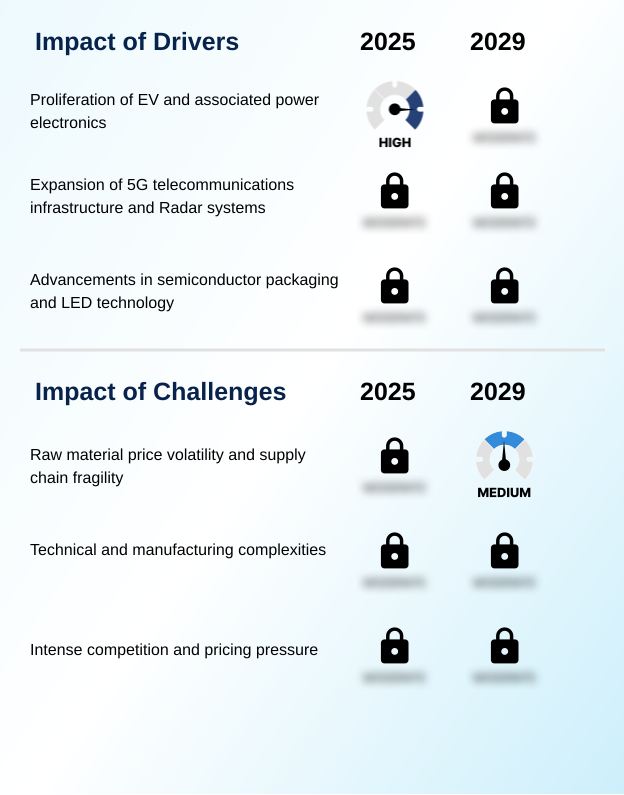
What are the key market drivers leading to the rise in the adoption of Ceramic Substrate Industry?
- The proliferation of electric vehicles and their associated power electronics is a primary driver fueling demand for advanced ceramic substrates.
- Market growth is propelled by high-technology sectors demanding greater efficiency and power. The transition to electric vehicle power electronics is a primary driver, with advanced substrates enabling power modules to achieve over 98% energy conversion efficiency.
- Simultaneously, the expansion of 5G telecommunications infrastructure requires substrates with excellent high-frequency performance to minimize signal loss in base station components like phased-array radars.
- Innovations in semiconductor packaging, including complex system-in-package modules and automotive radar systems, depend on the dimensional stability of ceramics.
- This demand is mirrored in energy-efficient power systems like photovoltaic inverters and wind turbine power converters, where robust thermal management extends operational lifespans by up to 20% compared to conventional alternatives.
What are the market trends shaping the Ceramic Substrate Industry?
- The accelerated adoption of wide bandgap semiconductors, such as silicon carbide and gallium nitride, is a dominant market trend. This shift drives demand for compatible, high-performance ceramic substrates capable of managing extreme thermal and electrical conditions.
- Key trends are reshaping the market, led by the adoption of wide bandgap semiconductors like silicon carbide devices and gallium nitride devices, which demand substrates with superior thermal capabilities. In response, advanced manufacturing is gaining traction. Additive manufacturing allows for monolithic integration of features, enabling a 30% reduction in component weight for aerospace and defense systems.
- Concurrently, laser direct structuring is creating finer circuit patterns previously unachievable. Geopolitical factors are driving a strategic shift toward supply chain resilience through regionalization and onshoring, with some firms aiming to shorten lead times by over 25%. This focus on localized, high-tech production for applications like micro-electromechanical systems is fundamentally altering the competitive landscape.
What challenges does the Ceramic Substrate Industry face during its growth?
- Raw material price volatility and supply chain fragility present a key challenge impacting the growth and profitability of the industry.
- Significant challenges persist, primarily concerning materials and manufacturing complexities. The volatile cost of high-purity ceramic powders can impact gross margins by up to 10% quarter-over-quarter, complicating financial planning. Technical hurdles in the sintering process and metallization techniques for advanced packaging architectures require substantial capital investment and expertise, particularly for achieving high fracture toughness and thermal shock resistance.
- Fabricating precision ceramic parts for high-voltage environments demands exacting process control, where minor deviations can lead to batch failure rates exceeding 5%. Furthermore, regulatory and safety protocols surrounding materials like beryllium oxide substrates add significant operational overhead, while persistent challenges in ceramic metallization affect the reliability of heat-resistant ceramic boards.
Exclusive Technavio Analysis on Customer Landscape
The ceramic substrate market forecasting report includes the adoption lifecycle of the market, covering from the innovator’s stage to the laggard’s stage. It focuses on adoption rates in different regions based on penetration. Furthermore, the ceramic substrate market report also includes key purchase criteria and drivers of price sensitivity to help companies evaluate and develop their market growth analysis strategies.
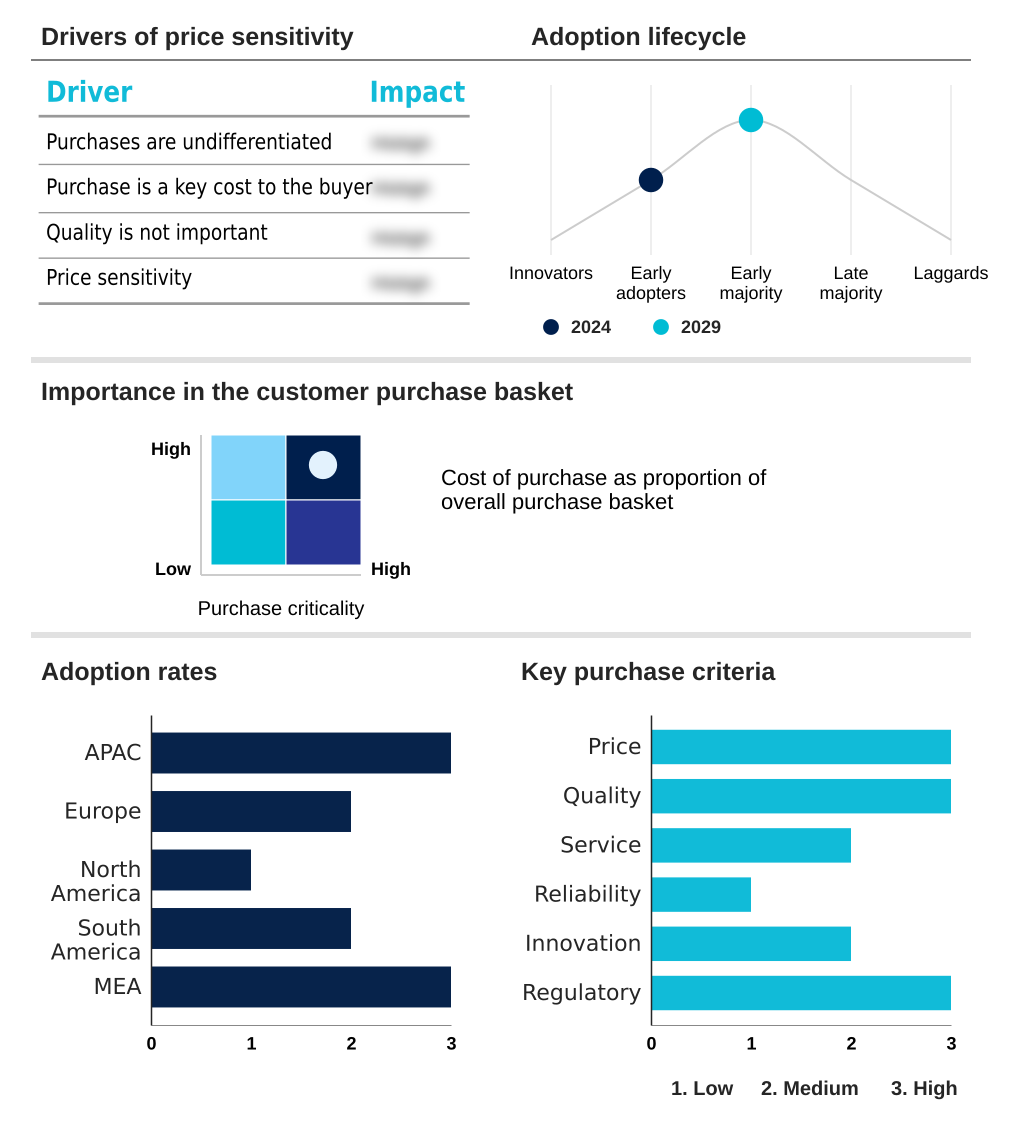
Customer Landscape of Ceramic Substrate Industry
Competitive Landscape
Companies are implementing various strategies, such as strategic alliances, ceramic substrate market forecast, partnerships, mergers and acquisitions, geographical expansion, and product/service launches, to enhance their presence in the industry.
Advanced Substrate Microtechnology Corp. - Offers specialized thick-film alumina plates catering to SiP, LiDAR, and RF device applications, addressing advanced packaging needs.
The industry research and growth report includes detailed analyses of the competitive landscape of the market and information about key companies, including:
- Advanced Substrate Microtechnology Corp.
- AGC Inc.
- Cepheus Technology Ltd.
- CeramTec GmbH
- CoorsTek Inc.
- Koa Corp.
- KYOCERA Corp.
- LEATEC Fine Ceramics Co., Ltd.
- MARUWA CO. LTD.
- Murata Manufacturing Co. Ltd.
- NGK Insulators Ltd
- NIKKO CO.
- Nippon Carbide Industries Co. Ltd.
- NTK CERAMIC CO.,LTD.
- Ortech Advanced Ceramics
- Rogers Corp.
- Stanford Advanced Materials
- TONG HSING Electronics Industries Ltd.
- TTM Technologies Inc.
- Yokowo Co. Ltd.
Qualitative and quantitative analysis of companies has been conducted to help clients understand the wider business environment as well as the strengths and weaknesses of key industry players. Data is qualitatively analyzed to categorize companies as pure play, category-focused, industry-focused, and diversified; it is quantitatively analyzed to categorize companies as dominant, leading, strong, tentative, and weak.
Recent Development and News in Ceramic substrate market
- In March 2025, CeramTec GmbH announced a strategic partnership with a leading automotive Tier-1 supplier to co-develop next-generation silicon nitride substrates for high-efficiency EV power modules.
- In January 2025, MARUWA CO. LTD. launched a new line of low-loss LTCC substrates specifically designed for 6G-ready RF front-end modules, promising a 15% reduction in signal insertion loss.
- In November 2024, CoorsTek Inc. acquired a specialized European firm focused on additive manufacturing of ceramics, strengthening its capabilities in producing complex 3D-structured substrates for aerospace applications.
- In September 2024, KYOCERA Corp. completed a major expansion of its aluminum nitride substrate production facility to meet the surging demand from the electric vehicle and industrial power electronics sectors.
Dive into Technavio’s robust research methodology, blending expert interviews, extensive data synthesis, and validated models for unparalleled Ceramic Substrate Market insights. See full methodology.
| Market Scope | |
|---|---|
| Page number | 318 |
| Base year | 2024 |
| Historic period | 2019-2023 |
| Forecast period | 2025-2029 |
| Growth momentum & CAGR | Accelerate at a CAGR of 7.3% |
| Market growth 2025-2029 | USD 2875.1 million |
| Market structure | Fragmented |
| YoY growth 2024-2025(%) | 6.7% |
| Key countries | China, Japan, India, South Korea, Indonesia, Australia, Germany, UK, France, Italy, Spain, The Netherlands, US, Canada, Mexico, Brazil, Argentina, Colombia, Saudi Arabia, UAE, South Africa, Israel and Turkey |
| Competitive landscape | Leading Companies, Market Positioning of Companies, Competitive Strategies, and Industry Risks |
Research Analyst Overview
- The ceramic substrate market is defined by continuous material innovation and its indispensable role in high-performance electronics. The market's evolution is directly tied to the demands of next-generation systems, from power modules to RF devices.
- Key materials such as alumina substrates, aluminum nitride substrates, and silicon nitride substrates each serve distinct application requirements based on properties like high thermal conductivity and electrical insulation. A critical focus for boardroom strategy is the adoption of wide bandgap semiconductors, which necessitates investment in compatible substrates to avoid performance bottlenecks.
- For example, using silicon nitride substrates in power electronics solutions can reduce thermal cycling failures by up to 25% compared to traditional materials, directly impacting product reliability and warranty costs. The development of advanced connectivity solutions depends on technologies like low-temperature co-fired ceramic and high-temperature co-fired ceramic.
- Mastery of metallization techniques, including direct bonded copper, and overcoming challenges related to thermal shock resistance and fracture toughness are paramount for competitive positioning in this dynamic and technologically demanding sector.
What are the Key Data Covered in this Ceramic Substrate Market Research and Growth Report?
-
What is the expected growth of the Ceramic Substrate Market between 2025 and 2029?
-
USD 2.88 billion, at a CAGR of 7.3%
-
-
What segmentation does the market report cover?
-
The report is segmented by Product Type (Alumina substrates, Aluminum nitride substrates, Beryllium oxide substrates, Silicon nitride substrates, and Others), End-user (Consumer electronics, Automotive, Telecom, and Others), Application (Light emitting diodes, Automotive sensors, Semiconductors, Power modules, and RF devices) and Geography (APAC, Europe, North America, South America, Middle East and Africa)
-
-
Which regions are analyzed in the report?
-
APAC, Europe, North America, South America and Middle East and Africa
-
-
What are the key growth drivers and market challenges?
-
Proliferation of EV and associated power electronics, Raw material price volatility and supply chain fragility
-
-
Who are the major players in the Ceramic Substrate Market?
-
Advanced Substrate Microtechnology Corp., AGC Inc., Cepheus Technology Ltd., CeramTec GmbH, CoorsTek Inc., Koa Corp., KYOCERA Corp., LEATEC Fine Ceramics Co., Ltd., MARUWA CO. LTD., Murata Manufacturing Co. Ltd., NGK Insulators Ltd, NIKKO CO., Nippon Carbide Industries Co. Ltd., NTK CERAMIC CO.,LTD., Ortech Advanced Ceramics, Rogers Corp., Stanford Advanced Materials, TONG HSING Electronics Industries Ltd., TTM Technologies Inc. and Yokowo Co. Ltd.
-
Market Research Insights
- The market is shaped by intense technological demands from several high-growth sectors. The push for more energy-efficient power systems is a significant dynamic, with advanced substrates enabling a 20% increase in power density for EV inverters and other electric vehicle power electronics.
- In the telecommunications sector, the need for superior high-frequency performance in 5G infrastructure is paramount, and specialized ceramics have been shown to reduce signal loss by 15% in critical antenna modules and power amplifiers compared to legacy materials.
- Innovations in advanced packaging architectures are also crucial, as the miniaturization of electronics relies on the thermal resistance and dimensional stability of ceramic components to ensure reliability, particularly within complex system-in-package modules.
We can help! Our analysts can customize this ceramic substrate market research report to meet your requirements.
 RIA -
RIA - 
