Concentrated Photovoltaic Systems Market Analysis, Size, and Forecast 2025-2029: APAC (India, China, and Japan), North America (US, Canada, and Mexico), Europe (Germany, Spain, and France), South America (Brazil and Argentina), Middle East and Africa (UAE, Saudi Arabia, and South Africa), and Rest of World (ROW)

Concentrated Photovoltaic Systems Market Analysis, Size, and Forecast 2025-2029:
APAC (India, China, and Japan), North America (US, Canada, and Mexico), Europe (Germany, Spain, and France), South America (Brazil and Argentina), Middle East and Africa (UAE, Saudi Arabia, and South Africa), and Rest of World (ROW)

Published: Dec 2025 285 Pages SKU: IRTNTR73094

Market Overview at a Glance

$1.85 B
Market Opportunity
9.9%
CAGR 2024 - 2029
53.7%
APAC Growth
$2.46 B
HCPV segment 2023

Concentrated Photovoltaic Systems Market Size 2025-2029

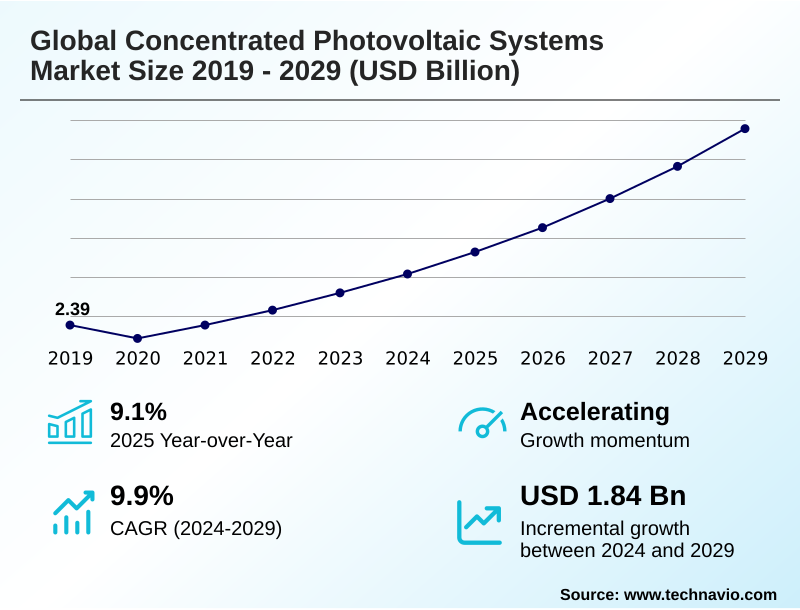
The concentrated photovoltaic systems market size is valued to increase by USD 1.85 billion, at a CAGR of 9.9% from 2024 to 2029. Advantages of CPV systems will drive the concentrated photovoltaic systems market.

Major Market Trends & Insights

  • APAC dominated the market and accounted for a 53.7% growth during the forecast period.
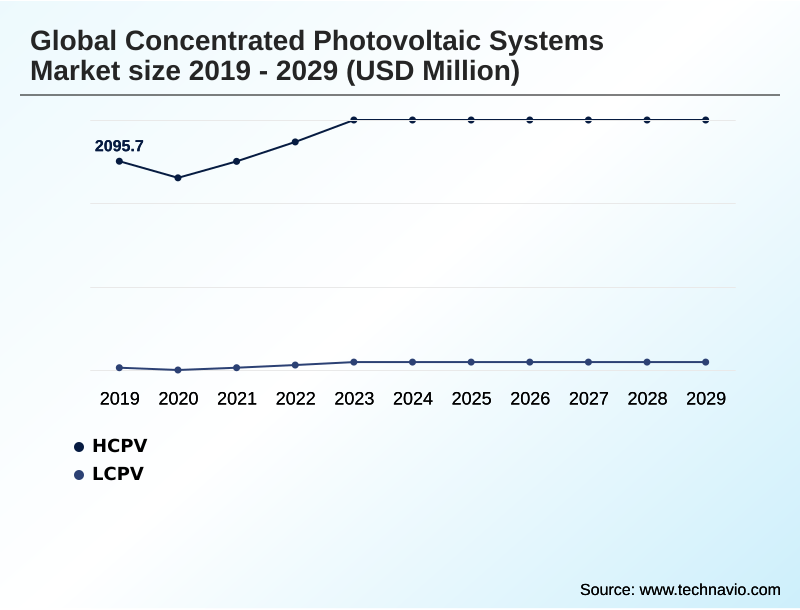
  • By Technology - HCPV segment was valued at USD 2.46 billion in 2023
  • By Application - Utility-scale power generation segment accounted for the largest market revenue share in 2023

Market Size & Forecast

  • Market Opportunities: USD 2.50 billion
  • Market Future Opportunities: USD 1.85 billion
  • CAGR from 2024 to 2029 : 9.9%

Market Summary

What will be the Size of the Concentrated Photovoltaic Systems Market during the forecast period?

Get Key Insights on Market Forecast (PDF) Request Free Sample

How is the Concentrated Photovoltaic Systems Market Segmented?

The concentrated photovoltaic systems industry research report provides comprehensive data (region-wise segment analysis), with forecasts and estimates in "USD million" for the period 2025-2029, as well as historical data from 2019-2023 for the following segments.

  • Technology
    • HCPV
    • LCPV
  • Application
    • Utility-scale power generation
    • Commercial installations
    • Remote and off-grid systems
  • Component
    • Solar cells
    • Lenses and mirrors
    • Dual-axis trackers
  • Geography
    • APAC
      • India
      • China
      • Japan
    • North America
      • US
      • Canada
      • Mexico
    • Europe
      • Germany
      • Spain
      • France
    • South America
      • Brazil
      • Argentina
    • Middle East and Africa
      • UAE
      • Saudi Arabia
      • South Africa
    • Rest of World (ROW)

By Technology Insights

The hcpv segment is estimated to witness significant growth during the forecast period.

Request Free Sample

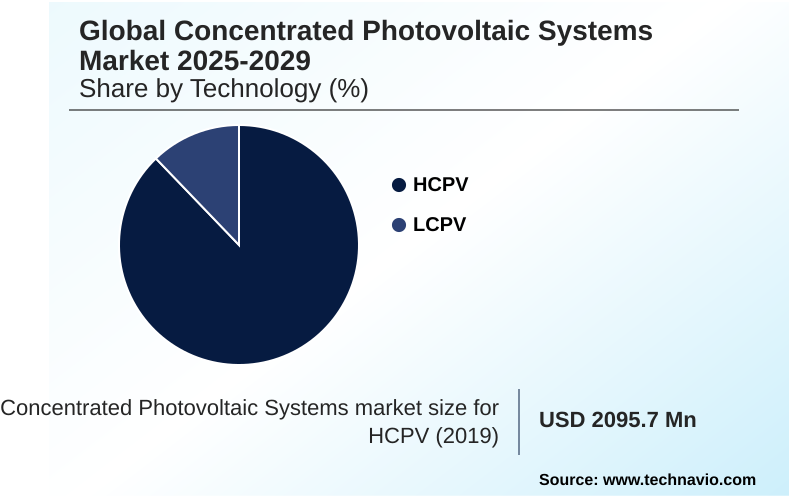
The HCPV segment was valued at USD 2.46 billion in 2023 and showed a gradual increase during the forecast period.

Request Free Sample

Regional Analysis

APAC is estimated to contribute 53.7% to the growth of the global market during the forecast period.Technavio’s analysts have elaborately explained the regional trends and drivers that shape the market during the forecast period.

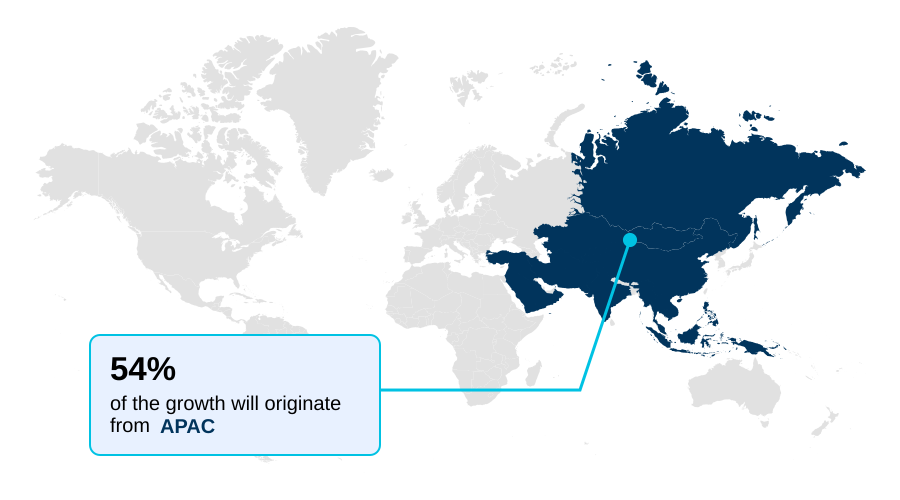
See How Concentrated Photovoltaic Systems Market Demand is Rising in APAC Request Free Sample

Market Dynamics

Our researchers analyzed the data with 2024 as the base year, along with the key drivers, trends, and challenges. A holistic analysis of drivers will help companies refine their marketing strategies to gain a competitive advantage.

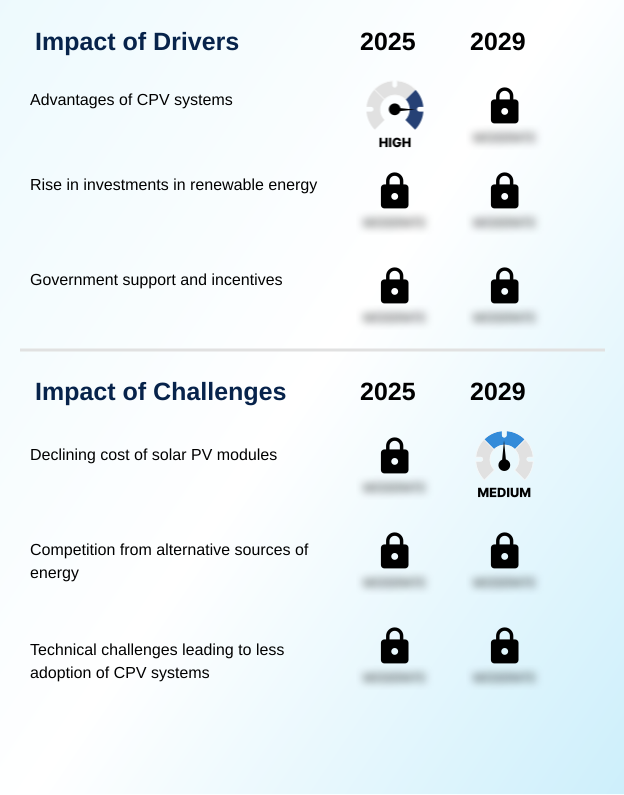
What are the key market drivers leading to the rise in the adoption of Concentrated Photovoltaic Systems Industry?

What are the market trends shaping the Concentrated Photovoltaic Systems Industry?

What challenges does the Concentrated Photovoltaic Systems Industry face during its growth?

Exclusive Technavio Analysis on Customer Landscape

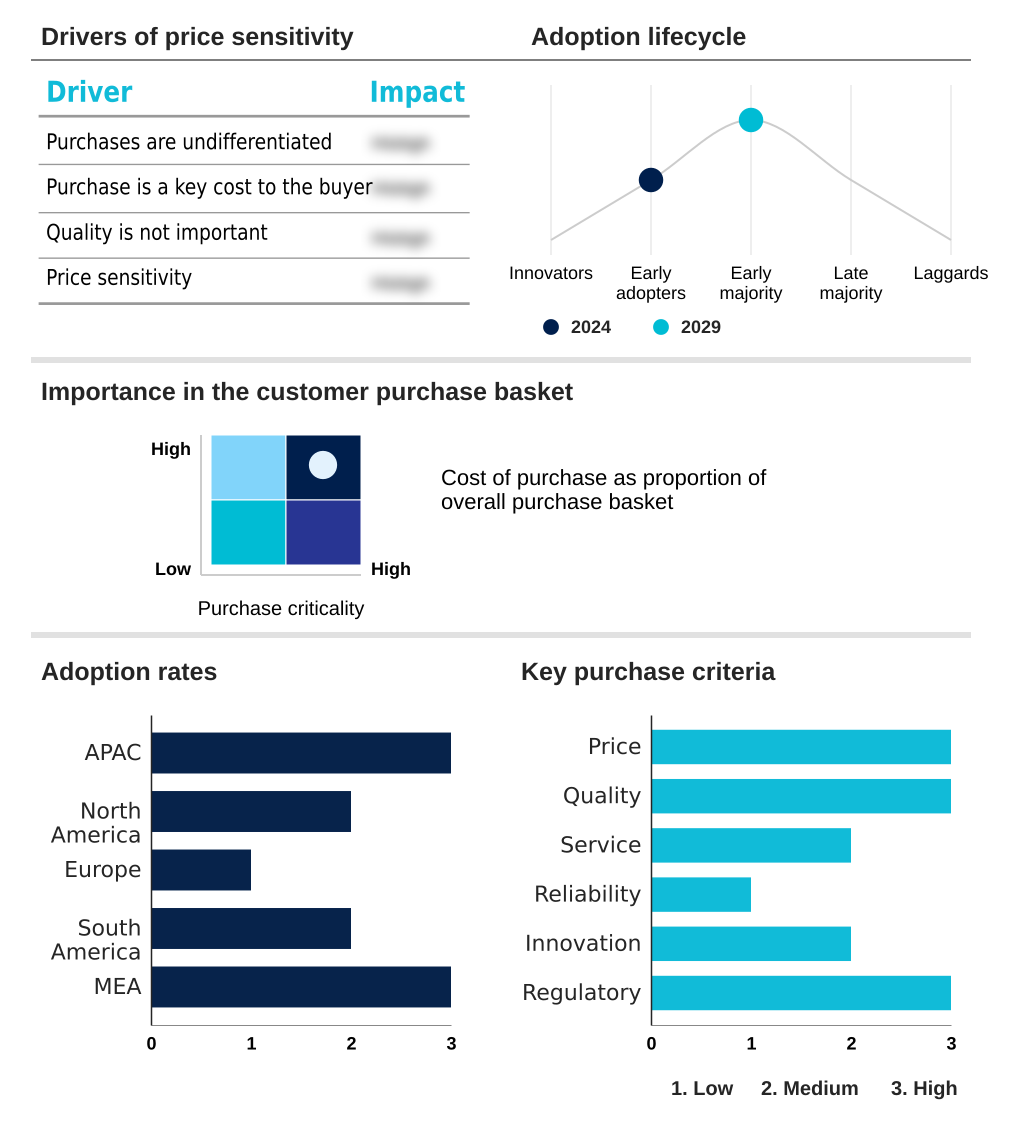
The concentrated photovoltaic systems market forecasting report includes the adoption lifecycle of the market, covering from the innovator’s stage to the laggard’s stage. It focuses on adoption rates in different regions based on penetration. Furthermore, the concentrated photovoltaic systems market report also includes key purchase criteria and drivers of price sensitivity to help companies evaluate and develop their market growth analysis strategies.

Customer Landscape of Concentrated Photovoltaic Systems Industry

Competitive Landscape

Companies are implementing various strategies, such as strategic alliances, concentrated photovoltaic systems market forecast, partnerships, mergers and acquisitions, geographical expansion, and product/service launches, to enhance their presence in the industry.

ARIMA Group -

The industry research and growth report includes detailed analyses of the competitive landscape of the market and information about key companies, including:

  • ARIMA Group
  • Arzon Solar LLC
  • BSQ Solar
  • Chiyoda Corp.
  • Cool Earth Solar
  • Green Rhino Energy Ltd.
  • Macsun Solar Energy Tech Co. Ltd.
  • Ravano Green Powers
  • Saint Augustin Canada Electric Inc.
  • Sanan Optoelectronics Co. Ltd.
  • Siemens Energy AG
  • Solartron Energy
  • Sumitomo Electric Industries Ltd.
  • Valldoreix Greenpower SLU
  • Whitefield Solar
  • Zytech Solar

Qualitative and quantitative analysis of companies has been conducted to help clients understand the wider business environment as well as the strengths and weaknesses of key industry players. Data is qualitatively analyzed to categorize companies as pure play, category-focused, industry-focused, and diversified; it is quantitatively analyzed to categorize companies as dominant, leading, strong, tentative, and weak.

Recent Development and News in Concentrated photovoltaic systems market

Dive into Technavio’s robust research methodology, blending expert interviews, extensive data synthesis, and validated models for unparalleled Concentrated Photovoltaic Systems Market insights. See full methodology.

Market Scope
Page number 285
Base year 2024
Historic period 2019-2023
Forecast period 2025-2029
Growth momentum & CAGR Accelerate at a CAGR of 9.9%
Market growth 2025-2029 USD 1845.0 million
Market structure Fragmented
YoY growth 2024-2025(%) 9.1%
Key countries India, China, Japan, South Korea, Australia, Indonesia, US, Canada, Mexico, Germany, Spain, France, Italy, The Netherlands, UK, Brazil, Argentina, Chile, UAE, Saudi Arabia, Egypt, South Africa and Morocco
Competitive landscape Leading Companies, Market Positioning of Companies, Competitive Strategies, and Industry Risks

Request Free Sample

Research Analyst Overview

What are the Key Data Covered in this Concentrated Photovoltaic Systems Market Research and Growth Report?

  • What is the expected growth of the Concentrated Photovoltaic Systems Market between 2025 and 2029?

    • USD 1.85 billion, at a CAGR of 9.9%

  • What segmentation does the market report cover?

    • The report is segmented by Technology (HCPV, and LCPV), Application (Utility-scale power generation, Commercial installations, and Remote and off-grid systems), Component (Solar cells, Lenses and mirrors, and Dual-axis trackers) and Geography (APAC, North America, Europe, South America, Middle East and Africa)

  • Which regions are analyzed in the report?

    • APAC, North America, Europe, South America and Middle East and Africa

  • What are the key growth drivers and market challenges?

    • Advantages of CPV systems, Declining cost of solar PV modules

  • Who are the major players in the Concentrated Photovoltaic Systems Market?

    • ARIMA Group, Arzon Solar LLC, BSQ Solar, Chiyoda Corp., Cool Earth Solar, Green Rhino Energy Ltd., Macsun Solar Energy Tech Co. Ltd., Ravano Green Powers, Saint Augustin Canada Electric Inc., Sanan Optoelectronics Co. Ltd., Siemens Energy AG, Solartron Energy, Sumitomo Electric Industries Ltd., Valldoreix Greenpower SLU, Whitefield Solar and Zytech Solar

Market Research Insights

We can help! Our analysts can customize this concentrated photovoltaic systems market research report to meet your requirements.

Get in touch

1. Executive Summary

1.1 Market overview

Executive Summary - Chart on Market Overview
Executive Summary - Data Table on Market Overview
Executive Summary - Chart on Global Market Characteristics
Executive Summary - Chart on Market by Geography
Executive Summary - Chart on Market Segmentation by Technology
Executive Summary - Chart on Market Segmentation by Application
Executive Summary - Chart on Market Segmentation by Component
Executive Summary - Chart on Incremental Growth
Executive Summary - Data Table on Incremental Growth
Executive Summary - Chart on Company Market Positioning

2. Technavio Analysis

2.1 Analysis of price sensitivity, lifecycle, customer purchase basket, adoption rates, and purchase criteria

2.2 Criticality of inputs and Factors of differentiation

Chart on Overview on criticality of inputs and factors of differentiation

2.3 Factors of disruption

Chart on Overview on factors of disruption

2.4 Impact of drivers and challenges

Chart on Impact of drivers and challenges in 2024 and 2029

3. Market Landscape

3.1 Market ecosystem

Chart on Parent Market
Data Table on - Parent Market

3.2 Market characteristics

Chart on Market characteristics analysis

3.3 Value chain analysis

Chart on Value chain analysis

4. Market Sizing

4.1 Market definition

Data Table on Offerings of companies included in the market definition

4.2 Market segment analysis

Market segments

4.3 Market size 2024

4.4 Market outlook: Forecast for 2024-2029

Chart on Global - Market size and forecast 2024-2029 ($ million)
Data Table on Global - Market size and forecast 2024-2029 ($ million)
Chart on Global Market: Year-over-year growth 2024-2029 (%)
Data Table on Global Market: Year-over-year growth 2024-2029 (%)

5. Historic Market Size

5.1 Global Concentrated Photovoltaic Systems Market 2019 - 2023

Historic Market Size - Data Table on Global Concentrated Photovoltaic Systems Market 2019 - 2023 ($ million)

5.2 Technology segment analysis 2019 - 2023

Historic Market Size - Technology Segment 2019 - 2023 ($ million)

5.3 Application segment analysis 2019 - 2023

Historic Market Size - Application Segment 2019 - 2023 ($ million)

5.4 Component segment analysis 2019 - 2023

Historic Market Size - Component Segment 2019 - 2023 ($ million)

5.5 Geography segment analysis 2019 - 2023

Historic Market Size - Geography Segment 2019 - 2023 ($ million)

5.6 Country segment analysis 2019 - 2023

Historic Market Size - Country Segment 2019 - 2023 ($ million)

6. Qualitative Analysis

6.1 Impact of AI on the global concentrated photovoltaic systems market

7. Five Forces Analysis

7.1 Five forces summary

Five forces analysis - Comparison between 2024 and 2029

7.2 Bargaining power of buyers

Bargaining power of buyers - Impact of key factors 2024 and 2029

7.3 Bargaining power of suppliers

Bargaining power of suppliers - Impact of key factors in 2024 and 2029

7.4 Threat of new entrants

Threat of new entrants - Impact of key factors in 2024 and 2029

7.5 Threat of substitutes

Threat of substitutes - Impact of key factors in 2024 and 2029

7.6 Threat of rivalry

Threat of rivalry - Impact of key factors in 2024 and 2029

7.7 Market condition

Chart on Market condition - Five forces 2024 and 2029

8. Market Segmentation by Technology

8.1 Market segments

Chart on Technology - Market share 2024-2029 (%)
Data Table on Technology - Market share 2024-2029 (%)

8.2 Comparison by Technology

Chart on Comparison by Technology
Data Table on Comparison by Technology

8.3 HCPV - Market size and forecast 2024-2029

Chart on HCPV - Market size and forecast 2024-2029 ($ million)
Data Table on HCPV - Market size and forecast 2024-2029 ($ million)
Chart on HCPV - Year-over-year growth 2024-2029 (%)
Data Table on HCPV - Year-over-year growth 2024-2029 (%)

8.4 LCPV - Market size and forecast 2024-2029

Chart on LCPV - Market size and forecast 2024-2029 ($ million)
Data Table on LCPV - Market size and forecast 2024-2029 ($ million)
Chart on LCPV - Year-over-year growth 2024-2029 (%)
Data Table on LCPV - Year-over-year growth 2024-2029 (%)

8.5 Market opportunity by Technology

Market opportunity by Technology ($ million)
Data Table on Market opportunity by Technology ($ million)

9. Market Segmentation by Application

9.1 Market segments

Chart on Application - Market share 2024-2029 (%)
Data Table on Application - Market share 2024-2029 (%)

9.2 Comparison by Application

Chart on Comparison by Application
Data Table on Comparison by Application

9.3 Utility-scale power generation - Market size and forecast 2024-2029

Chart on Utility-scale power generation - Market size and forecast 2024-2029 ($ million)
Data Table on Utility-scale power generation - Market size and forecast 2024-2029 ($ million)
Chart on Utility-scale power generation - Year-over-year growth 2024-2029 (%)
Data Table on Utility-scale power generation - Year-over-year growth 2024-2029 (%)

9.4 Commercial installations - Market size and forecast 2024-2029

Chart on Commercial installations - Market size and forecast 2024-2029 ($ million)
Data Table on Commercial installations - Market size and forecast 2024-2029 ($ million)
Chart on Commercial installations - Year-over-year growth 2024-2029 (%)
Data Table on Commercial installations - Year-over-year growth 2024-2029 (%)

9.5 Remote and off-grid systems - Market size and forecast 2024-2029

Chart on Remote and off-grid systems - Market size and forecast 2024-2029 ($ million)
Data Table on Remote and off-grid systems - Market size and forecast 2024-2029 ($ million)
Chart on Remote and off-grid systems - Year-over-year growth 2024-2029 (%)
Data Table on Remote and off-grid systems - Year-over-year growth 2024-2029 (%)

9.6 Market opportunity by Application

Market opportunity by Application ($ million)
Data Table on Market opportunity by Application ($ million)

10. Market Segmentation by Component

10.1 Market segments

Chart on Component - Market share 2024-2029 (%)
Data Table on Component - Market share 2024-2029 (%)

10.2 Comparison by Component

Chart on Comparison by Component
Data Table on Comparison by Component

10.3 Solar cells - Market size and forecast 2024-2029

Chart on Solar cells - Market size and forecast 2024-2029 ($ million)
Data Table on Solar cells - Market size and forecast 2024-2029 ($ million)
Chart on Solar cells - Year-over-year growth 2024-2029 (%)
Data Table on Solar cells - Year-over-year growth 2024-2029 (%)

10.4 Lenses and mirrors - Market size and forecast 2024-2029

Chart on Lenses and mirrors - Market size and forecast 2024-2029 ($ million)
Data Table on Lenses and mirrors - Market size and forecast 2024-2029 ($ million)
Chart on Lenses and mirrors - Year-over-year growth 2024-2029 (%)
Data Table on Lenses and mirrors - Year-over-year growth 2024-2029 (%)

10.5 Dual-axis trackers - Market size and forecast 2024-2029

Chart on Dual-axis trackers - Market size and forecast 2024-2029 ($ million)
Data Table on Dual-axis trackers - Market size and forecast 2024-2029 ($ million)
Chart on Dual-axis trackers - Year-over-year growth 2024-2029 (%)
Data Table on Dual-axis trackers - Year-over-year growth 2024-2029 (%)

10.6 Market opportunity by Component

Market opportunity by Component ($ million)
Data Table on Market opportunity by Component ($ million)

11. Customer Landscape

11.1 Customer landscape overview

Analysis of price sensitivity, lifecycle, customer purchase basket, adoption rates, and purchase criteria

12. Geographic Landscape

12.1 Geographic segmentation

Chart on Market share by geography 2024-2029 (%)
Data Table on Market share by geography 2024-2029 (%)

12.2 Geographic comparison

Chart on Geographic comparison
Data Table on Geographic comparison

12.3 APAC - Market size and forecast 2024-2029

Chart on APAC - Market size and forecast 2024-2029 ($ million)
Data Table on APAC - Market size and forecast 2024-2029 ($ million)
Chart on APAC - Year-over-year growth 2024-2029 (%)
Data Table on APAC - Year-over-year growth 2024-2029 (%)
Chart on Regional Comparison - APAC
Data Table on Regional Comparison - APAC

12.3.1 India - Market size and forecast 2024-2029

Chart on India - Market size and forecast 2024-2029 ($ million)
Data Table on India - Market size and forecast 2024-2029 ($ million)
Chart on India - Year-over-year growth 2024-2029 (%)
Data Table on India - Year-over-year growth 2024-2029 (%)

12.3.2 China - Market size and forecast 2024-2029

Chart on China - Market size and forecast 2024-2029 ($ million)
Data Table on China - Market size and forecast 2024-2029 ($ million)
Chart on China - Year-over-year growth 2024-2029 (%)
Data Table on China - Year-over-year growth 2024-2029 (%)

12.3.3 Japan - Market size and forecast 2024-2029

Chart on Japan - Market size and forecast 2024-2029 ($ million)
Data Table on Japan - Market size and forecast 2024-2029 ($ million)
Chart on Japan - Year-over-year growth 2024-2029 (%)
Data Table on Japan - Year-over-year growth 2024-2029 (%)

12.3.4 South Korea - Market size and forecast 2024-2029

Chart on South Korea - Market size and forecast 2024-2029 ($ million)
Data Table on South Korea - Market size and forecast 2024-2029 ($ million)
Chart on South Korea - Year-over-year growth 2024-2029 (%)
Data Table on South Korea - Year-over-year growth 2024-2029 (%)

12.3.5 Australia - Market size and forecast 2024-2029

Chart on Australia - Market size and forecast 2024-2029 ($ million)
Data Table on Australia - Market size and forecast 2024-2029 ($ million)
Chart on Australia - Year-over-year growth 2024-2029 (%)
Data Table on Australia - Year-over-year growth 2024-2029 (%)

12.3.6 Indonesia - Market size and forecast 2024-2029

Chart on Indonesia - Market size and forecast 2024-2029 ($ million)
Data Table on Indonesia - Market size and forecast 2024-2029 ($ million)
Chart on Indonesia - Year-over-year growth 2024-2029 (%)
Data Table on Indonesia - Year-over-year growth 2024-2029 (%)

12.4 North America - Market size and forecast 2024-2029

Chart on North America - Market size and forecast 2024-2029 ($ million)
Data Table on North America - Market size and forecast 2024-2029 ($ million)
Chart on North America - Year-over-year growth 2024-2029 (%)
Data Table on North America - Year-over-year growth 2024-2029 (%)
Chart on Regional Comparison - North America
Data Table on Regional Comparison - North America

12.4.1 US - Market size and forecast 2024-2029

Chart on US - Market size and forecast 2024-2029 ($ million)
Data Table on US - Market size and forecast 2024-2029 ($ million)
Chart on US - Year-over-year growth 2024-2029 (%)
Data Table on US - Year-over-year growth 2024-2029 (%)

12.4.2 Canada - Market size and forecast 2024-2029

Chart on Canada - Market size and forecast 2024-2029 ($ million)
Data Table on Canada - Market size and forecast 2024-2029 ($ million)
Chart on Canada - Year-over-year growth 2024-2029 (%)
Data Table on Canada - Year-over-year growth 2024-2029 (%)

12.4.3 Mexico - Market size and forecast 2024-2029

Chart on Mexico - Market size and forecast 2024-2029 ($ million)
Data Table on Mexico - Market size and forecast 2024-2029 ($ million)
Chart on Mexico - Year-over-year growth 2024-2029 (%)
Data Table on Mexico - Year-over-year growth 2024-2029 (%)

12.5 Europe - Market size and forecast 2024-2029

Chart on Europe - Market size and forecast 2024-2029 ($ million)
Data Table on Europe - Market size and forecast 2024-2029 ($ million)
Chart on Europe - Year-over-year growth 2024-2029 (%)
Data Table on Europe - Year-over-year growth 2024-2029 (%)
Chart on Regional Comparison - Europe
Data Table on Regional Comparison - Europe

12.5.1 Germany - Market size and forecast 2024-2029

Chart on Germany - Market size and forecast 2024-2029 ($ million)
Data Table on Germany - Market size and forecast 2024-2029 ($ million)
Chart on Germany - Year-over-year growth 2024-2029 (%)
Data Table on Germany - Year-over-year growth 2024-2029 (%)

12.5.2 Spain - Market size and forecast 2024-2029

Chart on Spain - Market size and forecast 2024-2029 ($ million)
Data Table on Spain - Market size and forecast 2024-2029 ($ million)
Chart on Spain - Year-over-year growth 2024-2029 (%)
Data Table on Spain - Year-over-year growth 2024-2029 (%)

12.5.3 France - Market size and forecast 2024-2029

Chart on France - Market size and forecast 2024-2029 ($ million)
Data Table on France - Market size and forecast 2024-2029 ($ million)
Chart on France - Year-over-year growth 2024-2029 (%)
Data Table on France - Year-over-year growth 2024-2029 (%)

12.5.4 Italy - Market size and forecast 2024-2029

Chart on Italy - Market size and forecast 2024-2029 ($ million)
Data Table on Italy - Market size and forecast 2024-2029 ($ million)
Chart on Italy - Year-over-year growth 2024-2029 (%)
Data Table on Italy - Year-over-year growth 2024-2029 (%)

12.5.5 The Netherlands - Market size and forecast 2024-2029

Chart on The Netherlands - Market size and forecast 2024-2029 ($ million)
Data Table on The Netherlands - Market size and forecast 2024-2029 ($ million)
Chart on The Netherlands - Year-over-year growth 2024-2029 (%)
Data Table on The Netherlands - Year-over-year growth 2024-2029 (%)

12.5.6 UK - Market size and forecast 2024-2029

Chart on UK - Market size and forecast 2024-2029 ($ million)
Data Table on UK - Market size and forecast 2024-2029 ($ million)
Chart on UK - Year-over-year growth 2024-2029 (%)
Data Table on UK - Year-over-year growth 2024-2029 (%)

12.6 South America - Market size and forecast 2024-2029

Chart on South America - Market size and forecast 2024-2029 ($ million)
Data Table on South America - Market size and forecast 2024-2029 ($ million)
Chart on South America - Year-over-year growth 2024-2029 (%)
Data Table on South America - Year-over-year growth 2024-2029 (%)
Chart on Regional Comparison - South America
Data Table on Regional Comparison - South America

12.6.1 Brazil - Market size and forecast 2024-2029

Chart on Brazil - Market size and forecast 2024-2029 ($ million)
Data Table on Brazil - Market size and forecast 2024-2029 ($ million)
Chart on Brazil - Year-over-year growth 2024-2029 (%)
Data Table on Brazil - Year-over-year growth 2024-2029 (%)

12.6.2 Argentina - Market size and forecast 2024-2029

Chart on Argentina - Market size and forecast 2024-2029 ($ million)
Data Table on Argentina - Market size and forecast 2024-2029 ($ million)
Chart on Argentina - Year-over-year growth 2024-2029 (%)
Data Table on Argentina - Year-over-year growth 2024-2029 (%)

12.6.3 Chile - Market size and forecast 2024-2029

Chart on Chile - Market size and forecast 2024-2029 ($ million)
Data Table on Chile - Market size and forecast 2024-2029 ($ million)
Chart on Chile - Year-over-year growth 2024-2029 (%)
Data Table on Chile - Year-over-year growth 2024-2029 (%)

12.7 Middle East and Africa - Market size and forecast 2024-2029

Chart on Middle East and Africa - Market size and forecast 2024-2029 ($ million)
Data Table on Middle East and Africa - Market size and forecast 2024-2029 ($ million)
Chart on Middle East and Africa - Year-over-year growth 2024-2029 (%)
Data Table on Middle East and Africa - Year-over-year growth 2024-2029 (%)
Chart on Regional Comparison - Middle East and Africa
Data Table on Regional Comparison - Middle East and Africa

12.7.1 UAE - Market size and forecast 2024-2029

Chart on UAE - Market size and forecast 2024-2029 ($ million)
Data Table on UAE - Market size and forecast 2024-2029 ($ million)
Chart on UAE - Year-over-year growth 2024-2029 (%)
Data Table on UAE - Year-over-year growth 2024-2029 (%)

12.7.2 Saudi Arabia - Market size and forecast 2024-2029

Chart on Saudi Arabia - Market size and forecast 2024-2029 ($ million)
Data Table on Saudi Arabia - Market size and forecast 2024-2029 ($ million)
Chart on Saudi Arabia - Year-over-year growth 2024-2029 (%)
Data Table on Saudi Arabia - Year-over-year growth 2024-2029 (%)

12.7.3 Egypt - Market size and forecast 2024-2029

Chart on Egypt - Market size and forecast 2024-2029 ($ million)
Data Table on Egypt - Market size and forecast 2024-2029 ($ million)
Chart on Egypt - Year-over-year growth 2024-2029 (%)
Data Table on Egypt - Year-over-year growth 2024-2029 (%)

12.7.4 South Africa - Market size and forecast 2024-2029

Chart on South Africa - Market size and forecast 2024-2029 ($ million)
Data Table on South Africa - Market size and forecast 2024-2029 ($ million)
Chart on South Africa - Year-over-year growth 2024-2029 (%)
Data Table on South Africa - Year-over-year growth 2024-2029 (%)

12.7.5 Morocco - Market size and forecast 2024-2029

Chart on Morocco - Market size and forecast 2024-2029 ($ million)
Data Table on Morocco - Market size and forecast 2024-2029 ($ million)
Chart on Morocco - Year-over-year growth 2024-2029 (%)
Data Table on Morocco - Year-over-year growth 2024-2029 (%)

12.8 Market opportunity by geography

Market opportunity by geography ($ million)
Data Tables on Market opportunity by geography ($ million)

13. Drivers, Challenges, and Opportunity

13.1 Market drivers

Advantages of CPV systems
Rise in investments in renewable energy
Government support and incentives

13.2 Market challenges

Declining cost of solar PV modules
Competition from alternative sources of energy
Technical challenges leading to less adoption of CPV systems

13.3 Impact of drivers and challenges

Impact of drivers and challenges in 2024 and 2029

13.4 Market opportunities

Hybrid CPV systems
Increasing investments in renewable energy in APAC
Development of solar cities and zero-energy buildings (ZEBs)

14. Competitive Landscape

14.1 Overview

14.2

Overview on criticality of inputs and factors of differentiation

14.3 Landscape disruption

Overview on factors of disruption

14.4 Industry risks

Impact of key risks on business

15. Competitive Analysis

15.1 Companies profiled

Companies covered

15.2 Company ranking index

15.3 Market positioning of companies

Matrix on companies position and classification

15.4 ARIMA Group

ARIMA Group - Overview
ARIMA Group - Product / Service
ARIMA Group - Key offerings
SWOT

15.5 Arzon Solar LLC

Arzon Solar LLC - Overview
Arzon Solar LLC - Product / Service
Arzon Solar LLC - Key offerings
SWOT

15.6 BSQ Solar

BSQ Solar - Overview
BSQ Solar - Product / Service
BSQ Solar - Key offerings
SWOT

15.7 Chiyoda Corp.

Chiyoda Corp. - Overview
Chiyoda Corp. - Business segments
Chiyoda Corp. - Key offerings
Chiyoda Corp. - Segment focus
SWOT

15.8 Cool Earth Solar

Cool Earth Solar - Overview
Cool Earth Solar - Product / Service
Cool Earth Solar - Key offerings
SWOT

15.9 Green Rhino Energy Ltd.

Green Rhino Energy Ltd. - Overview
Green Rhino Energy Ltd. - Product / Service
Green Rhino Energy Ltd. - Key offerings
SWOT

15.10 Macsun Solar Energy Tech Co. Ltd.

Macsun Solar Energy Tech Co. Ltd. - Overview
Macsun Solar Energy Tech Co. Ltd. - Product / Service
Macsun Solar Energy Tech Co. Ltd. - Key offerings
SWOT

15.11 Ravano Green Powers

Ravano Green Powers - Overview
Ravano Green Powers - Product / Service
Ravano Green Powers - Key offerings
SWOT

15.12 Saint Augustin Canada Electric Inc.

Saint Augustin Canada Electric Inc. - Overview
Saint Augustin Canada Electric Inc. - Product / Service
Saint Augustin Canada Electric Inc. - Key offerings
SWOT

15.13 Sanan Optoelectronics Co. Ltd.

Sanan Optoelectronics Co. Ltd. - Overview
Sanan Optoelectronics Co. Ltd. - Product / Service
Sanan Optoelectronics Co. Ltd. - Key offerings
SWOT

15.14 Solartron Energy

Solartron Energy - Overview
Solartron Energy - Product / Service
Solartron Energy - Key offerings
SWOT

15.15 Sumitomo Electric Industries Ltd.

Sumitomo Electric Industries Ltd. - Overview
Sumitomo Electric Industries Ltd. - Business segments
Sumitomo Electric Industries Ltd. - Key news
Sumitomo Electric Industries Ltd. - Key offerings
Sumitomo Electric Industries Ltd. - Segment focus
SWOT

15.16 Valldoreix Greenpower SLU

Valldoreix Greenpower SLU - Overview
Valldoreix Greenpower SLU - Product / Service
Valldoreix Greenpower SLU - Key offerings
SWOT

15.17 Whitefield Solar

Whitefield Solar - Overview
Whitefield Solar - Product / Service
Whitefield Solar - Key offerings
SWOT

15.18 Zytech Solar

Zytech Solar - Overview
Zytech Solar - Product / Service
Zytech Solar - Key offerings
SWOT

16. Appendix

16.1 Scope of the report

Market definition
Objectives
Notes and caveats

16.2 Inclusions and exclusions checklist

Inclusions checklist
Exclusions checklist

16.3 Currency conversion rates for US$

16.4 Research methodology

16.5 Data procurement

Information sources

16.6 Data validation

16.7 Validation techniques employed for market sizing

16.8 Data synthesis

16.9 360 degree market analysis

16.10 List of abbreviations

Research Methodology

Technavio presents a detailed picture of the market by way of study, synthesis, and summation of data from multiple sources. The analysts have presented the various facets of the market with a particular focus on identifying the key industry influencers. The data thus presented is comprehensive, reliable, and the result of extensive research, both primary and secondary.

INFORMATION SOURCES

Primary sources

  • Manufacturers and suppliers
  • Channel partners
  • Industry experts
  • Strategic decision makers

Secondary sources

  • Industry journals and periodicals
  • Government data
  • Financial reports of key industry players
  • Historical data
  • Press releases

DATA ANALYSIS

Data Synthesis

  • Collation of data
  • Estimation of key figures
  • Analysis of derived insights

Data Validation

  • Triangulation with data models
  • Reference against proprietary databases
  • Corroboration with industry experts

REPORT WRITING

Qualitative

  • Market drivers
  • Market challenges
  • Market trends
  • Five forces analysis

Quantitative

  • Market size and forecast
  • Market segmentation
  • Geographical insights
  • Competitive landscape

Interested in this report?

Get your sample now to see our research methodology and insights!

Download Now

Frequently Asked Questions

Concentrated Photovoltaic Systems market growth will increase by USD 1845.0 million during 2025-2029 .

The Concentrated Photovoltaic Systems market is expected to grow at a CAGR of 9.9% during 2025-2029 .

Concentrated Photovoltaic Systems market is segmented by Technology (HCPV, LCPV) Application (Utility-scale power generation, Commercial installations, Remote and off-grid systems) Component (Solar cells, Lenses and mirrors, Dual-axis trackers)

ARIMA Group, Arzon Solar LLC, BSQ Solar, Chiyoda Corp., Cool Earth Solar, Green Rhino Energy Ltd., Macsun Solar Energy Tech Co. Ltd., Ravano Green Powers, Saint Augustin Canada Electric Inc., Sanan Optoelectronics Co. Ltd., Siemens Energy AG, Solartron Energy, Sumitomo Electric Industries Ltd., Valldoreix Greenpower SLU, Whitefield Solar, Zytech Solar are a few of the key vendors in the Concentrated Photovoltaic Systems market.

APAC will register the highest growth rate of 53.7% among the other regions. Therefore, the Concentrated Photovoltaic Systems market in APAC is expected to garner significant business opportunities for the vendors during the forecast period.

India, China, Japan, South Korea, Australia, Indonesia, US, Canada, Mexico, Germany, Spain, France, Italy, The Netherlands, UK, Brazil, Argentina, Chile, UAE, Saudi Arabia, Egypt, South Africa, Morocco

  • Advantages of CPV systems is the driving factor this market.

The Concentrated Photovoltaic Systems market vendors should focus on grabbing business opportunities from the Technology segment as it accounted for the largest market share in the base year.