Connected Apparel Market Analysis, Size, and Forecast 2026-2030: North America (US, Canada, and Mexico), Europe (Germany, UK, and France), APAC (China, India, and Japan), Middle East and Africa (Saudi Arabia, UAE, and South Africa), South America (Brazil, Argentina, and Colombia), and Rest of World (ROW)

Connected Apparel Market Analysis, Size, and Forecast 2026-2030:
North America (US, Canada, and Mexico), Europe (Germany, UK, and France), APAC (China, India, and Japan), Middle East and Africa (Saudi Arabia, UAE, and South Africa), South America (Brazil, Argentina, and Colombia), and Rest of World (ROW)

Published: Dec 2025 296 Pages SKU: IRTNTR81166

Market Overview at a Glance

$7.60 B
Market Opportunity
27.5%
CAGR 2025 - 2030
35.5%
North America Growth
$1.47 B
Clothing segment 2024

Connected Apparel Market Size 2026-2030

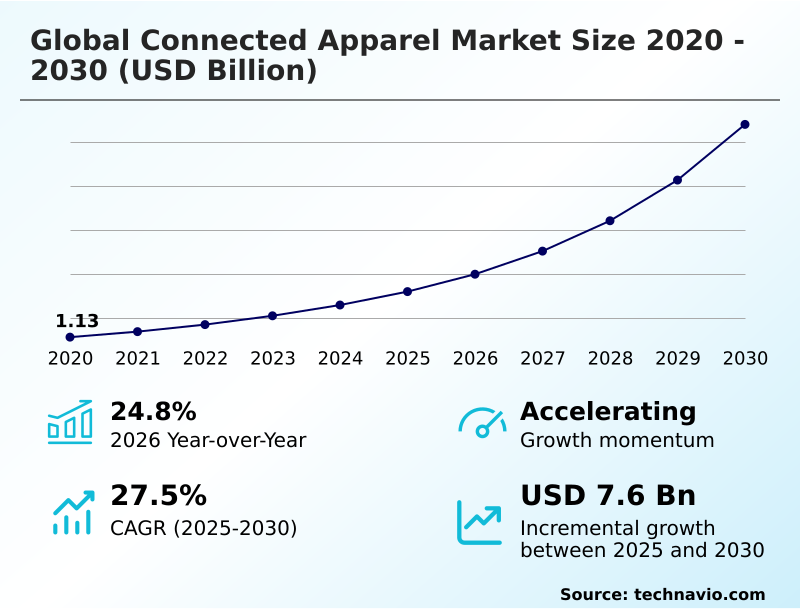
The connected apparel market size is valued to increase by USD 7.60 billion, at a CAGR of 27.5% from 2025 to 2030. Increasing consumer focus on health, fitness, and personalized wellness will drive the connected apparel market.

Major Market Trends & Insights

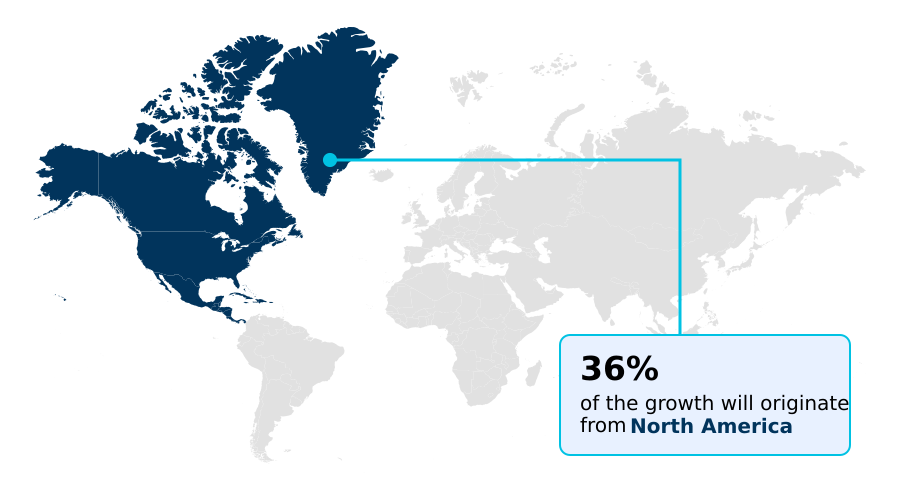
  • North America dominated the market and accounted for a 35.5% growth during the forecast period.
  • By Product Type - Clothing segment was valued at USD 1.47 billion in 2024
  • By Application - Fitness and wellness segment accounted for the largest market revenue share in 2024

Market Size & Forecast

  • Market Opportunities: USD 9.67 billion
  • Market Future Opportunities: USD 7.60 billion
  • CAGR from 2025 to 2030 : 27.5%

Market Summary

What will be the Size of the Connected Apparel Market during the forecast period?

Get Key Insights on Market Forecast (PDF) Request Free Sample

How is the Connected Apparel Market Segmented?

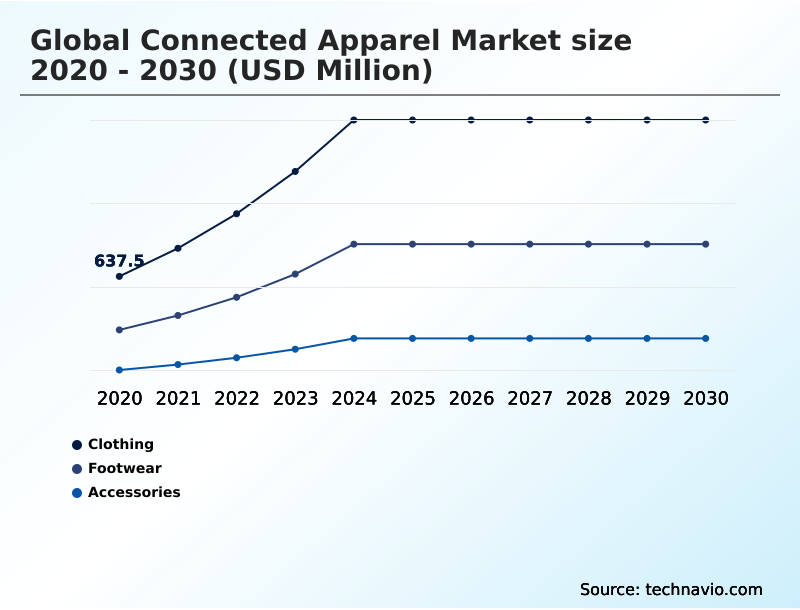
The connected apparel industry research report provides comprehensive data (region-wise segment analysis), with forecasts and estimates in "USD million" for the period 2026-2030, as well as historical data from 2020-2024 for the following segments.

  • Product type
    • Clothing
    • Footwear
    • Accessories
  • Application
    • Fitness and wellness
    • Healthcare monitoring
    • Industrial and workplace safety
    • Military and defense
    • Others
  • Distribution channel
    • Offline
    • Online
  • Geography
    • North America
      • US
      • Canada
      • Mexico
    • Europe
      • Germany
      • UK
      • France
    • APAC
      • China
      • India
      • Japan
    • Middle East and Africa
      • Saudi Arabia
      • UAE
      • South Africa
    • South America
      • Brazil
      • Argentina
      • Colombia
    • Rest of World (ROW)

By Product Type Insights

The clothing segment is estimated to witness significant growth during the forecast period.

Request Free Sample

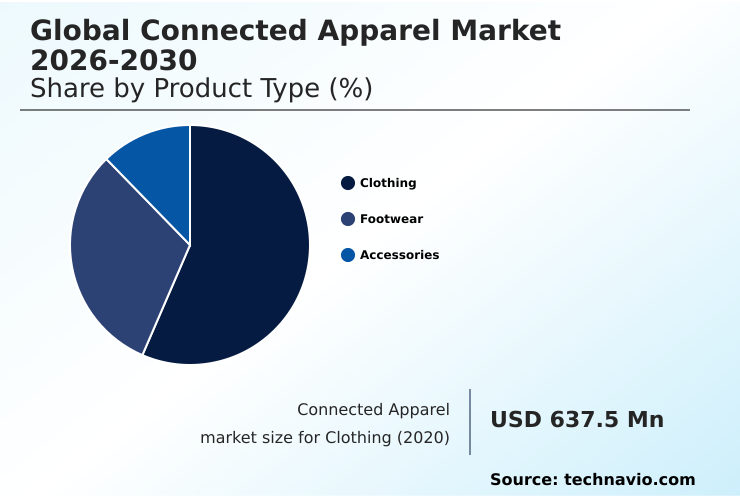
The Clothing segment was valued at USD 1.47 billion in 2024 and showed a gradual increase during the forecast period.

Request Free Sample

Regional Analysis

North America is estimated to contribute 35.5% to the growth of the global market during the forecast period.Technavio’s analysts have elaborately explained the regional trends and drivers that shape the market during the forecast period.

See How Connected Apparel Market Demand is Rising in North America Request Free Sample

Market Dynamics

Our researchers analyzed the data with 2025 as the base year, along with the key drivers, trends, and challenges. A holistic analysis of drivers will help companies refine their marketing strategies to gain a competitive advantage.

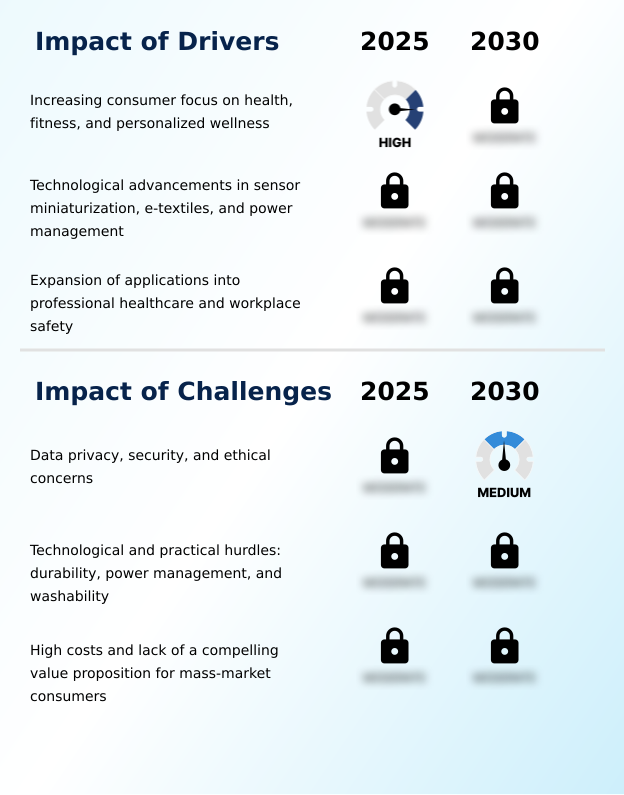
What are the key market drivers leading to the rise in the adoption of Connected Apparel Industry?

What are the market trends shaping the Connected Apparel Industry?

What challenges does the Connected Apparel Industry face during its growth?

Exclusive Technavio Analysis on Customer Landscape

The connected apparel market forecasting report includes the adoption lifecycle of the market, covering from the innovator’s stage to the laggard’s stage. It focuses on adoption rates in different regions based on penetration. Furthermore, the connected apparel market report also includes key purchase criteria and drivers of price sensitivity to help companies evaluate and develop their market growth analysis strategies.

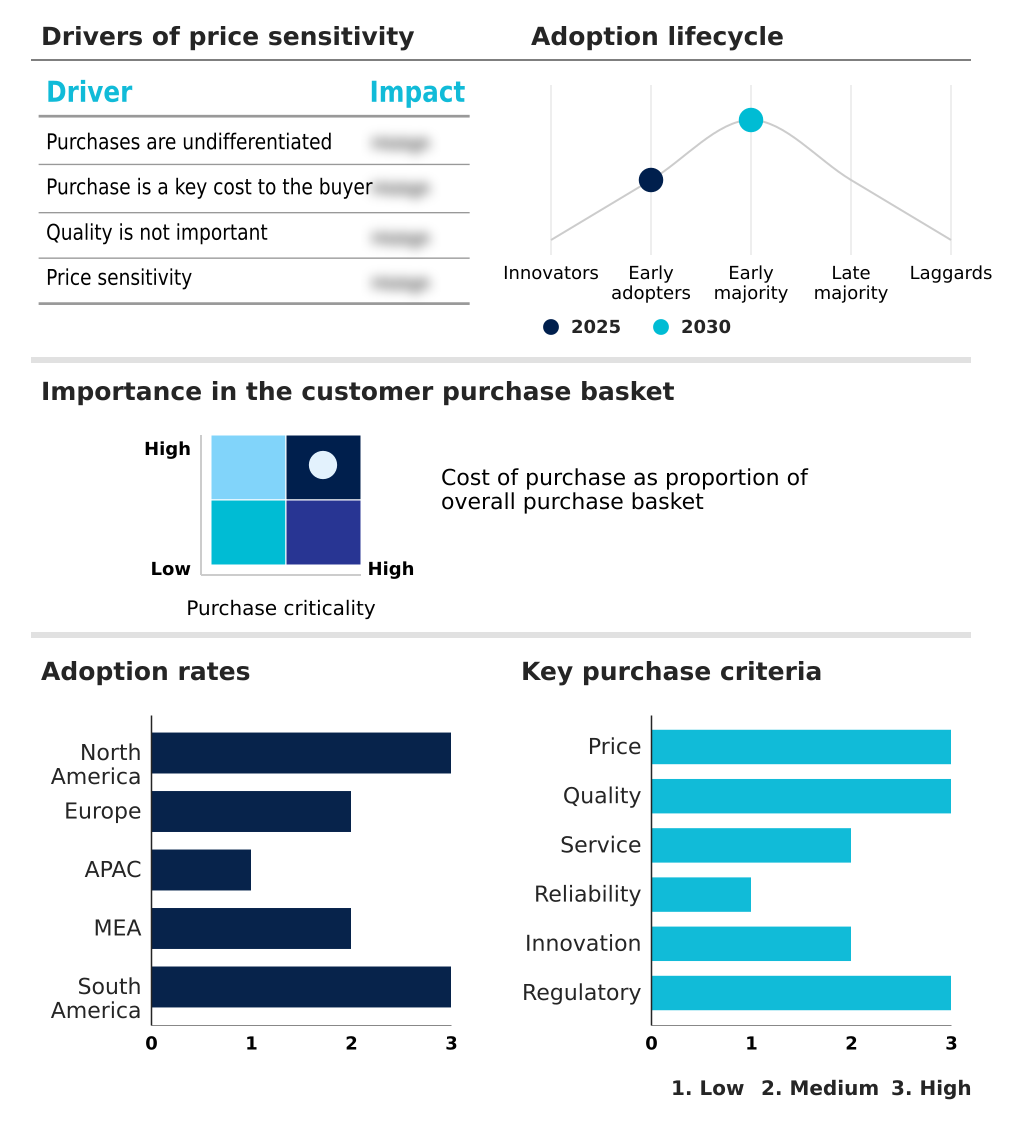
Customer Landscape of Connected Apparel Industry

Competitive Landscape

Companies are implementing various strategies, such as strategic alliances, connected apparel market forecast, partnerships, mergers and acquisitions, geographical expansion, and product/service launches, to enhance their presence in the industry.

AiQ Smart Clothing Inc. -

The industry research and growth report includes detailed analyses of the competitive landscape of the market and information about key companies, including:

  • AiQ Smart Clothing Inc.
  • Athos
  • Carre Technologies Inc.
  • Catapult Group
  • CuteCircuit Ltd.
  • Gentherm Inc.
  • Komodo Technologies
  • Myant Corp.
  • Nike Inc.
  • Owlet Inc.
  • Ralph Lauren Corp.
  • Sensoria Health Inc
  • Tommy Hilfiger licensing, LLC.
  • Under Armour Inc.
  • Wearable X
  • WHOOP Inc.
  • Xenoma Inc.

Qualitative and quantitative analysis of companies has been conducted to help clients understand the wider business environment as well as the strengths and weaknesses of key industry players. Data is qualitatively analyzed to categorize companies as pure play, category-focused, industry-focused, and diversified; it is quantitatively analyzed to categorize companies as dominant, leading, strong, tentative, and weak.

Recent Development and News in Connected apparel market

Dive into Technavio’s robust research methodology, blending expert interviews, extensive data synthesis, and validated models for unparalleled Connected Apparel Market insights. See full methodology.

Market Scope
Page number 296
Base year 2025
Historic period 2020-2024
Forecast period 2026-2030
Growth momentum & CAGR Accelerate at a CAGR of 27.5%
Market growth 2026-2030 USD 7600.6 million
Market structure Fragmented
YoY growth 2025-2026(%) 24.8%
Key countries US, Canada, Mexico, Germany, UK, France, Italy, The Netherlands, Spain, China, India, Japan, South Korea, Australia, Indonesia, Saudi Arabia, UAE, South Africa, Israel, Turkey, Brazil, Argentina and Colombia
Competitive landscape Leading Companies, Market Positioning of Companies, Competitive Strategies, and Industry Risks

Request Free Sample

Research Analyst Overview

What are the Key Data Covered in this Connected Apparel Market Research and Growth Report?

  • What is the expected growth of the Connected Apparel Market between 2026 and 2030?

    • USD 7.60 billion, at a CAGR of 27.5%

  • What segmentation does the market report cover?

    • The report is segmented by Product Type (Clothing, Footwear, and Accessories), Application (Fitness and wellness, Healthcare monitoring, Industrial and workplace safety, Military and defense, and Others), Distribution Channel (Offline, and Online) and Geography (North America, Europe, APAC, Middle East and Africa, South America)

  • Which regions are analyzed in the report?

    • North America, Europe, APAC, Middle East and Africa and South America

  • What are the key growth drivers and market challenges?

    • Increasing consumer focus on health, fitness, and personalized wellness, Data privacy, security, and ethical concerns

  • Who are the major players in the Connected Apparel Market?

    • AiQ Smart Clothing Inc., Athos, Carre Technologies Inc., Catapult Group, CuteCircuit Ltd., Gentherm Inc., Komodo Technologies, Myant Corp., Nike Inc., Owlet Inc., Ralph Lauren Corp., Sensoria Health Inc, Tommy Hilfiger licensing, LLC., Under Armour Inc., Wearable X, WHOOP Inc. and Xenoma Inc.

Market Research Insights

We can help! Our analysts can customize this connected apparel market research report to meet your requirements.

Get in touch

1. Executive Summary

1.1 Market overview

Executive Summary - Chart on Market Overview
Executive Summary - Data Table on Market Overview
Executive Summary - Chart on Global Market Characteristics
Executive Summary - Chart on Market by Geography
Executive Summary - Chart on Market Segmentation by Product Type
Executive Summary - Chart on Market Segmentation by Application
Executive Summary - Chart on Market Segmentation by Distribution Channel
Executive Summary - Chart on Incremental Growth
Executive Summary - Data Table on Incremental Growth
Executive Summary - Chart on Company Market Positioning

2. Technavio Analysis

2.1 Analysis of price sensitivity, lifecycle, customer purchase basket, adoption rates, and purchase criteria

2.2 Criticality of inputs and Factors of differentiation

Chart on Overview on criticality of inputs and factors of differentiation

2.3 Factors of disruption

Chart on Overview on factors of disruption

2.4 Impact of drivers and challenges

Chart on Impact of drivers and challenges in 2025 and 2030

3. Market Landscape

3.1 Market ecosystem

Chart on Parent Market
Data Table on - Parent Market

3.2 Market characteristics

Chart on Market characteristics analysis

3.3 Value chain analysis

Chart on Value chain analysis

4. Market Sizing

4.1 Market definition

Data Table on Offerings of companies included in the market definition

4.2 Market segment analysis

Market segments

4.3 Market size 2025

4.4 Market outlook: Forecast for 2025-2030

Chart on Global - Market size and forecast 2025-2030 ($ million)
Data Table on Global - Market size and forecast 2025-2030 ($ million)
Chart on Global Market: Year-over-year growth 2025-2030 (%)
Data Table on Global Market: Year-over-year growth 2025-2030 (%)

5. Historic Market Size

5.1 Global Connected Apparel Market 2020 - 2024

Historic Market Size - Data Table on Global Connected Apparel Market 2020 - 2024 ($ million)

5.2 Product Type segment analysis 2020 - 2024

Historic Market Size - Product Type Segment 2020 - 2024 ($ million)

5.3 Application segment analysis 2020 - 2024

Historic Market Size - Application Segment 2020 - 2024 ($ million)

5.4 Distribution Channel segment analysis 2020 - 2024

Historic Market Size - Distribution Channel Segment 2020 - 2024 ($ million)

5.5 Geography segment analysis 2020 - 2024

Historic Market Size - Geography Segment 2020 - 2024 ($ million)

5.6 Country segment analysis 2020 - 2024

Historic Market Size - Country Segment 2020 - 2024 ($ million)

6. Five Forces Analysis

6.1 Five forces summary

Five forces analysis - Comparison between 2025 and 2030

6.2 Bargaining power of buyers

Bargaining power of buyers - Impact of key factors 2025 and 2030

6.3 Bargaining power of suppliers

Bargaining power of suppliers - Impact of key factors in 2025 and 2030

6.4 Threat of new entrants

Threat of new entrants - Impact of key factors in 2025 and 2030

6.5 Threat of substitutes

Threat of substitutes - Impact of key factors in 2025 and 2030

6.6 Threat of rivalry

Threat of rivalry - Impact of key factors in 2025 and 2030

6.7 Market condition

Chart on Market condition - Five forces 2025 and 2030

7. Market Segmentation by Product Type

7.1 Market segments

Chart on Product Type - Market share 2025-2030 (%)
Data Table on Product Type - Market share 2025-2030 (%)

7.2 Comparison by Product Type

Chart on Comparison by Product Type
Data Table on Comparison by Product Type

7.3 Clothing - Market size and forecast 2025-2030

Chart on Clothing - Market size and forecast 2025-2030 ($ million)
Data Table on Clothing - Market size and forecast 2025-2030 ($ million)
Chart on Clothing - Year-over-year growth 2025-2030 (%)
Data Table on Clothing - Year-over-year growth 2025-2030 (%)

7.4 Footwear - Market size and forecast 2025-2030

Chart on Footwear - Market size and forecast 2025-2030 ($ million)
Data Table on Footwear - Market size and forecast 2025-2030 ($ million)
Chart on Footwear - Year-over-year growth 2025-2030 (%)
Data Table on Footwear - Year-over-year growth 2025-2030 (%)

7.5 Accessories - Market size and forecast 2025-2030

Chart on Accessories - Market size and forecast 2025-2030 ($ million)
Data Table on Accessories - Market size and forecast 2025-2030 ($ million)
Chart on Accessories - Year-over-year growth 2025-2030 (%)
Data Table on Accessories - Year-over-year growth 2025-2030 (%)

7.6 Market opportunity by Product Type

Market opportunity by Product Type ($ million)
Data Table on Market opportunity by Product Type ($ million)

8. Market Segmentation by Application

8.1 Market segments

Chart on Application - Market share 2025-2030 (%)
Data Table on Application - Market share 2025-2030 (%)

8.2 Comparison by Application

Chart on Comparison by Application
Data Table on Comparison by Application

8.3 Fitness and wellness - Market size and forecast 2025-2030

Chart on Fitness and wellness - Market size and forecast 2025-2030 ($ million)
Data Table on Fitness and wellness - Market size and forecast 2025-2030 ($ million)
Chart on Fitness and wellness - Year-over-year growth 2025-2030 (%)
Data Table on Fitness and wellness - Year-over-year growth 2025-2030 (%)

8.4 Healthcare monitoring - Market size and forecast 2025-2030

Chart on Healthcare monitoring - Market size and forecast 2025-2030 ($ million)
Data Table on Healthcare monitoring - Market size and forecast 2025-2030 ($ million)
Chart on Healthcare monitoring - Year-over-year growth 2025-2030 (%)
Data Table on Healthcare monitoring - Year-over-year growth 2025-2030 (%)

8.5 Industrial and workplace safety - Market size and forecast 2025-2030

Chart on Industrial and workplace safety - Market size and forecast 2025-2030 ($ million)
Data Table on Industrial and workplace safety - Market size and forecast 2025-2030 ($ million)
Chart on Industrial and workplace safety - Year-over-year growth 2025-2030 (%)
Data Table on Industrial and workplace safety - Year-over-year growth 2025-2030 (%)

8.6 Military and defense - Market size and forecast 2025-2030

Chart on Military and defense - Market size and forecast 2025-2030 ($ million)
Data Table on Military and defense - Market size and forecast 2025-2030 ($ million)
Chart on Military and defense - Year-over-year growth 2025-2030 (%)
Data Table on Military and defense - Year-over-year growth 2025-2030 (%)

8.7 Others - Market size and forecast 2025-2030

Chart on Others - Market size and forecast 2025-2030 ($ million)
Data Table on Others - Market size and forecast 2025-2030 ($ million)
Chart on Others - Year-over-year growth 2025-2030 (%)
Data Table on Others - Year-over-year growth 2025-2030 (%)

8.8 Market opportunity by Application

Market opportunity by Application ($ million)
Data Table on Market opportunity by Application ($ million)

9. Market Segmentation by Distribution Channel

9.1 Market segments

Chart on Distribution Channel - Market share 2025-2030 (%)
Data Table on Distribution Channel - Market share 2025-2030 (%)

9.2 Comparison by Distribution Channel

Chart on Comparison by Distribution Channel
Data Table on Comparison by Distribution Channel

9.3 Offline - Market size and forecast 2025-2030

Chart on Offline - Market size and forecast 2025-2030 ($ million)
Data Table on Offline - Market size and forecast 2025-2030 ($ million)
Chart on Offline - Year-over-year growth 2025-2030 (%)
Data Table on Offline - Year-over-year growth 2025-2030 (%)

9.4 Online - Market size and forecast 2025-2030

Chart on Online - Market size and forecast 2025-2030 ($ million)
Data Table on Online - Market size and forecast 2025-2030 ($ million)
Chart on Online - Year-over-year growth 2025-2030 (%)
Data Table on Online - Year-over-year growth 2025-2030 (%)

9.5 Market opportunity by Distribution Channel

Market opportunity by Distribution Channel ($ million)
Data Table on Market opportunity by Distribution Channel ($ million)

10. Customer Landscape

10.1 Customer landscape overview

Analysis of price sensitivity, lifecycle, customer purchase basket, adoption rates, and purchase criteria

11. Geographic Landscape

11.1 Geographic segmentation

Chart on Market share by geography 2025-2030 (%)
Data Table on Market share by geography 2025-2030 (%)

11.2 Geographic comparison

Chart on Geographic comparison
Data Table on Geographic comparison

11.3 North America - Market size and forecast 2025-2030

Chart on North America - Market size and forecast 2025-2030 ($ million)
Data Table on North America - Market size and forecast 2025-2030 ($ million)
Chart on North America - Year-over-year growth 2025-2030 (%)
Data Table on North America - Year-over-year growth 2025-2030 (%)
Chart on Regional Comparison - North America
Data Table on Regional Comparison - North America

11.3.1 US - Market size and forecast 2025-2030

Chart on US - Market size and forecast 2025-2030 ($ million)
Data Table on US - Market size and forecast 2025-2030 ($ million)
Chart on US - Year-over-year growth 2025-2030 (%)
Data Table on US - Year-over-year growth 2025-2030 (%)

11.3.2 Canada - Market size and forecast 2025-2030

Chart on Canada - Market size and forecast 2025-2030 ($ million)
Data Table on Canada - Market size and forecast 2025-2030 ($ million)
Chart on Canada - Year-over-year growth 2025-2030 (%)
Data Table on Canada - Year-over-year growth 2025-2030 (%)

11.3.3 Mexico - Market size and forecast 2025-2030

Chart on Mexico - Market size and forecast 2025-2030 ($ million)
Data Table on Mexico - Market size and forecast 2025-2030 ($ million)
Chart on Mexico - Year-over-year growth 2025-2030 (%)
Data Table on Mexico - Year-over-year growth 2025-2030 (%)

11.4 Europe - Market size and forecast 2025-2030

Chart on Europe - Market size and forecast 2025-2030 ($ million)
Data Table on Europe - Market size and forecast 2025-2030 ($ million)
Chart on Europe - Year-over-year growth 2025-2030 (%)
Data Table on Europe - Year-over-year growth 2025-2030 (%)
Chart on Regional Comparison - Europe
Data Table on Regional Comparison - Europe

11.4.1 Germany - Market size and forecast 2025-2030

Chart on Germany - Market size and forecast 2025-2030 ($ million)
Data Table on Germany - Market size and forecast 2025-2030 ($ million)
Chart on Germany - Year-over-year growth 2025-2030 (%)
Data Table on Germany - Year-over-year growth 2025-2030 (%)

11.4.2 UK - Market size and forecast 2025-2030

Chart on UK - Market size and forecast 2025-2030 ($ million)
Data Table on UK - Market size and forecast 2025-2030 ($ million)
Chart on UK - Year-over-year growth 2025-2030 (%)
Data Table on UK - Year-over-year growth 2025-2030 (%)

11.4.3 France - Market size and forecast 2025-2030

Chart on France - Market size and forecast 2025-2030 ($ million)
Data Table on France - Market size and forecast 2025-2030 ($ million)
Chart on France - Year-over-year growth 2025-2030 (%)
Data Table on France - Year-over-year growth 2025-2030 (%)

11.4.4 Italy - Market size and forecast 2025-2030

Chart on Italy - Market size and forecast 2025-2030 ($ million)
Data Table on Italy - Market size and forecast 2025-2030 ($ million)
Chart on Italy - Year-over-year growth 2025-2030 (%)
Data Table on Italy - Year-over-year growth 2025-2030 (%)

11.4.5 The Netherlands - Market size and forecast 2025-2030

Chart on The Netherlands - Market size and forecast 2025-2030 ($ million)
Data Table on The Netherlands - Market size and forecast 2025-2030 ($ million)
Chart on The Netherlands - Year-over-year growth 2025-2030 (%)
Data Table on The Netherlands - Year-over-year growth 2025-2030 (%)

11.4.6 Spain - Market size and forecast 2025-2030

Chart on Spain - Market size and forecast 2025-2030 ($ million)
Data Table on Spain - Market size and forecast 2025-2030 ($ million)
Chart on Spain - Year-over-year growth 2025-2030 (%)
Data Table on Spain - Year-over-year growth 2025-2030 (%)

11.5 APAC - Market size and forecast 2025-2030

Chart on APAC - Market size and forecast 2025-2030 ($ million)
Data Table on APAC - Market size and forecast 2025-2030 ($ million)
Chart on APAC - Year-over-year growth 2025-2030 (%)
Data Table on APAC - Year-over-year growth 2025-2030 (%)
Chart on Regional Comparison - APAC
Data Table on Regional Comparison - APAC

11.5.1 China - Market size and forecast 2025-2030

Chart on China - Market size and forecast 2025-2030 ($ million)
Data Table on China - Market size and forecast 2025-2030 ($ million)
Chart on China - Year-over-year growth 2025-2030 (%)
Data Table on China - Year-over-year growth 2025-2030 (%)

11.5.2 India - Market size and forecast 2025-2030

Chart on India - Market size and forecast 2025-2030 ($ million)
Data Table on India - Market size and forecast 2025-2030 ($ million)
Chart on India - Year-over-year growth 2025-2030 (%)
Data Table on India - Year-over-year growth 2025-2030 (%)

11.5.3 Japan - Market size and forecast 2025-2030

Chart on Japan - Market size and forecast 2025-2030 ($ million)
Data Table on Japan - Market size and forecast 2025-2030 ($ million)
Chart on Japan - Year-over-year growth 2025-2030 (%)
Data Table on Japan - Year-over-year growth 2025-2030 (%)

11.5.4 South Korea - Market size and forecast 2025-2030

Chart on South Korea - Market size and forecast 2025-2030 ($ million)
Data Table on South Korea - Market size and forecast 2025-2030 ($ million)
Chart on South Korea - Year-over-year growth 2025-2030 (%)
Data Table on South Korea - Year-over-year growth 2025-2030 (%)

11.5.5 Australia - Market size and forecast 2025-2030

Chart on Australia - Market size and forecast 2025-2030 ($ million)
Data Table on Australia - Market size and forecast 2025-2030 ($ million)
Chart on Australia - Year-over-year growth 2025-2030 (%)
Data Table on Australia - Year-over-year growth 2025-2030 (%)

11.5.6 Indonesia - Market size and forecast 2025-2030

Chart on Indonesia - Market size and forecast 2025-2030 ($ million)
Data Table on Indonesia - Market size and forecast 2025-2030 ($ million)
Chart on Indonesia - Year-over-year growth 2025-2030 (%)
Data Table on Indonesia - Year-over-year growth 2025-2030 (%)

11.6 Middle East and Africa - Market size and forecast 2025-2030

Chart on Middle East and Africa - Market size and forecast 2025-2030 ($ million)
Data Table on Middle East and Africa - Market size and forecast 2025-2030 ($ million)
Chart on Middle East and Africa - Year-over-year growth 2025-2030 (%)
Data Table on Middle East and Africa - Year-over-year growth 2025-2030 (%)
Chart on Regional Comparison - Middle East and Africa
Data Table on Regional Comparison - Middle East and Africa

11.6.1 Saudi Arabia - Market size and forecast 2025-2030

Chart on Saudi Arabia - Market size and forecast 2025-2030 ($ million)
Data Table on Saudi Arabia - Market size and forecast 2025-2030 ($ million)
Chart on Saudi Arabia - Year-over-year growth 2025-2030 (%)
Data Table on Saudi Arabia - Year-over-year growth 2025-2030 (%)

11.6.2 UAE - Market size and forecast 2025-2030

Chart on UAE - Market size and forecast 2025-2030 ($ million)
Data Table on UAE - Market size and forecast 2025-2030 ($ million)
Chart on UAE - Year-over-year growth 2025-2030 (%)
Data Table on UAE - Year-over-year growth 2025-2030 (%)

11.6.3 South Africa - Market size and forecast 2025-2030

Chart on South Africa - Market size and forecast 2025-2030 ($ million)
Data Table on South Africa - Market size and forecast 2025-2030 ($ million)
Chart on South Africa - Year-over-year growth 2025-2030 (%)
Data Table on South Africa - Year-over-year growth 2025-2030 (%)

11.6.4 Israel - Market size and forecast 2025-2030

Chart on Israel - Market size and forecast 2025-2030 ($ million)
Data Table on Israel - Market size and forecast 2025-2030 ($ million)
Chart on Israel - Year-over-year growth 2025-2030 (%)
Data Table on Israel - Year-over-year growth 2025-2030 (%)

11.6.5 Turkey - Market size and forecast 2025-2030

Chart on Turkey - Market size and forecast 2025-2030 ($ million)
Data Table on Turkey - Market size and forecast 2025-2030 ($ million)
Chart on Turkey - Year-over-year growth 2025-2030 (%)
Data Table on Turkey - Year-over-year growth 2025-2030 (%)

11.7 South America - Market size and forecast 2025-2030

Chart on South America - Market size and forecast 2025-2030 ($ million)
Data Table on South America - Market size and forecast 2025-2030 ($ million)
Chart on South America - Year-over-year growth 2025-2030 (%)
Data Table on South America - Year-over-year growth 2025-2030 (%)
Chart on Regional Comparison - South America
Data Table on Regional Comparison - South America

11.7.1 Brazil - Market size and forecast 2025-2030

Chart on Brazil - Market size and forecast 2025-2030 ($ million)
Data Table on Brazil - Market size and forecast 2025-2030 ($ million)
Chart on Brazil - Year-over-year growth 2025-2030 (%)
Data Table on Brazil - Year-over-year growth 2025-2030 (%)

11.7.2 Argentina - Market size and forecast 2025-2030

Chart on Argentina - Market size and forecast 2025-2030 ($ million)
Data Table on Argentina - Market size and forecast 2025-2030 ($ million)
Chart on Argentina - Year-over-year growth 2025-2030 (%)
Data Table on Argentina - Year-over-year growth 2025-2030 (%)

11.7.3 Colombia - Market size and forecast 2025-2030

Chart on Colombia - Market size and forecast 2025-2030 ($ million)
Data Table on Colombia - Market size and forecast 2025-2030 ($ million)
Chart on Colombia - Year-over-year growth 2025-2030 (%)
Data Table on Colombia - Year-over-year growth 2025-2030 (%)

11.8 Market opportunity by geography

Market opportunity by geography ($ million)
Data Tables on Market opportunity by geography ($ million)

12. Drivers, Challenges, and Opportunity

12.1 Market drivers

Increasing consumer focus on health, fitness, and personalized wellness
Technological advancements in sensor miniaturization, e-textiles, and power management
Expansion of applications into professional healthcare and workplace safety

12.2 Market challenges

Data privacy, security, and ethical concerns
Technological and practical hurdles: durability, power management, and washability
High costs and lack of a compelling value proposition for mass-market consumers

12.3 Impact of drivers and challenges

Impact of drivers and challenges in 2025 and 2030

12.4 Market opportunities

Advanced biometric integration for holistic health management
Ascendance of sustainable and circular smart textiles
Enhanced human-computer interaction via haptic feedback and ambient computing

13. Competitive Landscape

13.1 Overview

13.2

Overview on criticality of inputs and factors of differentiation

13.3 Landscape disruption

Overview on factors of disruption

13.4 Industry risks

Impact of key risks on business

14. Competitive Analysis

14.1 Companies profiled

Companies covered

14.2 Company ranking index

14.3 Market positioning of companies

Matrix on companies position and classification

14.4 AiQ Smart Clothing Inc.

AiQ Smart Clothing Inc. - Overview
AiQ Smart Clothing Inc. - Product / Service
AiQ Smart Clothing Inc. - Key offerings
SWOT

14.5 Athos

Athos - Overview
Athos - Product / Service
Athos - Key offerings
SWOT

14.6 Carre Technologies Inc.

Carre Technologies Inc. - Overview
Carre Technologies Inc. - Product / Service
Carre Technologies Inc. - Key offerings
SWOT

14.7 CuteCircuit Ltd.

CuteCircuit Ltd. - Overview
CuteCircuit Ltd. - Product / Service
CuteCircuit Ltd. - Key offerings
SWOT

14.8 Gentherm Inc.

Gentherm Inc. - Overview
Gentherm Inc. - Business segments
Gentherm Inc. - Key news
Gentherm Inc. - Key offerings
Gentherm Inc. - Segment focus
SWOT

14.9 Komodo Technologies

Komodo Technologies - Overview
Komodo Technologies - Product / Service
Komodo Technologies - Key offerings
SWOT

14.10 Myant Corp.

Myant Corp. - Overview
Myant Corp. - Product / Service
Myant Corp. - Key offerings
SWOT

14.11 Nike Inc.

Nike Inc. - Overview
Nike Inc. - Business segments
Nike Inc. - Key news
Nike Inc. - Key offerings
Nike Inc. - Segment focus
SWOT

14.12 Owlet Inc.

Owlet Inc. - Overview
Owlet Inc. - Product / Service
Owlet Inc. - Key offerings
SWOT

14.13 Ralph Lauren Corp.

Ralph Lauren Corp. - Overview
Ralph Lauren Corp. - Business segments
Ralph Lauren Corp. - Key news
Ralph Lauren Corp. - Key offerings
Ralph Lauren Corp. - Segment focus
SWOT

14.14 Sensoria Health Inc

Sensoria Health Inc - Overview
Sensoria Health Inc - Product / Service
Sensoria Health Inc - Key offerings
SWOT

14.15 Under Armour Inc.

Under Armour Inc. - Overview
Under Armour Inc. - Business segments
Under Armour Inc. - Key news
Under Armour Inc. - Key offerings
Under Armour Inc. - Segment focus
SWOT

14.16 Wearable X

Wearable X - Overview
Wearable X - Product / Service
Wearable X - Key offerings
SWOT

14.17 WHOOP Inc.

WHOOP Inc. - Overview
WHOOP Inc. - Product / Service
WHOOP Inc. - Key offerings
SWOT

14.18 Xenoma Inc.

Xenoma Inc. - Overview
Xenoma Inc. - Product / Service
Xenoma Inc. - Key offerings
SWOT

15. Appendix

15.1 Scope of the report

Market definition
Objectives
Notes and caveats

15.2 Inclusions and exclusions checklist

Inclusions checklist
Exclusions checklist

15.3 Currency conversion rates for US$

15.4 Research methodology

15.5 Data procurement

Information sources

15.6 Data validation

15.7 Validation techniques employed for market sizing

15.8 Data synthesis

15.9 360 degree market analysis

15.10 List of abbreviations

Research Methodology

Technavio presents a detailed picture of the market by way of study, synthesis, and summation of data from multiple sources. The analysts have presented the various facets of the market with a particular focus on identifying the key industry influencers. The data thus presented is comprehensive, reliable, and the result of extensive research, both primary and secondary.

INFORMATION SOURCES

Primary sources

  • Manufacturers and suppliers
  • Channel partners
  • Industry experts
  • Strategic decision makers

Secondary sources

  • Industry journals and periodicals
  • Government data
  • Financial reports of key industry players
  • Historical data
  • Press releases

DATA ANALYSIS

Data Synthesis

  • Collation of data
  • Estimation of key figures
  • Analysis of derived insights

Data Validation

  • Triangulation with data models
  • Reference against proprietary databases
  • Corroboration with industry experts

REPORT WRITING

Qualitative

  • Market drivers
  • Market challenges
  • Market trends
  • Five forces analysis

Quantitative

  • Market size and forecast
  • Market segmentation
  • Geographical insights
  • Competitive landscape

Interested in this report?

Get your sample now to see our research methodology and insights!

Download Now

Frequently Asked Questions

Connected Apparel market growth will increase by USD 7600.6 million during 2026-2030 .

The Connected Apparel market is expected to grow at a CAGR of 27.5% during 2026-2030 .

Connected Apparel market is segmented by Product type (Clothing, Footwear, Accessories) Application (Fitness and wellness, Healthcare monitoring, Industrial and workplace safety, Military and defense, Others) Distribution channel (Offline, Online)

AiQ Smart Clothing Inc., Athos, Carre Technologies Inc., Catapult Group, CuteCircuit Ltd., Gentherm Inc., Komodo Technologies, Myant Corp., Nike Inc., Owlet Inc., Ralph Lauren Corp., Sensoria Health Inc, Tommy Hilfiger licensing, LLC., Under Armour Inc., Wearable X, WHOOP Inc., Xenoma Inc. are a few of the key vendors in the Connected Apparel market.

North America will register the highest growth rate of 35.5% among the other regions. Therefore, the Connected Apparel market in North America is expected to garner significant business opportunities for the vendors during the forecast period.

US, Canada, Mexico, Germany, UK, France, Italy, The Netherlands, Spain, China, India, Japan, South Korea, Australia, Indonesia, Saudi Arabia, UAE, South Africa, Israel, Turkey, Brazil, Argentina, Colombia

  • Increasing consumer focus on health, fitness, and personalized wellness is the driving factor this market.

The Connected Apparel market vendors should focus on grabbing business opportunities from the Product type segment as it accounted for the largest market share in the base year.