Container Yard Services Market Analysis APAC,Europe,North America,Middle East and Africa,South America - US,United Arab Emirates,China,Singapore,Germany - Size and Forecast 2024-2028

Container Yard Services Market Analysis APAC,Europe,North America,Middle East and Africa,South America - US,United Arab Emirates,China,Singapore,Germany - Size and Forecast 2024-2028

Published: Dec 2023 152 Pages SKU: IRTNTR72869

Market Overview at a Glance

$24.55 B
Market Opportunity
8.81%
CAGR
7.87
YoY growth 2023-2024(%)

Container Yard Services Market 2024-2028 

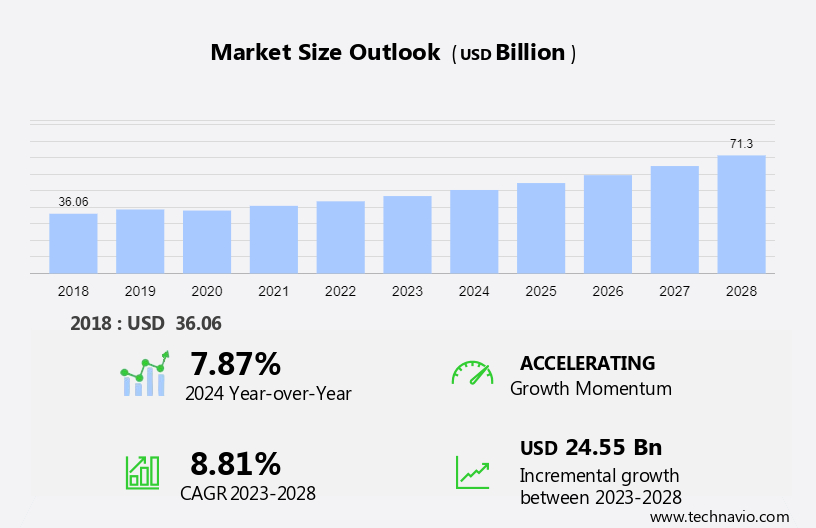
The container yard services market size is forecast to increase by USD 24.55 billion at a CAGR of 8.81% between 2023 and 2028. The container yard services market has experienced significant expansion, driven by several key factors. Firstly, the increase in containerization has led to a surge in demand for efficient and reliable container yard services. Secondly, the growth in cross-border trade has fueled the need for larger and more advanced container yards to facilitate the smooth movement of goods between countries. Lastly, substantial investments in container yard infrastructure have enabled the expansion of existing facilities and the development of new ones, further boosting market growth. These factors have combined to create a robust and dynamic container yard services market.

What will be the Size of the Container Yard Services Market During the Forecast Period?

Container Yard Services Market Size

For More Highlights About this Report, Download Free Sample in a Minute 

Market Dynamics

In the realm of maritime logistics, stevedoring stands as a vital aspect of cargo handling and transportation, encompassing both dry cargo and liquid cargo operations, including the transportation of crude oil. Amidst the complexities of the global supply chain, challenges such as port closures and congestions necessitate innovative solutions. This has led to the adoption of advanced technologies like GPS technology, cameras, and sensors to optimize port operations and enhance capacity utilization. Automated container terminals, driven by robotics and artificial intelligence, offer unparalleled efficiency and accuracy in container freight rates management and marine port services operations. With bunker fuel prices on the rise, the industry increasingly turns to automated container terminal architecture to streamline processes and minimize costs while maximizing space optimization on valuable waterfront property. This integration of technology and automation heralds a new era in cargo handling and port management, driving efficiency and competitiveness in global maritime trade.

Key Market Driver

The rise in investments in container yard infrastructure is the key factor driving market growth. Some of the major ports are increasing their container handling capacity, owing to the increasing container port traffic, through investments in the expansion and construction of new container yard infrastructure. For instance, Indian ports received a cumulative FDI (Foreign Direct Investment) inflow worth USD 1.63 billion between April 2000 and June 2021.

Similarly, in October 2021, Adani Group announced that it is aiming to make Adani Port a net-zero carbon emitter by 2025 and power all of its data centers with renewable energy by the end of 2030. Thus, such a rise in investments in container yard infrastructure developments is likely to increase the need for various container yard services. This, in turn, will drive the growth of the global container yard services market during the forecast period.

Key Market Trends

The emergence of new container storage systems is the primary trend shaping market growth. Development in international trade commodities has increased containerization activities. However, this development has led to a lack of space in container yards. Many seaports worldwide are now facing a capacity shortage, which has led to space constraints at container yards. An increase in port traffic can lead to a rise in the stacking of containers in storage yards to utilize the limited space available in the port area. Besides, when the stacking of containers is higher than the overall throughput of a terminal, many port operators focus on possible ways to manage the high volume of container demand. 

Furthermore, the new system places each container in an individual rack compartment instead of stacking containers directly on top of each other. In this case, they are stored in an 11-storey rack, creating more capacity than a conventional container terminal and reducing space usage. The racking system can store more than 1,200 TEUs. The emergence of such racking systems will drive the growth of the global container yard services market during the forecast period.

Key Market Challenge

Increasing congestion in container yards is a challenge that affects market growth. At container terminals, a container yard is a place where containers are stored. A container yard serves as a buffer for loading, unloading, and transshipping containers. Container port traffic has been increasing worldwide. A large number of containers moving in and out of container terminals has increased congestion and led to capacity issues in container yards.

Moreover, at container terminals, the berth and yard allocation plan assigns ships to berths and containers to yard blocks. Operations are often slowed down because of overloaded areas in the yard. In addition, an increase in container congestion in the yard adversely affects container yard services such as container handling, loading, and unloading of containers from vessels. This, in turn, will impede market growth during the forecast period.

Customer Landscape

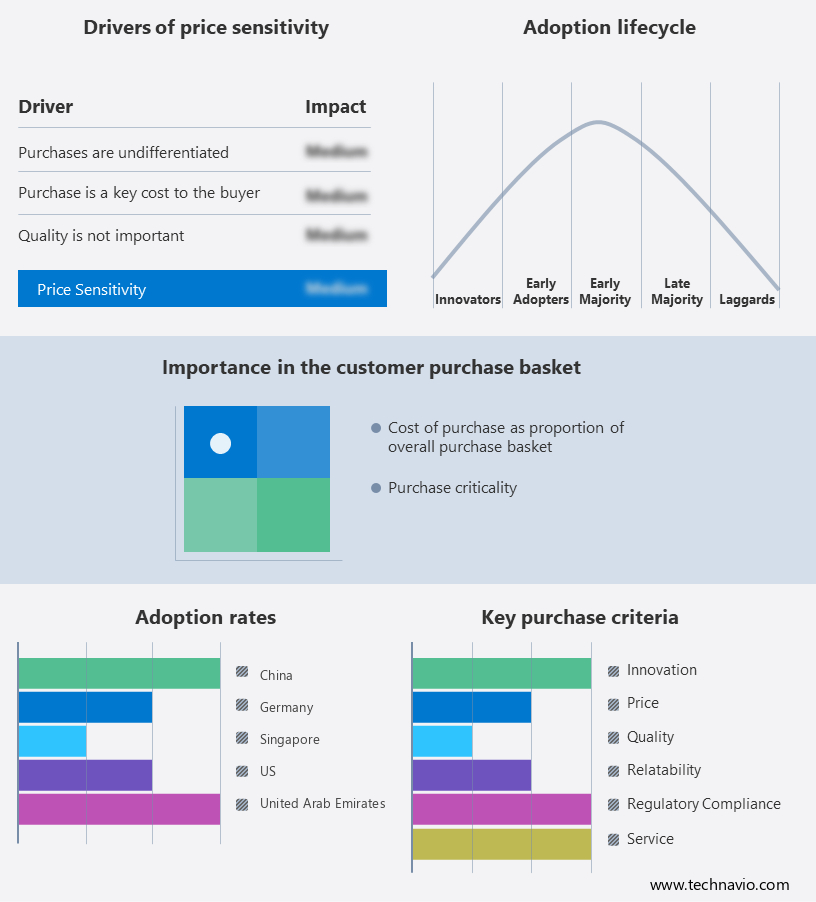
The market research report includes the adoption lifecycle of the market, covering from the innovator’s stage to the laggard’s stage. It focuses on adoption rates in different regions based on penetration. Furthermore, the report also includes key purchase criteria and drivers of price sensitivity to help companies evaluate and develop their growth strategies.

Container Yard Services Market Share by Geography

Customer Landscape

Who are the Major Container Yard Services Market Companies?

Companies are implementing various strategies, such as strategic alliances, partnerships, mergers and acquisitions, geographical expansion, and product/service launches, to enhance their presence in the market.

  • AP Moller Maersk AS: The company offers container yard services such as preparing containers, cargo stuffing and destuffing, receiving and stowing full containers, facilitating customs clearances in the bonded yard, or shunting full containers to port closer to vessel arrival.

The research report also includes detailed analyses of market growth and forecasting as well as the competitive landscape of the market and information about 20 market companies, including:

  • Abu Dhabi Ports PJSC
  • China Merchants Group
  • CK Hutchison Holdings Ltd.
  • Container Corp. of India Ltd.
  • Crescent Enterprises
  • Davao International Container Terminal Inc.
  • EUROGATE GmbH and Co. KGaA KG
  • Gulf Agency Co. Ltd.
  • International Container Terminal Services Inc.
  • Kamigumi Co. Ltd.
  • MSC Mediterranean Shipping Co. SA
  • Ports America Inc.
  • Restaurant Kitchen Equipment LLC
  • Sociedad Matriz SAAM SA
  • TDK Metro Terminals Ltd.
  • Temasek Holdings Pvt Ltd.
  • COSCO Shipping International Hong Kong Co. Ltd.
  • North Sea Terminal Bremerhaven GmbH and Co.
  • ITS Technologies and Logistics LLC

Qualitative and quantitative market research and growth analysis of companies has been conducted to help clients understand the wider business environment as well as the strengths and weaknesses of key market players. Data is qualitatively analyzed to categorize companies as pure play, category-focused, industry-focused, and diversified; it is quantitatively analyzed to categorize companies as dominant, leading, strong, tentative, and weak.

What is the Largest-Growing Segments in the Container Yard Services Market?

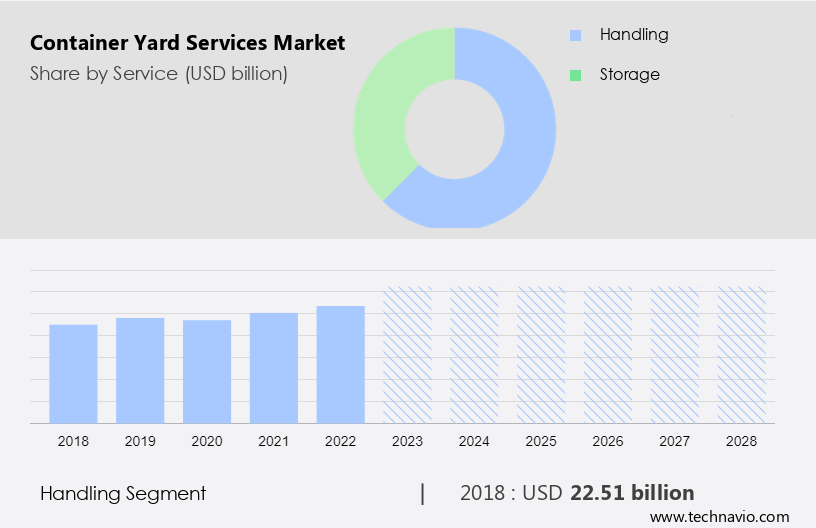
The handling segment is estimated to witness significant growth during the forecast period. The handling segment includes the handling of loaded and empty containers. Container handling contains the movement of loaded or empty containers between docks alongside vessels and inland carriers. It also includes the movement of containers between vessels and the place of rest in a container yard. Most container transport companies focus on speed and reliability. 

Container Yard Services Market Size

Get a glance at the market contribution of various segments Download the PDF Sample

The handling segment was the largest segment and was valued at  USD 22.51 billion in 2018Some major market players that offer container yard services are investing in new equipment to improve container handling services. Furthermore, some terminal operators are investing in the automation of container handling. The increasing use of automation by terminal and yard operators for container yard handling services will help in improving efficiency and reducing the time for container handling. Therefore, as per the Market forecasting, this will eventually fuel the growth of the handling services segment, thereby leading to the growth of the global container yard services market during the forecast period.

Which are the Key Regions for the Container Yard Services Market?

Container Yard Services Market Share by Geography

For more insights on the market share of various regions Download PDF Sample now!

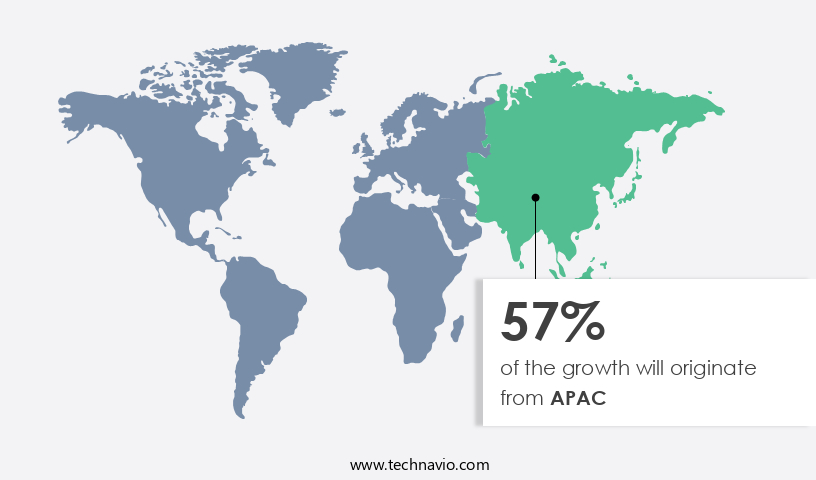
APAC is estimated to contribute 57% to the growth of the global market during the forecast period. Technavio’s analysts have elaborately explained in the market analysis and report, the regional market growth and trends and drivers that shape the market during the forecast period. The container yard services market in APAC is expanding rapidly, owing to the region's importance in global trade and manufacturing. Countries with big ports and significant container traffic, such as China, Singapore, and South Korea, are major contributors to the market. Therefore, as per the market forecast, this growth is expected to continue in the region in coming years.

Moreover, the key drivers include increased containerization of goods, brisk e-commerce activity, and the expansion of the shipping industry. Furthermore, the region's substantial economic growth, combined with infrastructure expenditures in port facilities, logistics, and multimodal transportation, places it at the forefront of the regional container yard services market. As the demand for effective cargo handling and container management grows, the APAC container yard services market is positioned for long-term growth during the forecast period.

Segment Overview

The market research report provides comprehensive data (region wise segment analysis), with forecasts and estimates in "USD Billion" for the period 2024 to 2028, as well as historical data from 2018 to 2022 for the following segments.

  • Service Outlook 
    • Handling
    • Storage
  • Region Outlook 
    • North America
      • The U.S.
      • Canada
    • Europe
      • The U.K.
      • Germany
      • France
      • Rest of Europe
    • APAC
      • China
      • India
    • South America
      • Chile
      • Brazil
      • Argentina
    • Middle East & Africa
      • Saudi Arabia
      • South Africa
      • Rest of the Middle East & Africa

You may also interested in below market reports:

Landscaping and Gardening Services Market: Landscaping and Gardening Services Market Analysis North America, Europe, APAC, Middle East and Africa, South America - US, China, Japan, Germany, UK - Size and Forecast 

Warehouse Management Systems Market: Warehouse Management Systems Market Analysis North America, Europe, APAC, Middle East and Africa, South America - US, China, Germany, UK, France - Size and Forecast 

Ports and Terminal Operations Market: Ports and Terminal Operations Market by Application, Service Type and Geography - Forecast and Analysis 

Market Analyst Overview

Port congestions pose significant challenges for marine port services operators as they navigate the complexities of maritime shipping in a globalized world. With the rise in world trade, container-handling ports are under increasing pressure to handle bulk cargo efficiently. Seaborne trade necessitates the continuous evolution of the global marine vessel industry, driving the adoption of energy-efficient technologies and electric-powered equipment. To address the growing demand for storage space, large container terminals, medium container terminals, and small container terminals are leveraging data analytics and optimization software to maximize storage capacities. From private container terminals to public container terminals, shipping companies and port authorities are investing in automated gate systems, automated yard management systems, and container tracking and identification systems to streamline operations. Safety remains paramount, with safety and surveillance systems and automated crane control systems ensuring accident prevention and efficient monitoring of terminal activities. This integration of technology and automation drives efficiency and safety in the shipping and logistics sector.

Industry  Scope

Report Coverage

Details

Page number

152

Base year

2023

Historic period

2018 - 2022

Forecast period

2024-2028

Growth momentum & CAGR

Accelerate at a CAGR of 8.81%

Market growth 2024-2028

USD 24.55 billion

Market structure

USD Fragmented

YoY growth 2023-2024(%)

7.87

Regional analysis

APAC, Europe, North America, Middle East and Africa, and South America

Performing market contribution

APAC at 57%

Key countries

US, United Arab Emirates, China, Singapore, and Germany

Competitive landscape

Leading Companies, Market Positioning of Companies, Competitive Strategies, and Industry Risks

Key companies profiled

Abu Dhabi Ports PJSC, AP Moller Maersk AS, China Merchants Group, CK Hutchison Holdings Ltd., Container Corp. of India Ltd., Crescent Enterprises, Davao International Container Terminal Inc., EUROGATE GmbH and Co. KGaA KG, Gulf Agency Co. Ltd., International Container Terminal Services Inc., Kamigumi Co. Ltd., MSC Mediterranean Shipping Co. SA, Ports America Inc., Restaurant Kitchen Equipment LLC, Sociedad Matriz SAAM SA, TDK Metro Terminals Ltd., Temasek Holdings Pvt Ltd., COSCO Shipping International Hong Kong Co. Ltd., North Sea Terminal Bremerhaven GmbH and Co., and ITS Technologies and Logistics LLC

Market dynamics

Parent market analysis, Market forecasting  growth inducers and obstacles, Fast-growing and slow-growing segment analysis, Market growth and Forecasting, COVID-19 impact and recovery analysis and future consumer dynamics, Market condition analysis for the forecast period

Customization purview

If our market report has not included the data that you are looking for, you can reach out to our analysts and get segments customized.

Download PDF Sample

What are the Key Data Covered in this Market Forecast Report?

  • CAGR of the market during the forecast period
  • Detailed information on factors that will drive the market growth and forecasting of the market between 2024 and 2028
  • Precise estimation of the market size and its contribution to the parent market
  • Accurate predictions about upcoming market trends and analysis and changes in consumer behavior
  • Growth of the market across Europe, North America, APAC, South America, and Middle East and Africa
  • Thorough market growth analysis of the market’s competitive landscape and detailed information about companies
  • Comprehensive market analysis and report on the factors that will challenge the market research and growth of market companies

We can help! Our analysts can customize this market research report to meet your requirements. 

Get in touch

1 Executive Summary

  • 1.1 Market overview
    • Exhibit 01: Executive Summary – Chart on Market Overview
    • Exhibit 02: Executive Summary – Data Table on Market Overview
    • Exhibit 03: Executive Summary – Chart on Global Market Characteristics
    • Exhibit 04: Executive Summary – Chart on Market by Geography
    • Exhibit 05: Executive Summary – Chart on Market Segmentation by Service
    • Exhibit 06: Executive Summary – Chart on Incremental Growth
    • Exhibit 07: Executive Summary – Data Table on Incremental Growth
    • Exhibit 08: Executive Summary – Chart on Vendor Market Positioning

2 Market Landscape

  • 2.1 Market ecosystem
    • Exhibit 09: Parent market
    • Exhibit 10: Market Characteristics

3 Market Sizing

  • 3.1 Market definition
    • Exhibit 11: Offerings of vendors included in the market definition
  • 3.2 Market segment analysis
    • Exhibit 12: Market segments
  • 3.3 Market size 2023
    • 3.4 Market outlook: Forecast for 2023-2028
      • Exhibit 13: Chart on Global - Market size and forecast 2023-2028 ($ billion)
      • Exhibit 14: Data Table on Global - Market size and forecast 2023-2028 ($ billion)
      • Exhibit 15: Chart on Global Market: Year-over-year growth 2023-2028 (%)
      • Exhibit 16: Data Table on Global Market: Year-over-year growth 2023-2028 (%)

    4 Historic Market Size

    • 4.1 Global container yard services market 2018 - 2022
      • Exhibit 17: Historic Market Size – Data Table on global container yard services market 2018 - 2022 ($ billion)
    • 4.2 Serivce Segment Analysis 2018 - 2022
      • Exhibit 18: Historic Market Size – Serivce Segment 2018 - 2022 ($ billion)
    • 4.3 Geography Segment Analysis 2018 - 2022
      • Exhibit 19: Historic Market Size – Geography Segment 2018 - 2022 ($ billion)
    • 4.4 Country Segment Analysis 2018 - 2022
      • Exhibit 20: Historic Market Size – Country Segment 2018 - 2022 ($ billion)

    5 Five Forces Analysis

    • 5.1 Five forces summary
      • Exhibit 21: Five forces analysis - Comparison between 2023 and 2028
    • 5.2 Bargaining power of buyers
      • Exhibit 22: Chart on Bargaining power of buyers – Impact of key factors 2023 and 2028
    • 5.3 Bargaining power of suppliers
      • Exhibit 23: Bargaining power of suppliers – Impact of key factors in 2023 and 2028
    • 5.4 Threat of new entrants
      • Exhibit 24: Threat of new entrants – Impact of key factors in 2023 and 2028
    • 5.5 Threat of substitutes
      • Exhibit 25: Threat of substitutes – Impact of key factors in 2023 and 2028
    • 5.6 Threat of rivalry
      • Exhibit 26: Threat of rivalry – Impact of key factors in 2023 and 2028
    • 5.7 Market condition
      • Exhibit 27: Chart on Market condition - Five forces 2023 and 2028

    6 Market Segmentation by Service

    • 6.1 Market segments
      • Exhibit 28: Chart on Service - Market share 2023-2028 (%)
      • Exhibit 29: Data Table on Service - Market share 2023-2028 (%)
    • 6.2 Comparison by Service
      • Exhibit 30: Chart on Comparison by Service
      • Exhibit 31: Data Table on Comparison by Service
    • 6.3 Handling - Market size and forecast 2023-2028
      • Exhibit 32: Chart on Handling - Market size and forecast 2023-2028 ($ billion)
      • Exhibit 33: Data Table on Handling - Market size and forecast 2023-2028 ($ billion)
      • Exhibit 34: Chart on Handling - Year-over-year growth 2023-2028 (%)
      • Exhibit 35: Data Table on Handling - Year-over-year growth 2023-2028 (%)
    • 6.4 Storage - Market size and forecast 2023-2028
      • Exhibit 36: Chart on Storage - Market size and forecast 2023-2028 ($ billion)
      • Exhibit 37: Data Table on Storage - Market size and forecast 2023-2028 ($ billion)
      • Exhibit 38: Chart on Storage - Year-over-year growth 2023-2028 (%)
      • Exhibit 39: Data Table on Storage - Year-over-year growth 2023-2028 (%)
    • 6.5 Market opportunity by Service
      • Exhibit 40: Market opportunity by Service ($ billion)
      • Exhibit 41: Data Table on Market opportunity by Service ($ billion)

    7 Customer Landscape

    • 7.1 Customer landscape overview
      • Exhibit 42: Analysis of price sensitivity, lifecycle, customer purchase basket, adoption rates, and purchase criteria

    8 Geographic Landscape

    • 8.1 Geographic segmentation
      • Exhibit 43: Chart on Market share by geography 2023-2028 (%)
      • Exhibit 44: Data Table on Market share by geography 2023-2028 (%)
    • 8.2 Geographic comparison
      • Exhibit 45: Chart on Geographic comparison
      • Exhibit 46: Data Table on Geographic comparison
    • 8.3 APAC - Market size and forecast 2023-2028
      • Exhibit 47: Chart on APAC - Market size and forecast 2023-2028 ($ billion)
      • Exhibit 48: Data Table on APAC - Market size and forecast 2023-2028 ($ billion)
      • Exhibit 49: Chart on APAC - Year-over-year growth 2023-2028 (%)
      • Exhibit 50: Data Table on APAC - Year-over-year growth 2023-2028 (%)
    • 8.4 Europe - Market size and forecast 2023-2028
      • Exhibit 51: Chart on Europe - Market size and forecast 2023-2028 ($ billion)
      • Exhibit 52: Data Table on Europe - Market size and forecast 2023-2028 ($ billion)
      • Exhibit 53: Chart on Europe - Year-over-year growth 2023-2028 (%)
      • Exhibit 54: Data Table on Europe - Year-over-year growth 2023-2028 (%)
    • 8.5 North America - Market size and forecast 2023-2028
      • Exhibit 55: Chart on North America - Market size and forecast 2023-2028 ($ billion)
      • Exhibit 56: Data Table on North America - Market size and forecast 2023-2028 ($ billion)
      • Exhibit 57: Chart on North America - Year-over-year growth 2023-2028 (%)
      • Exhibit 58: Data Table on North America - Year-over-year growth 2023-2028 (%)
    • 8.6 Middle East and Africa - Market size and forecast 2023-2028
      • Exhibit 59: Chart on Middle East and Africa - Market size and forecast 2023-2028 ($ billion)
      • Exhibit 60: Data Table on Middle East and Africa - Market size and forecast 2023-2028 ($ billion)
      • Exhibit 61: Chart on Middle East and Africa - Year-over-year growth 2023-2028 (%)
      • Exhibit 62: Data Table on Middle East and Africa - Year-over-year growth 2023-2028 (%)
    • 8.7 South America - Market size and forecast 2023-2028
      • Exhibit 63: Chart on South America - Market size and forecast 2023-2028 ($ billion)
      • Exhibit 64: Data Table on South America - Market size and forecast 2023-2028 ($ billion)
      • Exhibit 65: Chart on South America - Year-over-year growth 2023-2028 (%)
      • Exhibit 66: Data Table on South America - Year-over-year growth 2023-2028 (%)
    • 8.8 China - Market size and forecast 2023-2028
      • Exhibit 67: Chart on China - Market size and forecast 2023-2028 ($ billion)
      • Exhibit 68: Data Table on China - Market size and forecast 2023-2028 ($ billion)
      • Exhibit 69: Chart on China - Year-over-year growth 2023-2028 (%)
      • Exhibit 70: Data Table on China - Year-over-year growth 2023-2028 (%)
    • 8.9 US - Market size and forecast 2023-2028
      • Exhibit 71: Chart on US - Market size and forecast 2023-2028 ($ billion)
      • Exhibit 72: Data Table on US - Market size and forecast 2023-2028 ($ billion)
      • Exhibit 73: Chart on US - Year-over-year growth 2023-2028 (%)
      • Exhibit 74: Data Table on US - Year-over-year growth 2023-2028 (%)
    • 8.10 Singapore - Market size and forecast 2023-2028
      • Exhibit 75: Chart on Singapore - Market size and forecast 2023-2028 ($ billion)
      • Exhibit 76: Data Table on Singapore - Market size and forecast 2023-2028 ($ billion)
      • Exhibit 77: Chart on Singapore - Year-over-year growth 2023-2028 (%)
      • Exhibit 78: Data Table on Singapore - Year-over-year growth 2023-2028 (%)
    • 8.11 Germany - Market size and forecast 2023-2028
      • Exhibit 79: Chart on Germany - Market size and forecast 2023-2028 ($ billion)
      • Exhibit 80: Data Table on Germany - Market size and forecast 2023-2028 ($ billion)
      • Exhibit 81: Chart on Germany - Year-over-year growth 2023-2028 (%)
      • Exhibit 82: Data Table on Germany - Year-over-year growth 2023-2028 (%)
    • 8.12 United Arab Emirates - Market size and forecast 2023-2028
      • Exhibit 83: Chart on United Arab Emirates - Market size and forecast 2023-2028 ($ billion)
      • Exhibit 84: Data Table on United Arab Emirates - Market size and forecast 2023-2028 ($ billion)
      • Exhibit 85: Chart on United Arab Emirates - Year-over-year growth 2023-2028 (%)
      • Exhibit 86: Data Table on United Arab Emirates - Year-over-year growth 2023-2028 (%)
    • 8.13 Market opportunity by geography
      • Exhibit 87: Market opportunity by geography ($ billion)
      • Exhibit 88: Data Tables on Market opportunity by geography ($ billion)

    9 Drivers, Challenges, and Trends

    • 9.1 Market drivers
      • 9.2 Market challenges
        • 9.3 Impact of drivers and challenges
          • Exhibit 89: Impact of drivers and challenges in 2023 and 2028
        • 9.4 Market trends

          10 Vendor Landscape

          • 10.1 Overview
            • 10.2 Vendor landscape
              • Exhibit 90: Overview on Criticality of inputs and Factors of differentiation
            • 10.3 Landscape disruption
              • Exhibit 91: Overview on factors of disruption
            • 10.4 Industry risks
              • Exhibit 92: Impact of key risks on business

            11 Vendor Analysis

            • 11.1 Vendors covered
              • Exhibit 93: Vendors covered
            • 11.2 Market positioning of vendors
              • Exhibit 94: Matrix on vendor position and classification
            • 11.3 AP Moller Maersk AS
              • Exhibit 95: AP Moller Maersk AS - Overview
              • Exhibit 96: AP Moller Maersk AS - Business segments
              • Exhibit 97: AP Moller Maersk AS - Key news
              • Exhibit 98: AP Moller Maersk AS - Key offerings
              • Exhibit 99: AP Moller Maersk AS - Segment focus
            • 11.4 China Merchants Group
              • Exhibit 100: China Merchants Group - Overview
              • Exhibit 101: China Merchants Group - Product / Service
              • Exhibit 102: China Merchants Group - Key offerings
            • 11.5 CK Hutchison Holdings Ltd.
              • Exhibit 103: CK Hutchison Holdings Ltd. - Overview
              • Exhibit 104: CK Hutchison Holdings Ltd. - Business segments
              • Exhibit 105: CK Hutchison Holdings Ltd. - Key news
              • Exhibit 106: CK Hutchison Holdings Ltd. - Key offerings
              • Exhibit 107: CK Hutchison Holdings Ltd. - Segment focus
            • 11.6 Container Corp. of India Ltd.
              • Exhibit 108: Container Corp. of India Ltd. - Overview
              • Exhibit 109: Container Corp. of India Ltd. - Business segments
              • Exhibit 110: Container Corp. of India Ltd. - Key news
              • Exhibit 111: Container Corp. of India Ltd. - Key offerings
              • Exhibit 112: Container Corp. of India Ltd. - Segment focus
            • 11.7 Crescent Enterprises
              • Exhibit 113: Crescent Enterprises - Overview
              • Exhibit 114: Crescent Enterprises - Product / Service
              • Exhibit 115: Crescent Enterprises - Key offerings
            • 11.8 Davao International Container Terminal Inc.
              • Exhibit 116: Davao International Container Terminal Inc. - Overview
              • Exhibit 117: Davao International Container Terminal Inc. - Product / Service
              • Exhibit 118: Davao International Container Terminal Inc. - Key offerings
            • 11.9 Gulf Agency Co. Ltd.
              • Exhibit 119: Gulf Agency Co. Ltd. - Overview
              • Exhibit 120: Gulf Agency Co. Ltd. - Product / Service
              • Exhibit 121: Gulf Agency Co. Ltd. - Key news
              • Exhibit 122: Gulf Agency Co. Ltd. - Key offerings
            • 11.10 International Container Terminal Services Inc.
              • Exhibit 123: International Container Terminal Services Inc. - Overview
              • Exhibit 124: International Container Terminal Services Inc. - Business segments
              • Exhibit 125: International Container Terminal Services Inc. - Key news
              • Exhibit 126: International Container Terminal Services Inc. - Key offerings
              • Exhibit 127: International Container Terminal Services Inc. - Segment focus
            • 11.11 ITS Technologies and Logistics LLC
              • Exhibit 128: ITS Technologies and Logistics LLC - Overview
              • Exhibit 129: ITS Technologies and Logistics LLC - Product / Service
              • Exhibit 130: ITS Technologies and Logistics LLC - Key offerings
            • 11.12 Kamigumi Co. Ltd.
              • Exhibit 131: Kamigumi Co. Ltd. - Overview
              • Exhibit 132: Kamigumi Co. Ltd. - Business segments
              • Exhibit 133: Kamigumi Co. Ltd. - Key offerings
              • Exhibit 134: Kamigumi Co. Ltd. - Segment focus
            • 11.13 MSC Mediterranean Shipping Co. SA
              • Exhibit 135: MSC Mediterranean Shipping Co. SA - Overview
              • Exhibit 136: MSC Mediterranean Shipping Co. SA - Product / Service
              • Exhibit 137: MSC Mediterranean Shipping Co. SA - Key news
              • Exhibit 138: MSC Mediterranean Shipping Co. SA - Key offerings
            • 11.14 Ports America Inc.
              • Exhibit 139: Ports America Inc. - Overview
              • Exhibit 140: Ports America Inc. - Product / Service
              • Exhibit 141: Ports America Inc. - Key offerings
            • 11.15 Shanghai International Port Co. Ltd.
              • Exhibit 142: Shanghai International Port Co. Ltd. - Overview
              • Exhibit 143: Shanghai International Port Co. Ltd. - Product / Service
              • Exhibit 144: Shanghai International Port Co. Ltd. - Key offerings
            • 11.16 TDK Metro Terminals Ltd.
              • Exhibit 145: TDK Metro Terminals Ltd. - Overview
              • Exhibit 146: TDK Metro Terminals Ltd. - Product / Service
              • Exhibit 147: TDK Metro Terminals Ltd. - Key offerings
            • 11.17 Temasek Holdings Pvt Ltd.
              • Exhibit 148: Temasek Holdings Pvt Ltd. - Overview
              • Exhibit 149: Temasek Holdings Pvt Ltd. - Product / Service
              • Exhibit 150: Temasek Holdings Pvt Ltd. - Key news
              • Exhibit 151: Temasek Holdings Pvt Ltd. - Key offerings

            12 Appendix

            • 12.1 Scope of the report
              • 12.2 Inclusions and exclusions checklist
                • Exhibit 152: Inclusions checklist
                • Exhibit 153: Exclusions checklist
              • 12.3 Currency conversion rates for US$
                • Exhibit 154: Currency conversion rates for US$
              • 12.4 Research methodology
                • Exhibit 155: Research methodology
                • Exhibit 156: Validation techniques employed for market sizing
                • Exhibit 157: Information sources
              • 12.5 List of abbreviations
                • Exhibit 158: List of abbreviations

              Research Methodology

              Technavio presents a detailed picture of the market by way of study, synthesis, and summation of data from multiple sources. The analysts have presented the various facets of the market with a particular focus on identifying the key industry influencers. The data thus presented is comprehensive, reliable, and the result of extensive research, both primary and secondary.

              INFORMATION SOURCES

              Primary sources

              • Manufacturers and suppliers
              • Channel partners
              • Industry experts
              • Strategic decision makers

              Secondary sources

              • Industry journals and periodicals
              • Government data
              • Financial reports of key industry players
              • Historical data
              • Press releases

              DATA ANALYSIS

              Data Synthesis

              • Collation of data
              • Estimation of key figures
              • Analysis of derived insights

              Data Validation

              • Triangulation with data models
              • Reference against proprietary databases
              • Corroboration with industry experts

              REPORT WRITING

              Qualitative

              • Market drivers
              • Market challenges
              • Market trends
              • Five forces analysis

              Quantitative

              • Market size and forecast
              • Market segmentation
              • Geographical insights
              • Competitive landscape

              Interested in this report?

              Get your sample now to see our research methodology and insights!

              Download Now

              Frequently Asked Questions

              Container Yard Services market growth will increase by $ 24.55 bn during 2024-2028 .

              The Container Yard Services market is expected to grow at a CAGR of 8.81% during 2024-2028 .

              Container Yard Services market is segmented by Service( Handling, Storage)

              Abu Dhabi Ports PJSC, AP Moller Maersk AS, China Merchants Group, CK Hutchison Holdings Ltd., Container Corp. of India Ltd., Crescent Enterprises, Davao International Container Terminal Inc., EUROGATE GmbH and Co. KGaA KG, Gulf Agency Co. Ltd., International Container Terminal Services Inc., Kamigumi Co. Ltd., MSC Mediterranean Shipping Co. SA, Ports America Inc., Restaurant Kitchen Equipment LLC, Sociedad Matriz SAAM SA, TDK Metro Terminals Ltd., Temasek Holdings Pvt Ltd., COSCO Shipping International Hong Kong Co. Ltd., North Sea Terminal Bremerhaven GmbH and Co., ITS Technologies and Logistics LLC are a few of the key vendors in the Container Yard Services market.

              APAC will register the highest growth rate of 57% among the other regions. Therefore, the Container Yard Services market in APAC is expected to garner significant business opportunities for the vendors during the forecast period.

              US, United Arab Emirates, China, Singapore, Germany

              • Increase in containerizationContainerization is a system of intermodal freight transport using intermodal containers. An increase in container throughput can be attributed to factors such as the growth of international trade and the adoption of containerization as a privileged vector for maritime shipping and inland transportation. Increased port traffic is estimated to be a key driver for containerization. Containerization helps reduce congestion at ports and minimizes shipping time and losses from damage and theft. Moreover is the driving factor this market.
              • a rapid rise in the demand for intermodal freight transportation has fueled the need for containerization. Intermodal freight transport refers to the way of transporting freight in an intermodal container using multiple modes of transportation is the driving factor this market.
              • without any handling of the freight itself when changing modes. Intermodal freight transportation requires standard containers and can ferry more containers per day or per voyage. With a rise in the demand for intermodal freight transport is the driving factor this market.
              • the need for containerization increases. Some major ports across the world are improving their container handling capacity to meet the demand for containerization. Such initiatives are likely to enhance the performance of the logistics sector in various countries and increase the demand for containerization. Growth in container trade has a strong correlation to economic growth and regional and national gross domestic product (GDP). It is an excellent indicator of prospective container volumes. Thus is the driving factor this market.
              • with an increase in container volumes is the driving factor this market.
              • the need for container yard services will rise. This is the driving factor this market.
              • in turn is the driving factor this market.
              • will drive the growth of the global container yard services market during the forecast period. is the driving factor this market.

              The Container Yard Services market vendors should focus on grabbing business opportunities from the Handling segment as it accounted for the largest market share in the base year.