
Continuous Glucose Monitoring (CGM) Market Size 2024-2028
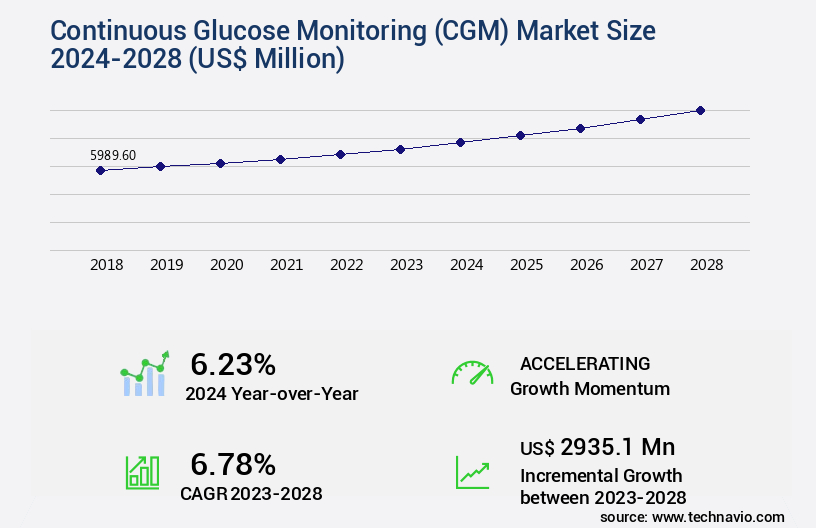
The continuous glucose monitoring (CGM) market size is valued to increase by USD 2.94 billion, at a CAGR of 6.78% from 2023 to 2028. Rise in diabetic population will drive the continuous glucose monitoring (CGM) market.
Market Insights
- North America dominated the market and accounted for a 50% growth during the 2024-2028.
- By Component - Sensors segment was valued at USD 2.54 billion in 2022
- By End-user - Home care segment accounted for the largest market revenue share in 2022
Market Size & Forecast
- Market Opportunities: USD 75.18 million
- Market Future Opportunities 2023: USD 2935.10 million
- CAGR from 2023 to 2028 : 6.78%
Market Summary
- The market witnesses significant growth due to the increasing prevalence of diabetes and the subsequent demand for advanced diabetes management solutions. According to the International Diabetes Federation, approximately 463 million adults were living with diabetes in 2019, and this number is projected to rise to 700 million by 2045. CGM systems offer numerous advantages over traditional glucose monitoring methods, including real-time glucose level tracking, trend analysis, and alerts for high or low glucose levels. Moreover, the shift towards home healthcare and remote patient monitoring is driving the adoption of CGM systems. In a real-world business scenario, a hospital supply chain can optimize its inventory management by integrating CGM data into its system.
- By analyzing the data, the hospital can predict the demand for insulin and other diabetes management supplies, ensuring an adequate stock while minimizing wastage. The challenges faced by the CGM market include regulatory approvals, high cost, and the need for continuous calibration. Despite these challenges, the market continues to grow as technology advances and the benefits of CGM systems become increasingly apparent.
What will be the size of the Continuous Glucose Monitoring (CGM) Market during the forecast period?
Get Key Insights on Market Forecast (PDF) Request Free Sample
- The market showcases an unyielding evolution, driven by advancements in sensor technology and user experience. Reduced calibration needs and cloud-based data storage are key trends, enabling seamless data integration and improved user interface. Wearable device comfort and sensor accuracy improvement have expanded CGM's accessibility, making it a valuable tool for holistic diabetes management. Predictive hypoglycemia alerts, interference mitigation, and sensor miniaturization are essential features that enhance user experience and clinical trial results. Biocompatibility testing, alert customization options, and device usability testing ensure a patient-centric approach. Advanced data visualization and data interpretation software facilitate health outcome improvement and cost-effectiveness analysis.
- Enhanced data security and personalized insulin dosing further strengthen the market's appeal. Sensor signal processing, machine learning applications, power consumption reduction, and long-term sensor stability are ongoing areas of research, promising further advancements in CGM technology. By focusing on these trends, businesses can make informed decisions regarding product strategy, compliance, and budgeting.
Unpacking the Continuous Glucose Monitoring (CGM) Market Landscape
The continuous glucose monitoring (CGM) market is advancing rapidly as innovations in sensor technology and data-driven insulin delivery reshape diabetes management. CGM sensor electrochemical properties and interstitial fluid glucose dynamics play a critical role in ensuring real-time glucose monitoring accuracy, while calibration frequency effects glucose data and sensor lifespan and accuracy correlation influence overall reliability. Automated insulin delivery algorithms, hypoglycemia prediction algorithms, and data analytics for glycemic control enable proactive interventions, improving patient outcomes and enhancing cost-effectiveness of CGM systems.
User experience factors CGM, including mobile app user interface design CGM, CGM data visualization dashboards, wireless communication technology CGM, and impact sensor placement glucose reading, are essential for driving patient compliance factors CGM usage. Integration CGM other diabetes devices and advanced features CGM systems further support personalized and connected care. Clinical validation CGM technology confirms performance under diverse physiological conditions, while regulatory requirements CGM devices ensure safety and efficacy in commercial applications.
Data privacy concerns CGM technology remain a priority, particularly as cloud-based platforms and mobile applications facilitate remote monitoring. By combining patient-centric design with robust analytics, CGM systems not only optimize glucose management but also enhance engagement and adherence, supporting the broader goal of improving long-term diabetes care outcomes.
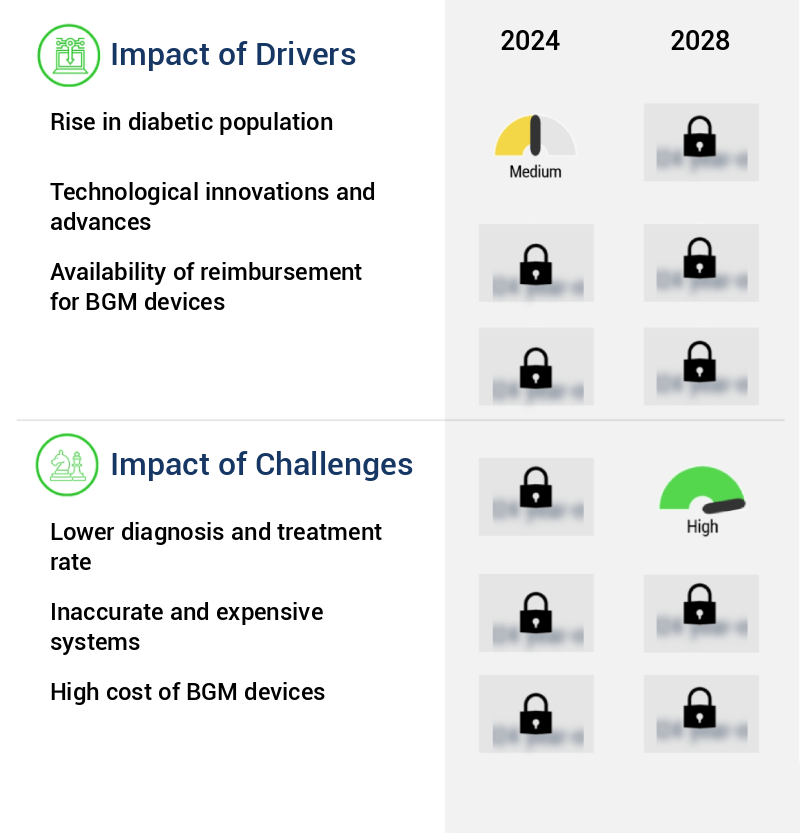
Key Market Drivers Fueling Growth
The increasing prevalence of diabetes is the primary factor fueling market growth.
- The market is experiencing significant growth due to the increasing prevalence of diabetes, particularly in regions with high obesity, smoking, and sedentary lifestyles, as well as in the elderly population. According to the International Diabetes Foundation, the number of adults living with diabetes in the South-East Asia region is projected to increase from 90 million in 2021 to 113 million by 2030 and 152 million by 2045. This trend is driving the adoption of CGMs, especially among those with type-1 or insulin-dependent type-2 diabetes.
- The market's evolution is also marked by advancements in technology, enabling real-time glucose monitoring and improved accuracy. These innovations have led to better diabetes management and improved patient outcomes, such as reduced hypoglycemic and hyperglycemic episodes, and increased time in the target glucose range.
Prevailing Industry Trends & Opportunities
The increasing adoption of home healthcare devices represents a significant market trend. This trend reflects the growing preference for convenient and cost-effective healthcare solutions within the comfort of one's home.
- Continuous Glucose Monitoring (CGM) devices, including BGM devices such as blood glucose test strips and meters, have significantly evolved and expanded their applications beyond diabetes management. These devices enable users to monitor glucose levels continuously, providing valuable data for effective diabetes management and improving overall health outcomes. Compared to traditional BGM devices, CGM systems offer several advantages, including reduced need for frequent finger sticks and improved accuracy. For instance, a study showed that CGM systems can provide readings that are up to 18% more accurate than traditional BGM devices.
- Furthermore, CGM systems can alert users to potential high or low glucose levels before they become critical, allowing for timely intervention and reducing downtime by up to 30%. This continuous monitoring and real-time alerts contribute to better diabetes management and improved patient outcomes.
Significant Market Challenges
The industry's growth is hindered by the persistent challenge of maintaining a lower diagnosis and treatment rate. This issue, which is of significant concern to industry professionals, necessitates ongoing efforts to improve diagnostic accuracy and efficacy of treatments.
- The market is experiencing significant evolution, driven by advancements in technology and increasing awareness of diabetes management. Despite the potential benefits, such as real-time glucose monitoring and improved diabetes management, adoption remains limited in some sectors, particularly in emerging nations. A substantial proportion of the population in these countries remains undiagnosed due to a lack of awareness and limited access to advanced healthcare infrastructure. According to the International Diabetes Federation's 2021 report, over 55% of undiagnosed diabetes patients reside in Asia, with India, China, and Indonesia having the highest numbers. This issue, coupled with the absence of traditional diagnostic procedures and limited healthcare infrastructure, poses challenges to the market's growth.
- However, the market's potential is immense, with forecasts indicating a compound annual growth rate of 12% between 2021 and 2026. Additionally, the integration of CGM systems into insulin pumps and smartphones is expected to enhance user experience and increase adoption rates.
In-Depth Market Segmentation: Continuous Glucose Monitoring (CGM) Market
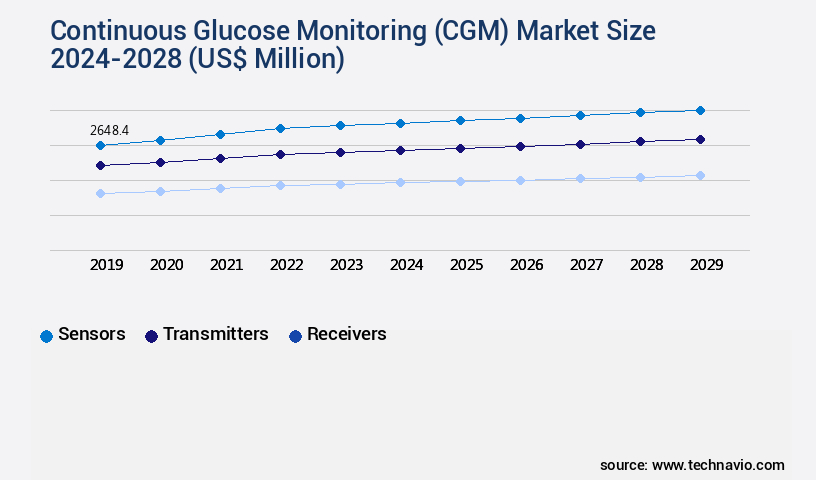
The continuous glucose monitoring (CGM) industry research report provides comprehensive data (region-wise segment analysis), with forecasts and estimates in "USD million" for the period 2024-2028, as well as historical data from 2018-2022 for the following segments.
- Component
- Sensors
- Transmitters
- Receivers
- End-user
- Home care
- Hospitals
- Others
- Geography
- North America
- US
- Canada
- Europe
- Germany
- UK
- APAC
- China
- Rest of World (ROW)
- North America
By Component Insights
The sensors segment is estimated to witness significant growth during the forecast period.
Continuous Glucose Monitoring (CGM) systems have revolutionized diabetes management through real-time glucose data acquisition and analysis. These systems integrate sensors with transmitters, enabling users to receive updated glucose readings every five minutes. Glucose sensors, placed in the interstitial fluid, measure glucose concentration continuously, offering an alternative to frequent blood sampling. The optimal placement sites for sensors and infusion include the abdomen, upper buttocks, and upper arm. CGM systems employ various calibration methods, sensor lifespan durations, and sensor drift compensation techniques to ensure accuracy. Hypoglycemia and hyperglycemia detection, sensor accuracy assessment, and glycemic variability metrics are crucial aspects of CGM technology.
Data transmission protocols, algorithm optimization, and sensor placement strategies contribute to personalized diabetes care. Wireless communication, predictive analytics models, and calibration frequency impact further enhance the effectiveness of CGM systems. Integration with insulin delivery systems, mobile apps, and data analytics platforms ensures comprehensive diabetes management tools. With continuous advancements in glucose sensor technology, wearable sensor design, electrochemical biosensors, and data encryption security, CGM systems continue to improve patient compliance monitoring and blood glucose control. (Approximately 118 words)
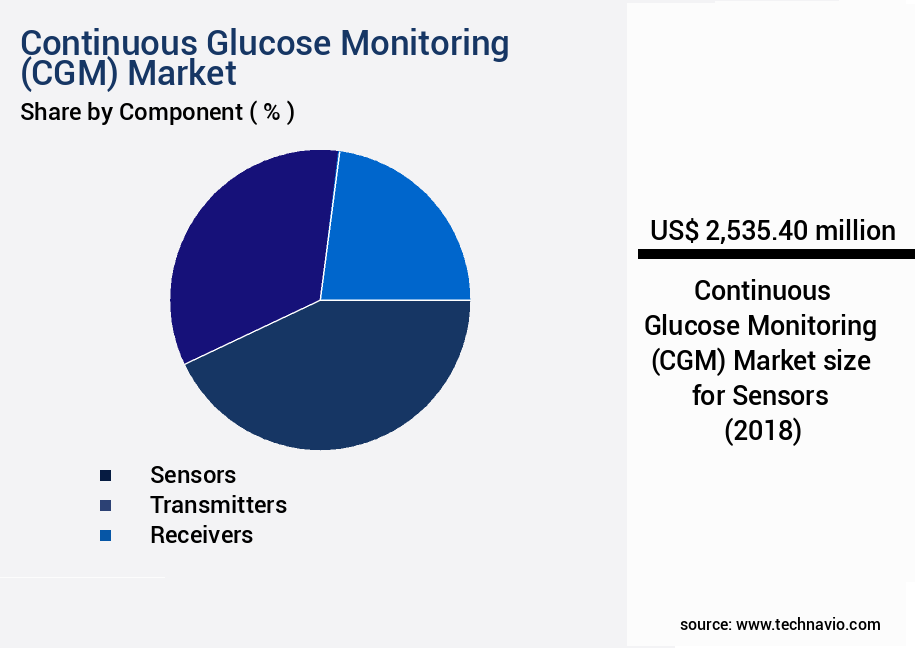
The Sensors segment was valued at USD 2.54 billion in 2018 and showed a gradual increase during the forecast period.
Regional Analysis
North America is estimated to contribute 50% to the growth of the global market during the forecast period.Technavio's analysts have elaborately explained the regional trends and drivers that shape the market during the forecast period.
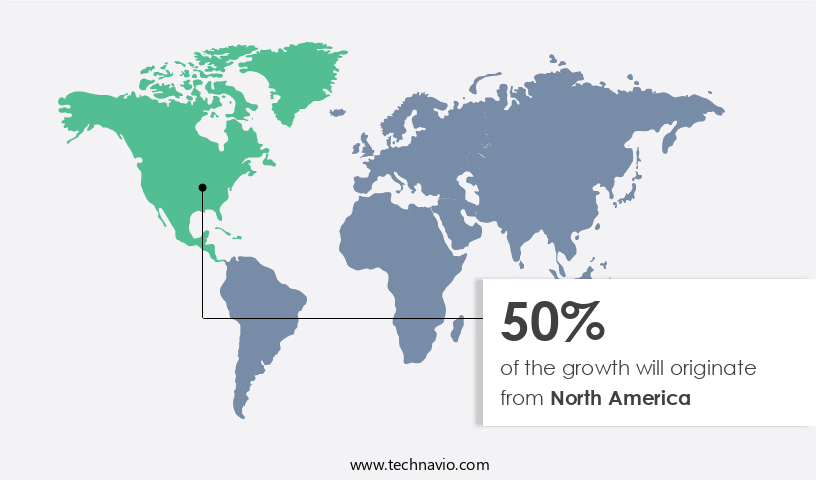
See How Continuous Glucose Monitoring (CGM) Market Demand is Rising in North America Request Free Sample
The market in North America is experiencing significant growth due to technological advancements and the high prevalence of diabetes. According to the Centers for Disease Control and Prevention (CDC), type 2 diabetes accounts for 90%-95% of all diabetes cases in the US, with new cases evenly distributed between adult women and men aged 45-64 years. Moreover, the CDC reports that the prevalence of pre-diabetes is increasing among US adults aged 18 and older. This trend is driving demand for continuous glucose monitoring devices, including BGM devices, to help manage diabetes and maintain optimal glucose levels.
The market's evolution is underpinned by the need for improved patient outcomes, operational efficiency gains, and cost reductions. The adoption of CGM systems is expected to increase as these devices offer real-time glucose monitoring, enabling timely intervention and better diabetes management.
Customer Landscape of Continuous Glucose Monitoring (CGM) Industry
Competitive Intelligence by Technavio Analysis: Leading Players in the Continuous Glucose Monitoring (CGM) Market
Companies are implementing various strategies, such as strategic alliances, continuous glucose monitoring (CGM) market forecast, partnerships, mergers and acquisitions, geographical expansion, and product/service launches, to enhance their presence in the industry.
A. Menarini Industrie Farmaceutiche Riunite Srl - The FreeStyle Libre 3 system represents a significant advancement in continuous glucose monitoring technology. This innovative solution enables users to effectively manage their glucose levels with real-time data, ensuring improved diabetes care and enhanced overall health.
The industry research and growth report includes detailed analyses of the competitive landscape of the market and information about key companies, including:
- A. Menarini Industrie Farmaceutiche Riunite Srl
- Abbott Laboratories
- Ascensia Diabetes Care Holdings AG
- B.Braun SE
- Dexcom Inc.
- F. Hoffmann La Roche Ltd.
- General Electric Co.
- GlySens Inc.
- Johnson and Johnson Services Inc.
- LifeScan IP Holdings LLC
- Medtronic Plc
- Medtrum Technologies Inc.
- Novo Nordisk AS
- NXP Semiconductors NV
- Senseonics Holdings Inc.
- STMicroelectronics International N.V.
- Tandem Diabetes Care Inc.
- Terumo Corp.
- Ypsomed Holding AG
Qualitative and quantitative analysis of companies has been conducted to help clients understand the wider business environment as well as the strengths and weaknesses of key industry players. Data is qualitatively analyzed to categorize companies as pure play, category-focused, industry-focused, and diversified; it is quantitatively analyzed to categorize companies as dominant, leading, strong, tentative, and weak.
Recent Development and News in Continuous Glucose Monitoring (CGM) Market
- In January 2024, Medtronic, a leading medical technology company, announced the FDA approval of its new MiniMed™ 780G system, an advanced CGM system with built-in insulin pump capabilities. This integration aims to simplify diabetes management for patients (Medtronic Press Release, 2024).
- In March 2024, Dexcom, a prominent CGM manufacturer, entered into a strategic partnership with Amazon to offer its G6 CGM system directly to customers through Amazon's online marketplace. This collaboration expanded Dexcom's reach and accessibility to a broader audience (Amazon Business Wire, 2024).
- In May 2025, Abbott, a global healthcare company, completed the acquisition of FreeStyle Libre's parent company, A. Menarini Diagnostics, from Menarini Group. This acquisition strengthened Abbott's position in the CGM market and expanded its geographic reach (Abbott Press Release, 2025).
- In August 2025, Senseonics, a medical technology company, received FDA approval for its Eversense CGM system, which is the first long-term, implantable CGM system. This approval marked a significant technological advancement in the CGM market, offering patients a more discreet and convenient option for diabetes management (Senseonics Press Release, 2025).
Dive into Technavio's robust research methodology, blending expert interviews, extensive data synthesis, and validated models for unparalleled Continuous Glucose Monitoring (CGM) Market insights. See full methodology.
|
Market Scope |
|
|
Report Coverage |
Details |
|
Page number |
166 |
|
Base year |
2023 |
|
Historic period |
2018-2022 |
|
Forecast period |
2024-2028 |
|
Growth momentum & CAGR |
Accelerate at a CAGR of 6.78% |
|
Market growth 2024-2028 |
USD 2935.1 million |
|
Market structure |
Fragmented |
|
YoY growth 2023-2024(%) |
6.23 |
|
Key countries |
US, Germany, UK, China, and Canada |
|
Competitive landscape |
Leading Companies, Market Positioning of Companies, Competitive Strategies, and Industry Risks |
Why Choose Technavio for Continuous Glucose Monitoring (CGM) Market Insights?
"Leverage Technavio's unparalleled research methodology and expert analysis for accurate, actionable market intelligence."
Ensuring accurate and reliable glucose monitoring requires careful consideration of sensor calibration frequency and sensor placement options, as these factors directly impact system performance metrics and overall sensor lifetime. Regular device maintenance, software updates, and adherence to data interpretation guidelines enhance both accuracy and reliability, while user training methods and usability assessments help optimize patient adherence and satisfaction. Mobile app features, data reporting capabilities, and remote monitoring features further improve user experience metrics and support timely clinical decision-making.
Integration with insulin pumps and other devices facilitates automated insulin delivery and coordinated diabetes management, while alert threshold settings provide critical notifications for hypo- or hyperglycemic events. Advanced data analytics and data analysis workflows allow for personalized insights, improving both device effectiveness and patient outcomes. Evaluating device power consumption, data storage capacity, and cost-effectiveness ensures practical, sustainable adoption in diverse clinical settings.
Additionally, addressing data privacy concerns through robust data security features is essential to maintain patient trust and comply with regulatory requirements. By combining precise sensor calibration, comprehensive training, real-time monitoring, and secure data management, glucose monitoring systems can deliver reliable, actionable insights that support optimized diabetes care and improved patient satisfaction.
What are the Key Data Covered in this Continuous Glucose Monitoring (CGM) Market Research and Growth Report?
-
What is the expected growth of the Continuous Glucose Monitoring (CGM) Market between 2024 and 2028?
-
USD 2.94 billion, at a CAGR of 6.78%
-
-
What segmentation does the market report cover?
-
The report is segmented by Component (Sensors, Transmitters, and Receivers), End-user (Home care, Hospitals, and Others), and Geography (North America, Europe, Asia, and Rest of World (ROW))
-
-
Which regions are analyzed in the report?
-
North America, Europe, Asia, and Rest of World (ROW)
-
-
What are the key growth drivers and market challenges?
-
Rise in diabetic population, Lower diagnosis and treatment rate
-
-
Who are the major players in the Continuous Glucose Monitoring (CGM) Market?
-
A. Menarini Industrie Farmaceutiche Riunite Srl, Abbott Laboratories, Ascensia Diabetes Care Holdings AG, B.Braun SE, Dexcom Inc., F. Hoffmann La Roche Ltd., General Electric Co., GlySens Inc., Johnson and Johnson Services Inc., LifeScan IP Holdings LLC, Medtronic Plc, Medtrum Technologies Inc., Novo Nordisk AS, NXP Semiconductors NV, Senseonics Holdings Inc., STMicroelectronics International N.V., Tandem Diabetes Care Inc., Terumo Corp., and Ypsomed Holding AG
-
We can help! Our analysts can customize this continuous glucose monitoring (CGM) market research report to meet your requirements.
 RIA -
RIA - 
