Coq10 Supplement Market Analysis, Size, and Forecast 2026-2030: North America (US, Canada, and Mexico), Europe (Germany, UK, and France), APAC (China, Japan, and India), Middle East and Africa (UAE, South Africa, and Saudi Arabia), South America (Brazil), Asia, Rest of World (ROW)

Coq10 Supplement Market Analysis, Size, and Forecast 2026-2030:
North America (US, Canada, and Mexico), Europe (Germany, UK, and France), APAC (China, Japan, and India), Middle East and Africa (UAE, South Africa, and Saudi Arabia), South America (Brazil), Asia, Rest of World (ROW)

Published: Dec 2025 285 Pages SKU: IRTNTR74551

Market Overview at a Glance

$565.8 Mn
Market Opportunity
12.8%
CAGR 2025 - 2030
40%
North America Growth
$230.8 Mn
Dietary supplements segment 2024

Coq10 Supplement Market Size 2026-2030

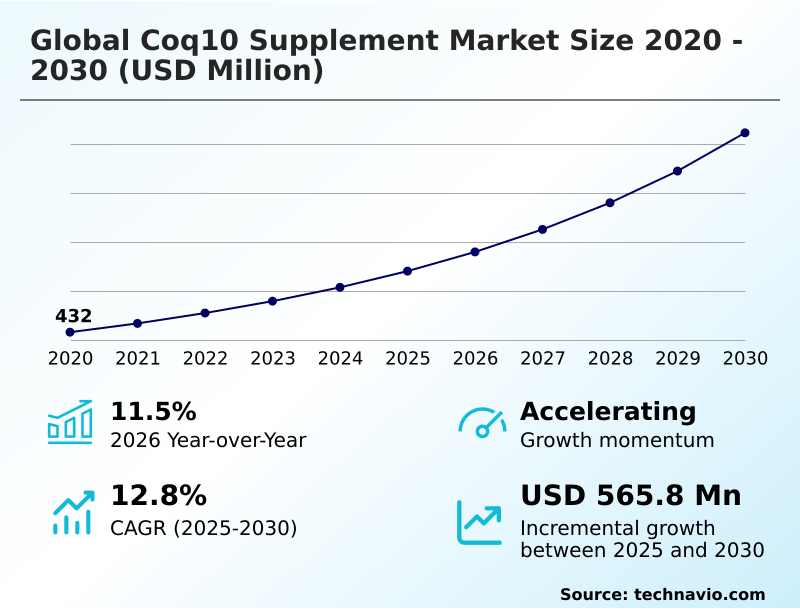
The coq10 supplement market size is valued to increase by USD 565.8 million, at a CAGR of 12.8% from 2025 to 2030. Increasing global geriatric population and emphasis on healthy aging will drive the coq10 supplement market.

Major Market Trends & Insights

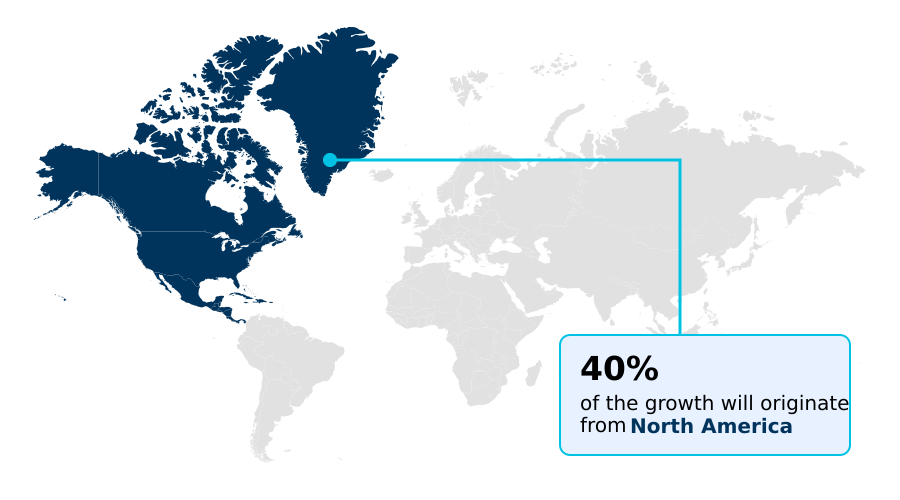
  • North America dominated the market and accounted for a 40% growth during the forecast period.
  • By Application - Dietary supplements segment was valued at USD 230.8 million in 2024
  • By Distribution Channel - Offline segment accounted for the largest market revenue share in 2024

Market Size & Forecast

  • Market Opportunities: USD 815.6 million
  • Market Future Opportunities: USD 565.8 million
  • CAGR from 2025 to 2030 : 12.8%

Market Summary

What will be the Size of the Coq10 Supplement Market during the forecast period?

Get Key Insights on Market Forecast (PDF) Request Free Sample

How is the Coq10 Supplement Market Segmented?

The coq10 supplement industry research report provides comprehensive data (region-wise segment analysis), with forecasts and estimates in "USD million" for the period 2026-2030, as well as historical data from 2020-2024 for the following segments.
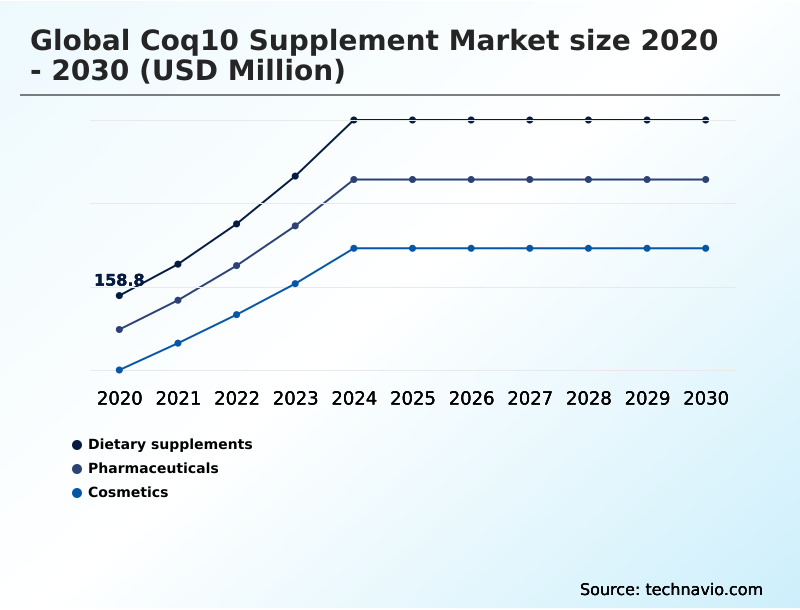
  • Application
    • Dietary supplements
    • Pharmaceuticals
    • Cosmetics
  • Distribution channel
    • Offline
    • Online
  • Formulation
    • Softgels
    • Tablets
    • Powder
    • Others
  • Geography
    • North America
      • US
      • Canada
      • Mexico
    • Europe
      • Germany
      • UK
      • France
    • Asia
    • Rest of World (ROW)

By Application Insights

The dietary supplements segment is estimated to witness significant growth during the forecast period.

Request Free Sample

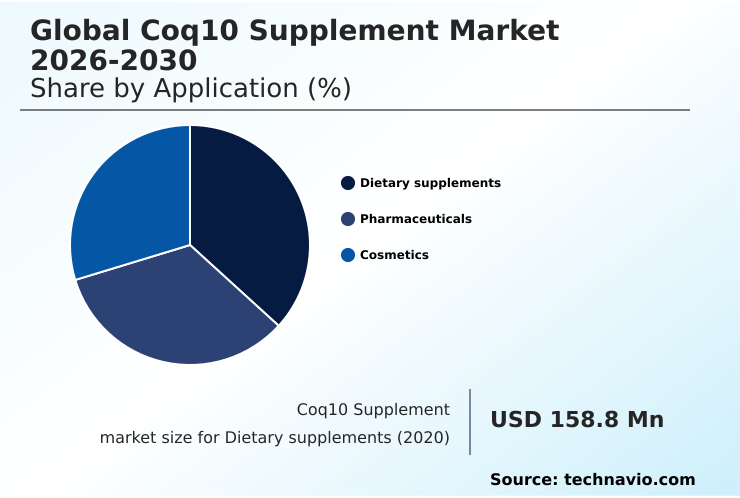
The Dietary supplements segment was valued at USD 230.8 million in 2024 and showed a gradual increase during the forecast period.

Request Free Sample

Regional Analysis

North America is estimated to contribute 40% to the growth of the global market during the forecast period.Technavio’s analysts have elaborately explained the regional trends and drivers that shape the market during the forecast period.

See How Coq10 Supplement Market Demand is Rising in North America Request Free Sample

Market Dynamics

Our researchers analyzed the data with 2025 as the base year, along with the key drivers, trends, and challenges. A holistic analysis of drivers will help companies refine their marketing strategies to gain a competitive advantage.

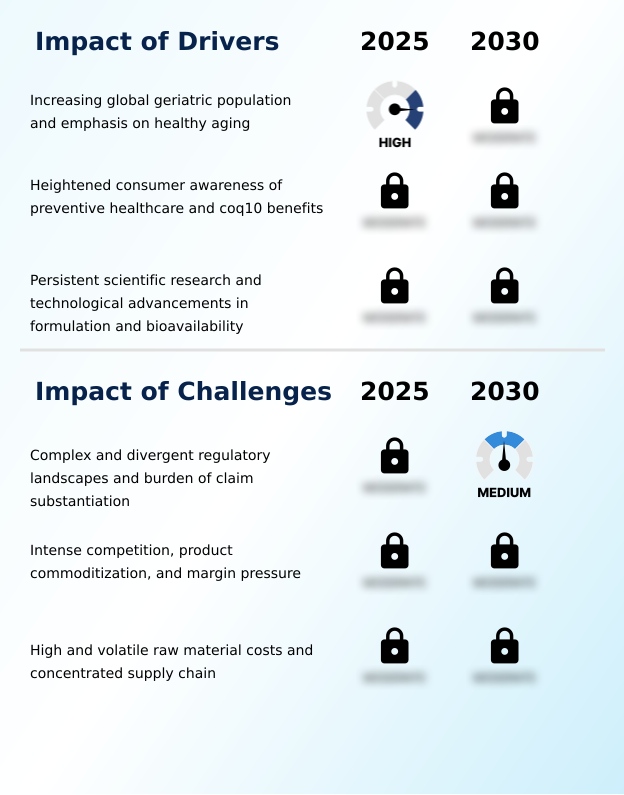
What are the key market drivers leading to the rise in the adoption of Coq10 Supplement Industry?

What are the market trends shaping the Coq10 Supplement Industry?

What challenges does the Coq10 Supplement Industry face during its growth?

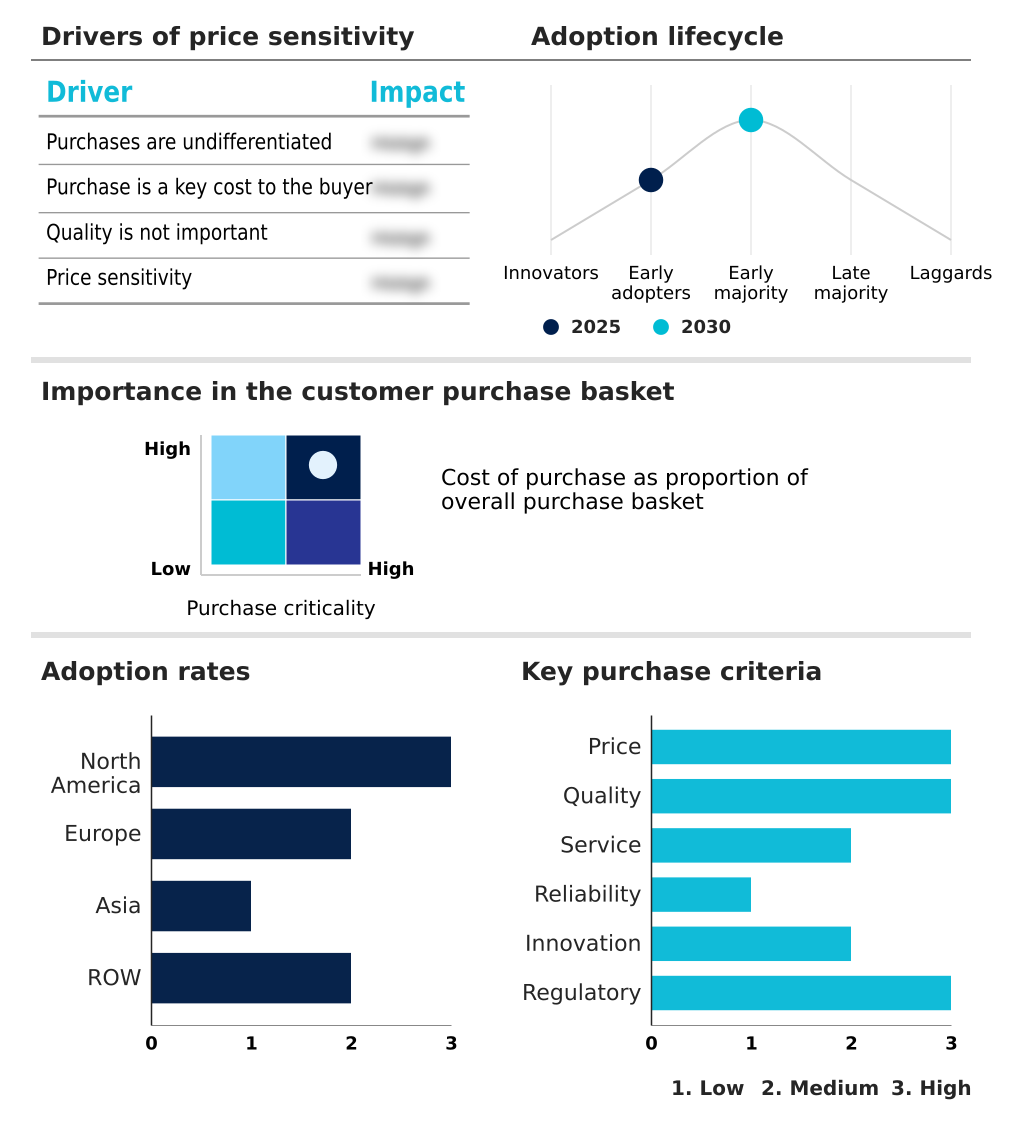
Exclusive Technavio Analysis on Customer Landscape

The coq10 supplement market forecasting report includes the adoption lifecycle of the market, covering from the innovator’s stage to the laggard’s stage. It focuses on adoption rates in different regions based on penetration. Furthermore, the coq10 supplement market report also includes key purchase criteria and drivers of price sensitivity to help companies evaluate and develop their market growth analysis strategies.

Customer Landscape of Coq10 Supplement Industry

Competitive Landscape

Companies are implementing various strategies, such as strategic alliances, coq10 supplement market forecast, partnerships, mergers and acquisitions, geographical expansion, and product/service launches, to enhance their presence in the industry.

Abbott Laboratories -

The industry research and growth report includes detailed analyses of the competitive landscape of the market and information about key companies, including:

  • Abbott Laboratories
  • AdvaCare Pharma
  • Bausch Health Companies Inc.
  • BioThrive Sciences
  • Bluebonnet Nutrition Corp.
  • Carlyle Nutritionals LLC
  • Church and Dwight Co. Inc.
  • DSM Firmenich AG
  • GNC Holdings LLC
  • Indena S.p.A.
  • INLIFE Pharma Pvt. Ltd.
  • Jarrow Formulas Inc.
  • Kaneka Corp.
  • Life Extension Foundation
  • Nestle SA
  • NOW Health Group Inc.
  • Otsuka Holdings Co. Ltd.
  • Pharma Nord Inc.
  • Sanofi SA
  • Xiamen Kingdomway Group Co.

Qualitative and quantitative analysis of companies has been conducted to help clients understand the wider business environment as well as the strengths and weaknesses of key industry players. Data is qualitatively analyzed to categorize companies as pure play, category-focused, industry-focused, and diversified; it is quantitatively analyzed to categorize companies as dominant, leading, strong, tentative, and weak.

Recent Development and News in Coq10 supplement market

Dive into Technavio’s robust research methodology, blending expert interviews, extensive data synthesis, and validated models for unparalleled Coq10 Supplement Market insights. See full methodology.

Market Scope
Page number 285
Base year 2025
Historic period 2020-2024
Forecast period 2026-2030
Growth momentum & CAGR Accelerate at a CAGR of 12.8%
Market growth 2026-2030 USD 565.8 million
Market structure Fragmented
YoY growth 2025-2026(%) 11.5%
Key countries US, Canada, Mexico, Germany, UK, France, Italy, Spain, The Netherlands, Russia, China, Japan, India, South Korea, Singapore, Indonesia, Thailand, Australia, UAE, Brazil, South Africa, Saudi Arabia and Turkey
Competitive landscape Leading Companies, Market Positioning of Companies, Competitive Strategies, and Industry Risks

Request Free Sample

Research Analyst Overview

What are the Key Data Covered in this Coq10 Supplement Market Research and Growth Report?

  • What is the expected growth of the Coq10 Supplement Market between 2026 and 2030?

    • USD 565.8 million, at a CAGR of 12.8%

  • What segmentation does the market report cover?

    • The report is segmented by Application (Dietary supplements, Pharmaceuticals, and Cosmetics), Distribution Channel (Offline, and Online), Formulation (Softgels, Tablets, Powder, and Others) and Geography (North America, Europe, Asia, Rest of World (ROW))

  • Which regions are analyzed in the report?

    • North America, Europe, Asia and Rest of World (ROW)

  • What are the key growth drivers and market challenges?

    • Increasing global geriatric population and emphasis on healthy aging, Complex and divergent regulatory landscapes and burden of claim substantiation

  • Who are the major players in the Coq10 Supplement Market?

    • Abbott Laboratories, AdvaCare Pharma, Bausch Health Companies Inc., BioThrive Sciences, Bluebonnet Nutrition Corp., Carlyle Nutritionals LLC, Church and Dwight Co. Inc., DSM Firmenich AG, GNC Holdings LLC, Indena S.p.A., INLIFE Pharma Pvt. Ltd., Jarrow Formulas Inc., Kaneka Corp., Life Extension Foundation, Nestle SA, NOW Health Group Inc., Otsuka Holdings Co. Ltd., Pharma Nord Inc., Sanofi SA and Xiamen Kingdomway Group Co.

Market Research Insights

We can help! Our analysts can customize this coq10 supplement market research report to meet your requirements.

Get in touch

1. Executive Summary

1.1 Market overview

Executive Summary - Chart on Market Overview
Executive Summary - Data Table on Market Overview
Executive Summary - Chart on Global Market Characteristics
Executive Summary - Chart on Market by Geography
Executive Summary - Chart on Market Segmentation by Application
Executive Summary - Chart on Market Segmentation by Distribution Channel
Executive Summary - Chart on Market Segmentation by Formulation
Executive Summary - Chart on Incremental Growth
Executive Summary - Data Table on Incremental Growth
Executive Summary - Chart on Company Market Positioning

2. Technavio Analysis

2.1 Analysis of price sensitivity, lifecycle, customer purchase basket, adoption rates, and purchase criteria

2.2 Criticality of inputs and Factors of differentiation

Chart on Overview on criticality of inputs and factors of differentiation

2.3 Factors of disruption

Chart on Overview on factors of disruption

2.4 Impact of drivers and challenges

Chart on Impact of drivers and challenges in 2025 and 2030

3. Market Landscape

3.1 Market ecosystem

Chart on Parent Market
Data Table on - Parent Market

3.2 Market characteristics

Chart on Market characteristics analysis

3.3 Value chain analysis

Chart on Value chain analysis

4. Market Sizing

4.1 Market definition

Data Table on Offerings of companies included in the market definition

4.2 Market segment analysis

Market segments

4.3 Market size 2025

4.4 Market outlook: Forecast for 2025-2030

Chart on Global - Market size and forecast 2025-2030 ($ million)
Data Table on Global - Market size and forecast 2025-2030 ($ million)
Chart on Global Market: Year-over-year growth 2025-2030 (%)
Data Table on Global Market: Year-over-year growth 2025-2030 (%)

5. Historic Market Size

5.1 Global Coq10 Supplement Market 2020 - 2024

Historic Market Size - Data Table on Global Coq10 Supplement Market 2020 - 2024 ($ million)

5.2 Application segment analysis 2020 - 2024

Historic Market Size - Application Segment 2020 - 2024 ($ million)

5.3 Distribution Channel segment analysis 2020 - 2024

Historic Market Size - Distribution Channel Segment 2020 - 2024 ($ million)

5.4 Formulation segment analysis 2020 - 2024

Historic Market Size - Formulation Segment 2020 - 2024 ($ million)

5.5 Geography segment analysis 2020 - 2024

Historic Market Size - Geography Segment 2020 - 2024 ($ million)

5.6 Country segment analysis 2020 - 2024

Historic Market Size - Country Segment 2020 - 2024 ($ million)

6. Qualitative Analysis

6.1 The AI impact on global Coq10 supplement market

7. Five Forces Analysis

7.1 Five forces summary

Five forces analysis - Comparison between 2025 and 2030

7.2 Bargaining power of buyers

Bargaining power of buyers - Impact of key factors 2025 and 2030

7.3 Bargaining power of suppliers

Bargaining power of suppliers - Impact of key factors in 2025 and 2030

7.4 Threat of new entrants

Threat of new entrants - Impact of key factors in 2025 and 2030

7.5 Threat of substitutes

Threat of substitutes - Impact of key factors in 2025 and 2030

7.6 Threat of rivalry

Threat of rivalry - Impact of key factors in 2025 and 2030

7.7 Market condition

Chart on Market condition - Five forces 2025 and 2030

8. Market Segmentation by Application

8.1 Market segments

Chart on Application - Market share 2025-2030 (%)
Data Table on Application - Market share 2025-2030 (%)

8.2 Comparison by Application

Chart on Comparison by Application
Data Table on Comparison by Application

8.3 Dietary supplements - Market size and forecast 2025-2030

Chart on Dietary supplements - Market size and forecast 2025-2030 ($ million)
Data Table on Dietary supplements - Market size and forecast 2025-2030 ($ million)
Chart on Dietary supplements - Year-over-year growth 2025-2030 (%)
Data Table on Dietary supplements - Year-over-year growth 2025-2030 (%)

8.4 Pharmaceuticals - Market size and forecast 2025-2030

Chart on Pharmaceuticals - Market size and forecast 2025-2030 ($ million)
Data Table on Pharmaceuticals - Market size and forecast 2025-2030 ($ million)
Chart on Pharmaceuticals - Year-over-year growth 2025-2030 (%)
Data Table on Pharmaceuticals - Year-over-year growth 2025-2030 (%)

8.5 Cosmetics - Market size and forecast 2025-2030

Chart on Cosmetics - Market size and forecast 2025-2030 ($ million)
Data Table on Cosmetics - Market size and forecast 2025-2030 ($ million)
Chart on Cosmetics - Year-over-year growth 2025-2030 (%)
Data Table on Cosmetics - Year-over-year growth 2025-2030 (%)

8.6 Market opportunity by Application

Market opportunity by Application ($ million)
Data Table on Market opportunity by Application ($ million)

9. Market Segmentation by Distribution Channel

9.1 Market segments

Chart on Distribution Channel - Market share 2025-2030 (%)
Data Table on Distribution Channel - Market share 2025-2030 (%)

9.2 Comparison by Distribution Channel

Chart on Comparison by Distribution Channel
Data Table on Comparison by Distribution Channel

9.3 Offline - Market size and forecast 2025-2030

Chart on Offline - Market size and forecast 2025-2030 ($ million)
Data Table on Offline - Market size and forecast 2025-2030 ($ million)
Chart on Offline - Year-over-year growth 2025-2030 (%)
Data Table on Offline - Year-over-year growth 2025-2030 (%)

9.4 Online - Market size and forecast 2025-2030

Chart on Online - Market size and forecast 2025-2030 ($ million)
Data Table on Online - Market size and forecast 2025-2030 ($ million)
Chart on Online - Year-over-year growth 2025-2030 (%)
Data Table on Online - Year-over-year growth 2025-2030 (%)

9.5 Market opportunity by Distribution Channel

Market opportunity by Distribution Channel ($ million)
Data Table on Market opportunity by Distribution Channel ($ million)

10. Market Segmentation by Formulation

10.1 Market segments

Chart on Formulation - Market share 2025-2030 (%)
Data Table on Formulation - Market share 2025-2030 (%)

10.2 Comparison by Formulation

Chart on Comparison by Formulation
Data Table on Comparison by Formulation

10.3 Softgels - Market size and forecast 2025-2030

Chart on Softgels - Market size and forecast 2025-2030 ($ million)
Data Table on Softgels - Market size and forecast 2025-2030 ($ million)
Chart on Softgels - Year-over-year growth 2025-2030 (%)
Data Table on Softgels - Year-over-year growth 2025-2030 (%)

10.4 Tablets - Market size and forecast 2025-2030

Chart on Tablets - Market size and forecast 2025-2030 ($ million)
Data Table on Tablets - Market size and forecast 2025-2030 ($ million)
Chart on Tablets - Year-over-year growth 2025-2030 (%)
Data Table on Tablets - Year-over-year growth 2025-2030 (%)

10.5 Powder - Market size and forecast 2025-2030

Chart on Powder - Market size and forecast 2025-2030 ($ million)
Data Table on Powder - Market size and forecast 2025-2030 ($ million)
Chart on Powder - Year-over-year growth 2025-2030 (%)
Data Table on Powder - Year-over-year growth 2025-2030 (%)

10.6 Others - Market size and forecast 2025-2030

Chart on Others - Market size and forecast 2025-2030 ($ million)
Data Table on Others - Market size and forecast 2025-2030 ($ million)
Chart on Others - Year-over-year growth 2025-2030 (%)
Data Table on Others - Year-over-year growth 2025-2030 (%)

10.7 Market opportunity by Formulation

Market opportunity by Formulation ($ million)
Data Table on Market opportunity by Formulation ($ million)

11. Customer Landscape

11.1 Customer landscape overview

Analysis of price sensitivity, lifecycle, customer purchase basket, adoption rates, and purchase criteria

12. Geographic Landscape

12.1 Geographic segmentation

Chart on Market share by geography 2025-2030 (%)
Data Table on Market share by geography 2025-2030 (%)

12.2 Geographic comparison

Chart on Geographic comparison
Data Table on Geographic comparison

12.3 North America - Market size and forecast 2025-2030

Chart on North America - Market size and forecast 2025-2030 ($ million)
Data Table on North America - Market size and forecast 2025-2030 ($ million)
Chart on North America - Year-over-year growth 2025-2030 (%)
Data Table on North America - Year-over-year growth 2025-2030 (%)
Chart on Regional Comparison - North America
Data Table on Regional Comparison - North America

12.3.1 US - Market size and forecast 2025-2030

Chart on US - Market size and forecast 2025-2030 ($ million)
Data Table on US - Market size and forecast 2025-2030 ($ million)
Chart on US - Year-over-year growth 2025-2030 (%)
Data Table on US - Year-over-year growth 2025-2030 (%)

12.3.2 Canada - Market size and forecast 2025-2030

Chart on Canada - Market size and forecast 2025-2030 ($ million)
Data Table on Canada - Market size and forecast 2025-2030 ($ million)
Chart on Canada - Year-over-year growth 2025-2030 (%)
Data Table on Canada - Year-over-year growth 2025-2030 (%)

12.3.3 Mexico - Market size and forecast 2025-2030

Chart on Mexico - Market size and forecast 2025-2030 ($ million)
Data Table on Mexico - Market size and forecast 2025-2030 ($ million)
Chart on Mexico - Year-over-year growth 2025-2030 (%)
Data Table on Mexico - Year-over-year growth 2025-2030 (%)

12.4 Europe - Market size and forecast 2025-2030

Chart on Europe - Market size and forecast 2025-2030 ($ million)
Data Table on Europe - Market size and forecast 2025-2030 ($ million)
Chart on Europe - Year-over-year growth 2025-2030 (%)
Data Table on Europe - Year-over-year growth 2025-2030 (%)
Chart on Regional Comparison - Europe
Data Table on Regional Comparison - Europe

12.4.1 Germany - Market size and forecast 2025-2030

Chart on Germany - Market size and forecast 2025-2030 ($ million)
Data Table on Germany - Market size and forecast 2025-2030 ($ million)
Chart on Germany - Year-over-year growth 2025-2030 (%)
Data Table on Germany - Year-over-year growth 2025-2030 (%)

12.4.2 UK - Market size and forecast 2025-2030

Chart on UK - Market size and forecast 2025-2030 ($ million)
Data Table on UK - Market size and forecast 2025-2030 ($ million)
Chart on UK - Year-over-year growth 2025-2030 (%)
Data Table on UK - Year-over-year growth 2025-2030 (%)

12.4.3 France - Market size and forecast 2025-2030

Chart on France - Market size and forecast 2025-2030 ($ million)
Data Table on France - Market size and forecast 2025-2030 ($ million)
Chart on France - Year-over-year growth 2025-2030 (%)
Data Table on France - Year-over-year growth 2025-2030 (%)

12.4.4 Italy - Market size and forecast 2025-2030

Chart on Italy - Market size and forecast 2025-2030 ($ million)
Data Table on Italy - Market size and forecast 2025-2030 ($ million)
Chart on Italy - Year-over-year growth 2025-2030 (%)
Data Table on Italy - Year-over-year growth 2025-2030 (%)

12.4.5 Spain - Market size and forecast 2025-2030

Chart on Spain - Market size and forecast 2025-2030 ($ million)
Data Table on Spain - Market size and forecast 2025-2030 ($ million)
Chart on Spain - Year-over-year growth 2025-2030 (%)
Data Table on Spain - Year-over-year growth 2025-2030 (%)

12.4.6 The Netherlands - Market size and forecast 2025-2030

Chart on The Netherlands - Market size and forecast 2025-2030 ($ million)
Data Table on The Netherlands - Market size and forecast 2025-2030 ($ million)
Chart on The Netherlands - Year-over-year growth 2025-2030 (%)
Data Table on The Netherlands - Year-over-year growth 2025-2030 (%)

12.4.7 Russia - Market size and forecast 2025-2030

Chart on Russia - Market size and forecast 2025-2030 ($ million)
Data Table on Russia - Market size and forecast 2025-2030 ($ million)
Chart on Russia - Year-over-year growth 2025-2030 (%)
Data Table on Russia - Year-over-year growth 2025-2030 (%)

12.5 Asia - Market size and forecast 2025-2030

Chart on Asia - Market size and forecast 2025-2030 ($ million)
Data Table on Asia - Market size and forecast 2025-2030 ($ million)
Chart on Asia - Year-over-year growth 2025-2030 (%)
Data Table on Asia - Year-over-year growth 2025-2030 (%)
Chart on Regional Comparison - Asia
Data Table on Regional Comparison - Asia

12.5.1 China - Market size and forecast 2025-2030

Chart on China - Market size and forecast 2025-2030 ($ million)
Data Table on China - Market size and forecast 2025-2030 ($ million)
Chart on China - Year-over-year growth 2025-2030 (%)
Data Table on China - Year-over-year growth 2025-2030 (%)

12.5.2 Japan - Market size and forecast 2025-2030

Chart on Japan - Market size and forecast 2025-2030 ($ million)
Data Table on Japan - Market size and forecast 2025-2030 ($ million)
Chart on Japan - Year-over-year growth 2025-2030 (%)
Data Table on Japan - Year-over-year growth 2025-2030 (%)

12.5.3 India - Market size and forecast 2025-2030

Chart on India - Market size and forecast 2025-2030 ($ million)
Data Table on India - Market size and forecast 2025-2030 ($ million)
Chart on India - Year-over-year growth 2025-2030 (%)
Data Table on India - Year-over-year growth 2025-2030 (%)

12.5.4 South Korea - Market size and forecast 2025-2030

Chart on South Korea - Market size and forecast 2025-2030 ($ million)
Data Table on South Korea - Market size and forecast 2025-2030 ($ million)
Chart on South Korea - Year-over-year growth 2025-2030 (%)
Data Table on South Korea - Year-over-year growth 2025-2030 (%)

12.5.5 Singapore - Market size and forecast 2025-2030

Chart on Singapore - Market size and forecast 2025-2030 ($ million)
Data Table on Singapore - Market size and forecast 2025-2030 ($ million)
Chart on Singapore - Year-over-year growth 2025-2030 (%)
Data Table on Singapore - Year-over-year growth 2025-2030 (%)

12.5.6 Indonesia - Market size and forecast 2025-2030

Chart on Indonesia - Market size and forecast 2025-2030 ($ million)
Data Table on Indonesia - Market size and forecast 2025-2030 ($ million)
Chart on Indonesia - Year-over-year growth 2025-2030 (%)
Data Table on Indonesia - Year-over-year growth 2025-2030 (%)

12.5.7 Thailand - Market size and forecast 2025-2030

Chart on Thailand - Market size and forecast 2025-2030 ($ million)
Data Table on Thailand - Market size and forecast 2025-2030 ($ million)
Chart on Thailand - Year-over-year growth 2025-2030 (%)
Data Table on Thailand - Year-over-year growth 2025-2030 (%)

12.6 Rest of World (ROW) - Market size and forecast 2025-2030

Chart on Rest of World (ROW) - Market size and forecast 2025-2030 ($ million)
Data Table on Rest of World (ROW) - Market size and forecast 2025-2030 ($ million)
Chart on Rest of World (ROW) - Year-over-year growth 2025-2030 (%)
Data Table on Rest of World (ROW) - Year-over-year growth 2025-2030 (%)
Chart on Regional Comparison - Rest of World (ROW)
Data Table on Regional Comparison - Rest of World (ROW)

12.6.1 Australia - Market size and forecast 2025-2030

Chart on Australia - Market size and forecast 2025-2030 ($ million)
Data Table on Australia - Market size and forecast 2025-2030 ($ million)
Chart on Australia - Year-over-year growth 2025-2030 (%)
Data Table on Australia - Year-over-year growth 2025-2030 (%)

12.6.2 UAE - Market size and forecast 2025-2030

Chart on UAE - Market size and forecast 2025-2030 ($ million)
Data Table on UAE - Market size and forecast 2025-2030 ($ million)
Chart on UAE - Year-over-year growth 2025-2030 (%)
Data Table on UAE - Year-over-year growth 2025-2030 (%)

12.6.3 Brazil - Market size and forecast 2025-2030

Chart on Brazil - Market size and forecast 2025-2030 ($ million)
Data Table on Brazil - Market size and forecast 2025-2030 ($ million)
Chart on Brazil - Year-over-year growth 2025-2030 (%)
Data Table on Brazil - Year-over-year growth 2025-2030 (%)

12.6.4 South Africa - Market size and forecast 2025-2030

Chart on South Africa - Market size and forecast 2025-2030 ($ million)
Data Table on South Africa - Market size and forecast 2025-2030 ($ million)
Chart on South Africa - Year-over-year growth 2025-2030 (%)
Data Table on South Africa - Year-over-year growth 2025-2030 (%)

12.6.5 Saudi Arabia - Market size and forecast 2025-2030

Chart on Saudi Arabia - Market size and forecast 2025-2030 ($ million)
Data Table on Saudi Arabia - Market size and forecast 2025-2030 ($ million)
Chart on Saudi Arabia - Year-over-year growth 2025-2030 (%)
Data Table on Saudi Arabia - Year-over-year growth 2025-2030 (%)

12.6.6 Turkey - Market size and forecast 2025-2030

Chart on Turkey - Market size and forecast 2025-2030 ($ million)
Data Table on Turkey - Market size and forecast 2025-2030 ($ million)
Chart on Turkey - Year-over-year growth 2025-2030 (%)
Data Table on Turkey - Year-over-year growth 2025-2030 (%)

12.7 Market opportunity by geography

Market opportunity by geography ($ million)
Data Tables on Market opportunity by geography ($ million)

13. Drivers, Challenges, and Opportunity

13.1 Market drivers

Increasing global geriatric population and emphasis on healthy aging
Heightened consumer awareness of preventive healthcare and coq10 benefits
Persistent scientific research and technological advancements in formulation and bioavailability

13.2 Market challenges

Complex and divergent regulatory landscapes and burden of claim substantiation
Intense competition, product commoditization, and margin pressure
High and volatile raw material costs and concentrated supply chain

13.3 Impact of drivers and challenges

Impact of drivers and challenges in 2025 and 2030

13.4 Market opportunities

Proliferation of synergistic combination formulas for targeted health applications
Innovation in delivery formats to enhance consumer experience and broaden appeal
Ascendancy of ubiquinol and focus on enhanced bioavailability

14. Competitive Landscape

14.1 Overview

14.2

Overview on criticality of inputs and factors of differentiation

14.3 Landscape disruption

Overview on factors of disruption

14.4 Industry risks

Impact of key risks on business

15. Competitive Analysis

15.1 Companies profiled

Companies covered

15.2 Company ranking index

15.3 Market positioning of companies

Matrix on companies position and classification

15.4 Abbott Laboratories

Abbott Laboratories - Overview
Abbott Laboratories - Business segments
Abbott Laboratories - Key news
Abbott Laboratories - Key offerings
Abbott Laboratories - Segment focus
SWOT

15.5 Bausch Health Companies Inc.

Bausch Health Companies Inc. - Overview
Bausch Health Companies Inc. - Business segments
Bausch Health Companies Inc. - Key news
Bausch Health Companies Inc. - Key offerings
Bausch Health Companies Inc. - Segment focus
SWOT

15.6 Carlyle Nutritionals LLC

Carlyle Nutritionals LLC - Overview
Carlyle Nutritionals LLC - Product / Service
Carlyle Nutritionals LLC - Key offerings
SWOT

15.7 Church and Dwight Co. Inc.

Church and Dwight Co. Inc. - Overview
Church and Dwight Co. Inc. - Business segments
Church and Dwight Co. Inc. - Key offerings
Church and Dwight Co. Inc. - Segment focus
SWOT

15.8 DSM Firmenich AG

DSM Firmenich AG - Overview
DSM Firmenich AG - Business segments
DSM Firmenich AG - Key news
DSM Firmenich AG - Key offerings
DSM Firmenich AG - Segment focus
SWOT

15.9 GNC Holdings LLC

GNC Holdings LLC - Overview
GNC Holdings LLC - Product / Service
GNC Holdings LLC - Key news
GNC Holdings LLC - Key offerings
SWOT

15.10 Indena S.p.A.

Indena S.p.A. - Overview
Indena S.p.A. - Product / Service
Indena S.p.A. - Key offerings
SWOT

15.11 Kaneka Corp.

Kaneka Corp. - Overview
Kaneka Corp. - Business segments
Kaneka Corp. - Key news
Kaneka Corp. - Key offerings
Kaneka Corp. - Segment focus
SWOT

15.12 Life Extension Foundation

Life Extension Foundation - Overview
Life Extension Foundation - Product / Service
Life Extension Foundation - Key offerings
SWOT

15.13 Nestle SA

Nestle SA - Overview
Nestle SA - Business segments
Nestle SA - Key news
Nestle SA - Key offerings
Nestle SA - Segment focus
SWOT

15.14 NOW Health Group Inc.

NOW Health Group Inc. - Overview
NOW Health Group Inc. - Product / Service
NOW Health Group Inc. - Key offerings
SWOT

15.15 Otsuka Holdings Co. Ltd.

Otsuka Holdings Co. Ltd. - Overview
Otsuka Holdings Co. Ltd. - Business segments
Otsuka Holdings Co. Ltd. - Key news
Otsuka Holdings Co. Ltd. - Key offerings
Otsuka Holdings Co. Ltd. - Segment focus
SWOT

15.16 Pharma Nord Inc.

Pharma Nord Inc. - Overview
Pharma Nord Inc. - Product / Service
Pharma Nord Inc. - Key offerings
SWOT

15.17 Sanofi SA

Sanofi SA - Overview
Sanofi SA - Business segments
Sanofi SA - Key news
Sanofi SA - Key offerings
Sanofi SA - Segment focus
SWOT

15.18 Xiamen Kingdomway Group Co.

Xiamen Kingdomway Group Co. - Overview
Xiamen Kingdomway Group Co. - Product / Service
Xiamen Kingdomway Group Co. - Key offerings
SWOT

16. Appendix

16.1 Scope of the report

Market definition
Objectives
Notes and caveats

16.2 Inclusions and exclusions checklist

Inclusions checklist
Exclusions checklist

16.3 Currency conversion rates for US$

16.4 Research methodology

16.5 Data procurement

Information sources

16.6 Data validation

16.7 Validation techniques employed for market sizing

16.8 Data synthesis

16.9 360 degree market analysis

16.10 List of abbreviations

Research Methodology

Technavio presents a detailed picture of the market by way of study, synthesis, and summation of data from multiple sources. The analysts have presented the various facets of the market with a particular focus on identifying the key industry influencers. The data thus presented is comprehensive, reliable, and the result of extensive research, both primary and secondary.

INFORMATION SOURCES

Primary sources

  • Manufacturers and suppliers
  • Channel partners
  • Industry experts
  • Strategic decision makers

Secondary sources

  • Industry journals and periodicals
  • Government data
  • Financial reports of key industry players
  • Historical data
  • Press releases

DATA ANALYSIS

Data Synthesis

  • Collation of data
  • Estimation of key figures
  • Analysis of derived insights

Data Validation

  • Triangulation with data models
  • Reference against proprietary databases
  • Corroboration with industry experts

REPORT WRITING

Qualitative

  • Market drivers
  • Market challenges
  • Market trends
  • Five forces analysis

Quantitative

  • Market size and forecast
  • Market segmentation
  • Geographical insights
  • Competitive landscape

Interested in this report?

Get your sample now to see our research methodology and insights!

Download Now

Frequently Asked Questions

Coq10 Supplement market growth will increase by USD 565.8 million during 2026-2030.

The Coq10 Supplement market is expected to grow at a CAGR of 12.8% during 2026-2030.

Coq10 Supplement market is segmented by Application (Dietary supplements, Pharmaceuticals, Cosmetics) Distribution channel (Offline, Online) Formulation (Softgels, Tablets, Powder, Others)

Abbott Laboratories, AdvaCare Pharma, Bausch Health Companies Inc., BioThrive Sciences, Bluebonnet Nutrition Corp., Carlyle Nutritionals LLC, Church and Dwight Co. Inc., DSM Firmenich AG, GNC Holdings LLC, Indena S.p.A., INLIFE Pharma Pvt. Ltd., Jarrow Formulas Inc., Kaneka Corp., Life Extension Foundation, Nestle SA, NOW Health Group Inc., Otsuka Holdings Co. Ltd., Pharma Nord Inc., Sanofi SA, Xiamen Kingdomway Group Co. are a few of the key vendors in the Coq10 Supplement market.

North America will register the highest growth rate of 40% among the other regions. Therefore, the Coq10 Supplement market in North America is expected to garner significant business opportunities for the vendors during the forecast period.

US, Canada, Mexico, Germany, UK, France, Italy, Spain, The Netherlands, Russia, China, Japan, India, South Korea, Singapore, Indonesia, Thailand, Australia, UAE, Brazil, South Africa, Saudi Arabia, Turkey

  • Increasing global geriatric population and emphasis on healthy aging is the driving factor this market.

The Coq10 Supplement market vendors should focus on grabbing business opportunities from the Application segment as it accounted for the largest market share in the base year.