Cotton Picker Market Analysis, Size, and Forecast 2026-2030: North America (US, Canada, and Mexico), APAC (China, Australia, and India), Europe (Spain, Germany, and Italy), South America (Brazil, Argentina, and Colombia), Middle East and Africa (Turkey, South Africa, and Israel), and Rest of World (ROW)

Cotton Picker Market Analysis, Size, and Forecast 2026-2030:
North America (US, Canada, and Mexico), APAC (China, Australia, and India), Europe (Spain, Germany, and Italy), South America (Brazil, Argentina, and Colombia), Middle East and Africa (Turkey, South Africa, and Israel), and Rest of World (ROW)

Published: Dec 2025 284 Pages SKU: IRTNTR81192

Market Overview at a Glance

$197.7 Mn
Market Opportunity
4%
CAGR 2025 - 2030
39.1%
APAC Growth
$738.3 Mn
Diesel-powered pickers segment 2024

Cotton Picker Market Size 2026-2030

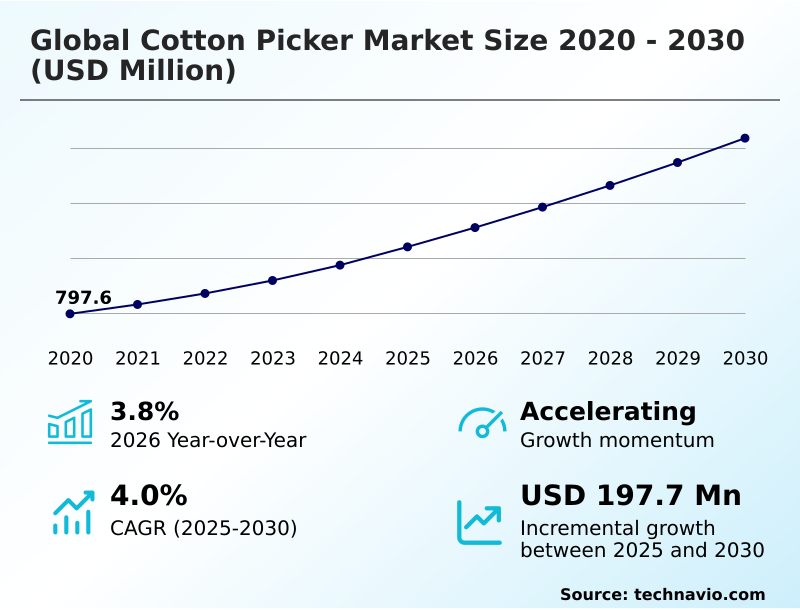
The cotton picker market size is valued to increase by USD 197.7 million, at a CAGR of 4% from 2025 to 2030. Technological advancements in precision agriculture and autonomous operations will drive the cotton picker market.

Major Market Trends & Insights

  • APAC dominated the market and accounted for a 39.1% growth during the forecast period.
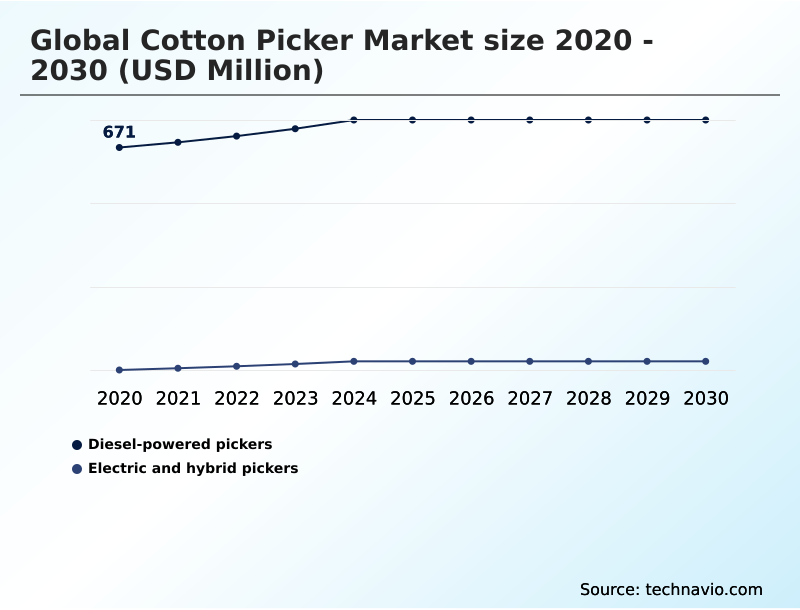
  • By Fuel Type - Diesel-powered pickers segment was valued at USD 738.3 million in 2024
  • By Type - Spindle picker segment accounted for the largest market revenue share in 2024

Market Size & Forecast

  • Market Opportunities: USD 319.4 million
  • Market Future Opportunities: USD 197.7 million
  • CAGR from 2025 to 2030 : 4%

Market Summary

What will be the Size of the Cotton Picker Market during the forecast period?

Get Key Insights on Market Forecast (PDF) Request Free Sample

How is the Cotton Picker Market Segmented?

The cotton picker industry research report provides comprehensive data (region-wise segment analysis), with forecasts and estimates in "USD million" for the period 2026-2030, as well as historical data from 2020-2024 for the following segments.

  • Fuel type
    • Diesel-powered pickers
    • Electric and hybrid pickers
  • Type
    • Spindle picker
    • Stripper
  • Product type
    • Self-propelled picker
    • Tractor-mounted picker
  • Geography
    • North America
      • US
      • Canada
      • Mexico
    • APAC
      • China
      • Australia
      • India
    • Europe
      • Spain
      • Germany
      • Italy
    • South America
      • Brazil
      • Argentina
      • Colombia
    • Middle East and Africa
      • Turkey
      • South Africa
      • Israel
    • Rest of World (ROW)

By Fuel Type Insights

The diesel-powered pickers segment is estimated to witness significant growth during the forecast period.

Request Free Sample

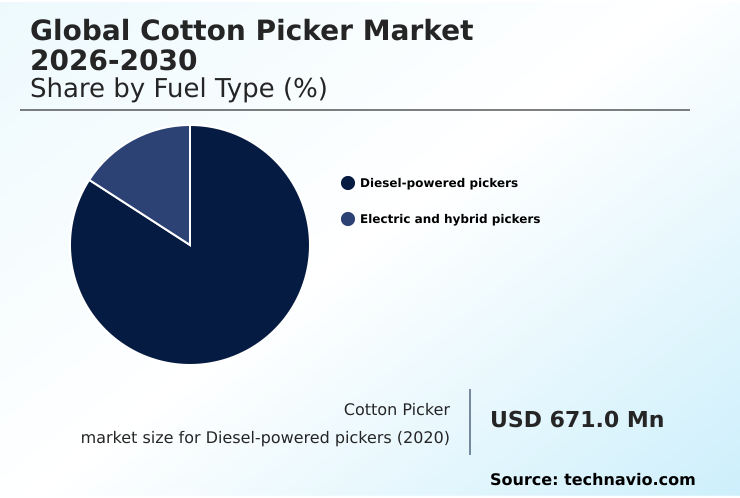
The Diesel-powered pickers segment was valued at USD 738.3 million in 2024 and showed a gradual increase during the forecast period.

Request Free Sample

Regional Analysis

APAC is estimated to contribute 39.1% to the growth of the global market during the forecast period.Technavio’s analysts have elaborately explained the regional trends and drivers that shape the market during the forecast period.

See How Cotton Picker Market Demand is Rising in APAC Request Free Sample

Market Dynamics

Our researchers analyzed the data with 2025 as the base year, along with the key drivers, trends, and challenges. A holistic analysis of drivers will help companies refine their marketing strategies to gain a competitive advantage.

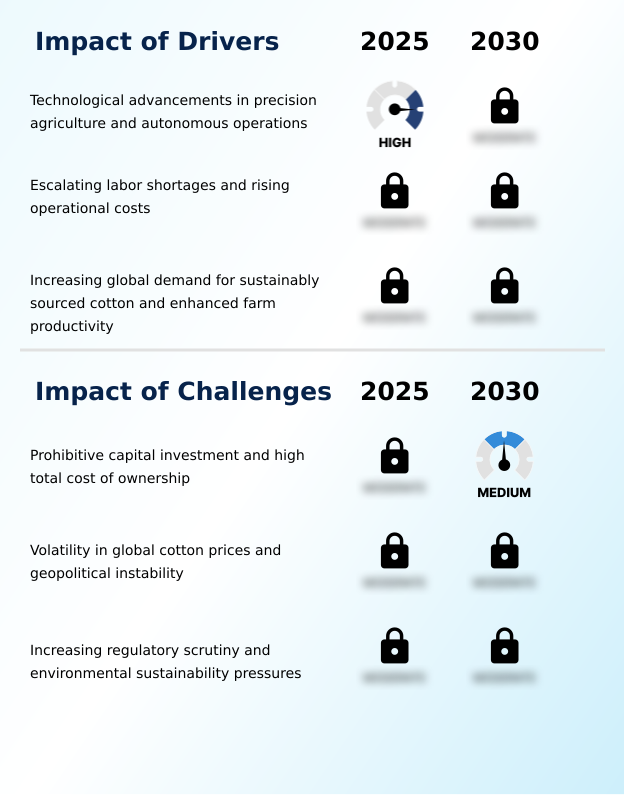
What are the key market drivers leading to the rise in the adoption of Cotton Picker Industry?

What are the market trends shaping the Cotton Picker Industry?

What challenges does the Cotton Picker Industry face during its growth?

Exclusive Technavio Analysis on Customer Landscape

The cotton picker market forecasting report includes the adoption lifecycle of the market, covering from the innovator’s stage to the laggard’s stage. It focuses on adoption rates in different regions based on penetration. Furthermore, the cotton picker market report also includes key purchase criteria and drivers of price sensitivity to help companies evaluate and develop their market growth analysis strategies.

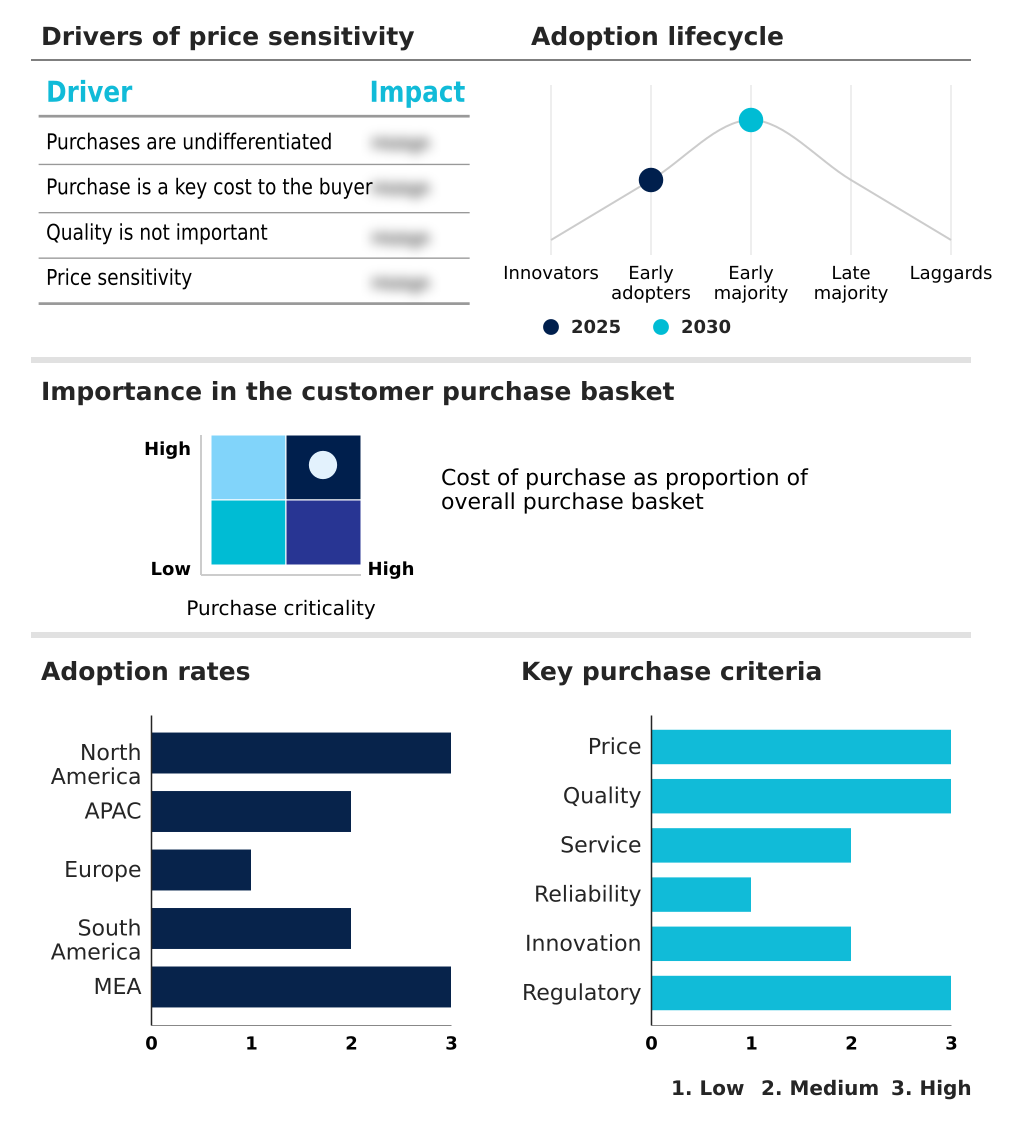
Customer Landscape of Cotton Picker Industry

Competitive Landscape

Companies are implementing various strategies, such as strategic alliances, cotton picker market forecast, partnerships, mergers and acquisitions, geographical expansion, and product/service launches, to enhance their presence in the industry.

Cansa Agriculture -

The industry research and growth report includes detailed analyses of the competitive landscape of the market and information about key companies, including:

  • Cansa Agriculture
  • Changzhou DGC Ltd.
  • China National Machinery Ltd.
  • CNH Industrial N.V.
  • DASMESH MW Pvt. Ltd.
  • Deere and Co.
  • Erisha Agritech
  • JWA Machinery Co., Ltd.
  • Lovol Heavy Industry Co. Ltd.
  • OZEN IS
  • Sampo-Rosenlew Oy
  • Shandong Swan Machinery Ltd.
  • Tirth Agro Technology Pvt. Ltd.
  • Wuhan Anon TTC Ltd
  • Xinjiang Boshiran Co. Ltd
  • Zoomlion Heavy Tech Co. Ltd.

Qualitative and quantitative analysis of companies has been conducted to help clients understand the wider business environment as well as the strengths and weaknesses of key industry players. Data is qualitatively analyzed to categorize companies as pure play, category-focused, industry-focused, and diversified; it is quantitatively analyzed to categorize companies as dominant, leading, strong, tentative, and weak.

Recent Development and News in Cotton picker market

Dive into Technavio’s robust research methodology, blending expert interviews, extensive data synthesis, and validated models for unparalleled Cotton Picker Market insights. See full methodology.

Market Scope
Page number 284
Base year 2025
Historic period 2020-2024
Forecast period 2026-2030
Growth momentum & CAGR Accelerate at a CAGR of 4%
Market growth 2026-2030 USD 197.7 million
Market structure Fragmented
YoY growth 2025-2026(%) 3.8%
Key countries US, Canada, Mexico, China, Australia, India, Vietnam, Pakistan, Myanmar, Greece, Spain, Germany, Italy, Bulgaria, Portugal, Brazil, Argentina, Colombia, Turkey, South Africa, Egypt, Israel and Nigeria
Competitive landscape Leading Companies, Market Positioning of Companies, Competitive Strategies, and Industry Risks

Request Free Sample

Research Analyst Overview

What are the Key Data Covered in this Cotton Picker Market Research and Growth Report?

  • What is the expected growth of the Cotton Picker Market between 2026 and 2030?

    • USD 197.7 million, at a CAGR of 4%

  • What segmentation does the market report cover?

    • The report is segmented by Fuel Type (Diesel-powered pickers, and Electric and hybrid pickers), Type (Spindle picker, and Stripper), Product Type (Self-propelled picker, and Tractor-mounted picker) and Geography (North America, APAC, Europe, South America, Middle East and Africa)

  • Which regions are analyzed in the report?

    • North America, APAC, Europe, South America and Middle East and Africa

  • What are the key growth drivers and market challenges?

    • Technological advancements in precision agriculture and autonomous operations, Prohibitive capital investment and high total cost of ownership

  • Who are the major players in the Cotton Picker Market?

    • Cansa Agriculture, Changzhou DGC Ltd., China National Machinery Ltd., CNH Industrial N.V., DASMESH MW Pvt. Ltd., Deere and Co., Erisha Agritech, JWA Machinery Co., Ltd., Lovol Heavy Industry Co. Ltd., OZEN IS, Sampo-Rosenlew Oy, Shandong Swan Machinery Ltd., Tirth Agro Technology Pvt. Ltd., Wuhan Anon TTC Ltd, Xinjiang Boshiran Co. Ltd and Zoomlion Heavy Tech Co. Ltd.

Market Research Insights

We can help! Our analysts can customize this cotton picker market research report to meet your requirements.

Get in touch

1. Executive Summary

1.1 Market overview

Executive Summary - Chart on Market Overview
Executive Summary - Data Table on Market Overview
Executive Summary - Chart on Global Market Characteristics
Executive Summary - Chart on Market by Geography
Executive Summary - Chart on Market Segmentation by Fuel Type
Executive Summary - Chart on Market Segmentation by Type
Executive Summary - Chart on Market Segmentation by Product Type
Executive Summary - Chart on Incremental Growth
Executive Summary - Data Table on Incremental Growth
Executive Summary - Chart on Company Market Positioning

2. Technavio Analysis

2.1 Analysis of price sensitivity, lifecycle, customer purchase basket, adoption rates, and purchase criteria

2.2 Criticality of inputs and Factors of differentiation

Chart on Overview on criticality of inputs and factors of differentiation

2.3 Factors of disruption

Chart on Overview on factors of disruption

2.4 Impact of drivers and challenges

Chart on Impact of drivers and challenges in 2025 and 2030

3. Market Landscape

3.1 Market ecosystem

Chart on Parent Market
Data Table on - Parent Market

3.2 Market characteristics

Chart on Market characteristics analysis

3.3 Value chain analysis

Chart on Value chain analysis

4. Market Sizing

4.1 Market definition

Data Table on Offerings of companies included in the market definition

4.2 Market segment analysis

Market segments

4.3 Market size 2025

4.4 Market outlook: Forecast for 2025-2030

Chart on Global - Market size and forecast 2025-2030 ($ million)
Data Table on Global - Market size and forecast 2025-2030 ($ million)
Chart on Global Market: Year-over-year growth 2025-2030 (%)
Data Table on Global Market: Year-over-year growth 2025-2030 (%)

5. Historic Market Size

5.1 Global Cotton Picker Market 2020 - 2024

Historic Market Size - Data Table on Global Cotton Picker Market 2020 - 2024 ($ million)

5.2 Fuel Type segment analysis 2020 - 2024

Historic Market Size - Fuel Type Segment 2020 - 2024 ($ million)

5.3 Type segment analysis 2020 - 2024

Historic Market Size - Type Segment 2020 - 2024 ($ million)

5.4 Product Type segment analysis 2020 - 2024

Historic Market Size - Product Type Segment 2020 - 2024 ($ million)

5.5 Geography segment analysis 2020 - 2024

Historic Market Size - Geography Segment 2020 - 2024 ($ million)

5.6 Country segment analysis 2020 - 2024

Historic Market Size - Country Segment 2020 - 2024 ($ million)

6. Qualitative Analysis

6.1 Impact of AI on the Global Cotton Picker Market

7. Five Forces Analysis

7.1 Five forces summary

Five forces analysis - Comparison between 2025 and 2030

7.2 Bargaining power of buyers

Bargaining power of buyers - Impact of key factors 2025 and 2030

7.3 Bargaining power of suppliers

Bargaining power of suppliers - Impact of key factors in 2025 and 2030

7.4 Threat of new entrants

Threat of new entrants - Impact of key factors in 2025 and 2030

7.5 Threat of substitutes

Threat of substitutes - Impact of key factors in 2025 and 2030

7.6 Threat of rivalry

Threat of rivalry - Impact of key factors in 2025 and 2030

7.7 Market condition

Chart on Market condition - Five forces 2025 and 2030

8. Market Segmentation by Fuel Type

8.1 Market segments

Chart on Fuel Type - Market share 2025-2030 (%)
Data Table on Fuel Type - Market share 2025-2030 (%)

8.2 Comparison by Fuel Type

Chart on Comparison by Fuel Type
Data Table on Comparison by Fuel Type

8.3 Diesel-powered pickers - Market size and forecast 2025-2030

Chart on Diesel-powered pickers - Market size and forecast 2025-2030 ($ million)
Data Table on Diesel-powered pickers - Market size and forecast 2025-2030 ($ million)
Chart on Diesel-powered pickers - Year-over-year growth 2025-2030 (%)
Data Table on Diesel-powered pickers - Year-over-year growth 2025-2030 (%)

8.4 Electric and hybrid pickers - Market size and forecast 2025-2030

Chart on Electric and hybrid pickers - Market size and forecast 2025-2030 ($ million)
Data Table on Electric and hybrid pickers - Market size and forecast 2025-2030 ($ million)
Chart on Electric and hybrid pickers - Year-over-year growth 2025-2030 (%)
Data Table on Electric and hybrid pickers - Year-over-year growth 2025-2030 (%)

8.5 Market opportunity by Fuel Type

Market opportunity by Fuel Type ($ million)
Data Table on Market opportunity by Fuel Type ($ million)

9. Market Segmentation by Type

9.1 Market segments

Chart on Type - Market share 2025-2030 (%)
Data Table on Type - Market share 2025-2030 (%)

9.2 Comparison by Type

Chart on Comparison by Type
Data Table on Comparison by Type

9.3 Spindle picker - Market size and forecast 2025-2030

Chart on Spindle picker - Market size and forecast 2025-2030 ($ million)
Data Table on Spindle picker - Market size and forecast 2025-2030 ($ million)
Chart on Spindle picker - Year-over-year growth 2025-2030 (%)
Data Table on Spindle picker - Year-over-year growth 2025-2030 (%)

9.4 Stripper - Market size and forecast 2025-2030

Chart on Stripper - Market size and forecast 2025-2030 ($ million)
Data Table on Stripper - Market size and forecast 2025-2030 ($ million)
Chart on Stripper - Year-over-year growth 2025-2030 (%)
Data Table on Stripper - Year-over-year growth 2025-2030 (%)

9.5 Market opportunity by Type

Market opportunity by Type ($ million)
Data Table on Market opportunity by Type ($ million)

10. Market Segmentation by Product Type

10.1 Market segments

Chart on Product Type - Market share 2025-2030 (%)
Data Table on Product Type - Market share 2025-2030 (%)

10.2 Comparison by Product Type

Chart on Comparison by Product Type
Data Table on Comparison by Product Type

10.3 Self-propelled picker - Market size and forecast 2025-2030

Chart on Self-propelled picker - Market size and forecast 2025-2030 ($ million)
Data Table on Self-propelled picker - Market size and forecast 2025-2030 ($ million)
Chart on Self-propelled picker - Year-over-year growth 2025-2030 (%)
Data Table on Self-propelled picker - Year-over-year growth 2025-2030 (%)

10.4 Tractor-mounted picker - Market size and forecast 2025-2030

Chart on Tractor-mounted picker - Market size and forecast 2025-2030 ($ million)
Data Table on Tractor-mounted picker - Market size and forecast 2025-2030 ($ million)
Chart on Tractor-mounted picker - Year-over-year growth 2025-2030 (%)
Data Table on Tractor-mounted picker - Year-over-year growth 2025-2030 (%)

10.5 Market opportunity by Product Type

Market opportunity by Product Type ($ million)
Data Table on Market opportunity by Product Type ($ million)

11. Customer Landscape

11.1 Customer landscape overview

Analysis of price sensitivity, lifecycle, customer purchase basket, adoption rates, and purchase criteria

12. Geographic Landscape

12.1 Geographic segmentation

Chart on Market share by geography 2025-2030 (%)
Data Table on Market share by geography 2025-2030 (%)

12.2 Geographic comparison

Chart on Geographic comparison
Data Table on Geographic comparison

12.3 North America - Market size and forecast 2025-2030

Chart on North America - Market size and forecast 2025-2030 ($ million)
Data Table on North America - Market size and forecast 2025-2030 ($ million)
Chart on North America - Year-over-year growth 2025-2030 (%)
Data Table on North America - Year-over-year growth 2025-2030 (%)
Chart on Regional Comparison - North America
Data Table on Regional Comparison - North America

12.3.1 US - Market size and forecast 2025-2030

Chart on US - Market size and forecast 2025-2030 ($ million)
Data Table on US - Market size and forecast 2025-2030 ($ million)
Chart on US - Year-over-year growth 2025-2030 (%)
Data Table on US - Year-over-year growth 2025-2030 (%)

12.3.2 Canada - Market size and forecast 2025-2030

Chart on Canada - Market size and forecast 2025-2030 ($ million)
Data Table on Canada - Market size and forecast 2025-2030 ($ million)
Chart on Canada - Year-over-year growth 2025-2030 (%)
Data Table on Canada - Year-over-year growth 2025-2030 (%)

12.3.3 Mexico - Market size and forecast 2025-2030

Chart on Mexico - Market size and forecast 2025-2030 ($ million)
Data Table on Mexico - Market size and forecast 2025-2030 ($ million)
Chart on Mexico - Year-over-year growth 2025-2030 (%)
Data Table on Mexico - Year-over-year growth 2025-2030 (%)

12.4 APAC - Market size and forecast 2025-2030

Chart on APAC - Market size and forecast 2025-2030 ($ million)
Data Table on APAC - Market size and forecast 2025-2030 ($ million)
Chart on APAC - Year-over-year growth 2025-2030 (%)
Data Table on APAC - Year-over-year growth 2025-2030 (%)
Chart on Regional Comparison - APAC
Data Table on Regional Comparison - APAC

12.4.1 China - Market size and forecast 2025-2030

Chart on China - Market size and forecast 2025-2030 ($ million)
Data Table on China - Market size and forecast 2025-2030 ($ million)
Chart on China - Year-over-year growth 2025-2030 (%)
Data Table on China - Year-over-year growth 2025-2030 (%)

12.4.2 Australia - Market size and forecast 2025-2030

Chart on Australia - Market size and forecast 2025-2030 ($ million)
Data Table on Australia - Market size and forecast 2025-2030 ($ million)
Chart on Australia - Year-over-year growth 2025-2030 (%)
Data Table on Australia - Year-over-year growth 2025-2030 (%)

12.4.3 India - Market size and forecast 2025-2030

Chart on India - Market size and forecast 2025-2030 ($ million)
Data Table on India - Market size and forecast 2025-2030 ($ million)
Chart on India - Year-over-year growth 2025-2030 (%)
Data Table on India - Year-over-year growth 2025-2030 (%)

12.4.4 Vietnam - Market size and forecast 2025-2030

Chart on Vietnam - Market size and forecast 2025-2030 ($ million)
Data Table on Vietnam - Market size and forecast 2025-2030 ($ million)
Chart on Vietnam - Year-over-year growth 2025-2030 (%)
Data Table on Vietnam - Year-over-year growth 2025-2030 (%)

12.4.5 Pakistan - Market size and forecast 2025-2030

Chart on Pakistan - Market size and forecast 2025-2030 ($ million)
Data Table on Pakistan - Market size and forecast 2025-2030 ($ million)
Chart on Pakistan - Year-over-year growth 2025-2030 (%)
Data Table on Pakistan - Year-over-year growth 2025-2030 (%)

12.4.6 Myanmar - Market size and forecast 2025-2030

Chart on Myanmar - Market size and forecast 2025-2030 ($ million)
Data Table on Myanmar - Market size and forecast 2025-2030 ($ million)
Chart on Myanmar - Year-over-year growth 2025-2030 (%)
Data Table on Myanmar - Year-over-year growth 2025-2030 (%)

12.5 Europe - Market size and forecast 2025-2030

Chart on Europe - Market size and forecast 2025-2030 ($ million)
Data Table on Europe - Market size and forecast 2025-2030 ($ million)
Chart on Europe - Year-over-year growth 2025-2030 (%)
Data Table on Europe - Year-over-year growth 2025-2030 (%)
Chart on Regional Comparison - Europe
Data Table on Regional Comparison - Europe

12.5.1 Greece - Market size and forecast 2025-2030

Chart on Greece - Market size and forecast 2025-2030 ($ million)
Data Table on Greece - Market size and forecast 2025-2030 ($ million)
Chart on Greece - Year-over-year growth 2025-2030 (%)
Data Table on Greece - Year-over-year growth 2025-2030 (%)

12.5.2 Spain - Market size and forecast 2025-2030

Chart on Spain - Market size and forecast 2025-2030 ($ million)
Data Table on Spain - Market size and forecast 2025-2030 ($ million)
Chart on Spain - Year-over-year growth 2025-2030 (%)
Data Table on Spain - Year-over-year growth 2025-2030 (%)

12.5.3 Germany - Market size and forecast 2025-2030

Chart on Germany - Market size and forecast 2025-2030 ($ million)
Data Table on Germany - Market size and forecast 2025-2030 ($ million)
Chart on Germany - Year-over-year growth 2025-2030 (%)
Data Table on Germany - Year-over-year growth 2025-2030 (%)

12.5.4 Italy - Market size and forecast 2025-2030

Chart on Italy - Market size and forecast 2025-2030 ($ million)
Data Table on Italy - Market size and forecast 2025-2030 ($ million)
Chart on Italy - Year-over-year growth 2025-2030 (%)
Data Table on Italy - Year-over-year growth 2025-2030 (%)

12.5.5 Bulgaria - Market size and forecast 2025-2030

Chart on Bulgaria - Market size and forecast 2025-2030 ($ million)
Data Table on Bulgaria - Market size and forecast 2025-2030 ($ million)
Chart on Bulgaria - Year-over-year growth 2025-2030 (%)
Data Table on Bulgaria - Year-over-year growth 2025-2030 (%)

12.5.6 Portugal - Market size and forecast 2025-2030

Chart on Portugal - Market size and forecast 2025-2030 ($ million)
Data Table on Portugal - Market size and forecast 2025-2030 ($ million)
Chart on Portugal - Year-over-year growth 2025-2030 (%)
Data Table on Portugal - Year-over-year growth 2025-2030 (%)

12.6 South America - Market size and forecast 2025-2030

Chart on South America - Market size and forecast 2025-2030 ($ million)
Data Table on South America - Market size and forecast 2025-2030 ($ million)
Chart on South America - Year-over-year growth 2025-2030 (%)
Data Table on South America - Year-over-year growth 2025-2030 (%)
Chart on Regional Comparison - South America
Data Table on Regional Comparison - South America

12.6.1 Brazil - Market size and forecast 2025-2030

Chart on Brazil - Market size and forecast 2025-2030 ($ million)
Data Table on Brazil - Market size and forecast 2025-2030 ($ million)
Chart on Brazil - Year-over-year growth 2025-2030 (%)
Data Table on Brazil - Year-over-year growth 2025-2030 (%)

12.6.2 Argentina - Market size and forecast 2025-2030

Chart on Argentina - Market size and forecast 2025-2030 ($ million)
Data Table on Argentina - Market size and forecast 2025-2030 ($ million)
Chart on Argentina - Year-over-year growth 2025-2030 (%)
Data Table on Argentina - Year-over-year growth 2025-2030 (%)

12.6.3 Colombia - Market size and forecast 2025-2030

Chart on Colombia - Market size and forecast 2025-2030 ($ million)
Data Table on Colombia - Market size and forecast 2025-2030 ($ million)
Chart on Colombia - Year-over-year growth 2025-2030 (%)
Data Table on Colombia - Year-over-year growth 2025-2030 (%)

12.7 Middle East and Africa - Market size and forecast 2025-2030

Chart on Middle East and Africa - Market size and forecast 2025-2030 ($ million)
Data Table on Middle East and Africa - Market size and forecast 2025-2030 ($ million)
Chart on Middle East and Africa - Year-over-year growth 2025-2030 (%)
Data Table on Middle East and Africa - Year-over-year growth 2025-2030 (%)
Chart on Regional Comparison - Middle East and Africa
Data Table on Regional Comparison - Middle East and Africa

12.7.1 Turkey - Market size and forecast 2025-2030

Chart on Turkey - Market size and forecast 2025-2030 ($ million)
Data Table on Turkey - Market size and forecast 2025-2030 ($ million)
Chart on Turkey - Year-over-year growth 2025-2030 (%)
Data Table on Turkey - Year-over-year growth 2025-2030 (%)

12.7.2 South Africa - Market size and forecast 2025-2030

Chart on South Africa - Market size and forecast 2025-2030 ($ million)
Data Table on South Africa - Market size and forecast 2025-2030 ($ million)
Chart on South Africa - Year-over-year growth 2025-2030 (%)
Data Table on South Africa - Year-over-year growth 2025-2030 (%)

12.7.3 Egypt - Market size and forecast 2025-2030

Chart on Egypt - Market size and forecast 2025-2030 ($ million)
Data Table on Egypt - Market size and forecast 2025-2030 ($ million)
Chart on Egypt - Year-over-year growth 2025-2030 (%)
Data Table on Egypt - Year-over-year growth 2025-2030 (%)

12.7.4 Israel - Market size and forecast 2025-2030

Chart on Israel - Market size and forecast 2025-2030 ($ million)
Data Table on Israel - Market size and forecast 2025-2030 ($ million)
Chart on Israel - Year-over-year growth 2025-2030 (%)
Data Table on Israel - Year-over-year growth 2025-2030 (%)

12.7.5 Nigeria - Market size and forecast 2025-2030

Chart on Nigeria - Market size and forecast 2025-2030 ($ million)
Data Table on Nigeria - Market size and forecast 2025-2030 ($ million)
Chart on Nigeria - Year-over-year growth 2025-2030 (%)
Data Table on Nigeria - Year-over-year growth 2025-2030 (%)

12.8 Market opportunity by geography

Market opportunity by geography ($ million)
Data Tables on Market opportunity by geography ($ million)

13. Drivers, Challenges, and Opportunity

13.1 Market drivers

Technological advancements in precision agriculture and autonomous operations
Escalating labor shortages and rising operational costs
Increasing global demand for sustainably sourced cotton and enhanced farm productivity

13.2 Market challenges

Prohibitive capital investment and high total cost of ownership
Volatility in global cotton prices and geopolitical instability
Increasing regulatory scrutiny and environmental sustainability pressures

13.3 Impact of drivers and challenges

Impact of drivers and challenges in 2025 and 2030

13.4 Market opportunities

Proliferation of autonomous operations and artificial intelligence integration
Emphasis on sustainable harvesting and data-driven traceability
Exploration of electrification and alternative powertrains

14. Competitive Landscape

14.1 Overview

14.2

Overview on criticality of inputs and factors of differentiation

14.3 Landscape disruption

Overview on factors of disruption

14.4 Industry risks

Impact of key risks on business

15. Competitive Analysis

15.1 Companies profiled

Companies covered

15.2 Company ranking index

15.3 Market positioning of companies

Matrix on companies position and classification

15.4 Cansa Agriculture

Cansa Agriculture - Overview
Cansa Agriculture - Product / Service
Cansa Agriculture - Key offerings
SWOT

15.5 Changzhou DGC Ltd.

Changzhou DGC Ltd. - Overview
Changzhou DGC Ltd. - Product / Service
Changzhou DGC Ltd. - Key offerings
SWOT

15.6 China National Machinery Ltd.

China National Machinery Ltd. - Overview
China National Machinery Ltd. - Product / Service
China National Machinery Ltd. - Key offerings
SWOT

15.7 CNH Industrial N.V.

CNH Industrial N.V. - Overview
CNH Industrial N.V. - Product / Service
CNH Industrial N.V. - Key news
CNH Industrial N.V. - Key offerings
SWOT

15.8 DASMESH MW Pvt. Ltd.

DASMESH MW Pvt. Ltd. - Overview
DASMESH MW Pvt. Ltd. - Product / Service
DASMESH MW Pvt. Ltd. - Key offerings
SWOT

15.9 Deere and Co.

Deere and Co. - Overview
Deere and Co. - Business segments
Deere and Co. - Key news
Deere and Co. - Key offerings
Deere and Co. - Segment focus
SWOT

15.10 Erisha Agritech

Erisha Agritech - Overview
Erisha Agritech - Product / Service
Erisha Agritech - Key offerings
SWOT

15.11 JWA Machinery Co., Ltd.

JWA Machinery Co., Ltd. - Overview
JWA Machinery Co., Ltd. - Product / Service
JWA Machinery Co., Ltd. - Key offerings
SWOT

15.12 Lovol Heavy Industry Co. Ltd.

Lovol Heavy Industry Co. Ltd. - Overview
Lovol Heavy Industry Co. Ltd. - Product / Service
Lovol Heavy Industry Co. Ltd. - Key offerings
SWOT

15.13 OZEN IS

OZEN IS - Overview
OZEN IS - Product / Service
OZEN IS - Key offerings
SWOT

15.14 Sampo-Rosenlew Oy

Sampo-Rosenlew Oy - Overview
Sampo-Rosenlew Oy - Product / Service
Sampo-Rosenlew Oy - Key offerings
SWOT

15.15 Shandong Swan Machinery Ltd.

Shandong Swan Machinery Ltd. - Overview
Shandong Swan Machinery Ltd. - Product / Service
Shandong Swan Machinery Ltd. - Key offerings
SWOT

15.16 Tirth Agro Technology Pvt. Ltd.

Tirth Agro Technology Pvt. Ltd. - Overview
Tirth Agro Technology Pvt. Ltd. - Product / Service
Tirth Agro Technology Pvt. Ltd. - Key offerings
SWOT

15.17 Xinjiang Boshiran Co. Ltd

Xinjiang Boshiran Co. Ltd - Overview
Xinjiang Boshiran Co. Ltd - Product / Service
Xinjiang Boshiran Co. Ltd - Key offerings
SWOT

15.18 Zoomlion Heavy Tech Co. Ltd.

Zoomlion Heavy Tech Co. Ltd. - Overview
Zoomlion Heavy Tech Co. Ltd. - Business segments
Zoomlion Heavy Tech Co. Ltd. - Key offerings
Zoomlion Heavy Tech Co. Ltd. - Segment focus
SWOT

16. Appendix

16.1 Scope of the report

Market definition
Objectives
Notes and caveats

16.2 Inclusions and exclusions checklist

Inclusions checklist
Exclusions checklist

16.3 Currency conversion rates for US$

16.4 Research methodology

16.5 Data procurement

Information sources

16.6 Data validation

16.7 Validation techniques employed for market sizing

16.8 Data synthesis

16.9 360 degree market analysis

16.10 List of abbreviations

Research Methodology

Technavio presents a detailed picture of the market by way of study, synthesis, and summation of data from multiple sources. The analysts have presented the various facets of the market with a particular focus on identifying the key industry influencers. The data thus presented is comprehensive, reliable, and the result of extensive research, both primary and secondary.

INFORMATION SOURCES

Primary sources

  • Manufacturers and suppliers
  • Channel partners
  • Industry experts
  • Strategic decision makers

Secondary sources

  • Industry journals and periodicals
  • Government data
  • Financial reports of key industry players
  • Historical data
  • Press releases

DATA ANALYSIS

Data Synthesis

  • Collation of data
  • Estimation of key figures
  • Analysis of derived insights

Data Validation

  • Triangulation with data models
  • Reference against proprietary databases
  • Corroboration with industry experts

REPORT WRITING

Qualitative

  • Market drivers
  • Market challenges
  • Market trends
  • Five forces analysis

Quantitative

  • Market size and forecast
  • Market segmentation
  • Geographical insights
  • Competitive landscape

Interested in this report?

Get your sample now to see our research methodology and insights!

Download Now

Frequently Asked Questions

Cotton Picker market growth will increase by USD 197.7 million during 2026-2030 .

The Cotton Picker market is expected to grow at a CAGR of 4% during 2026-2030 .

Cotton Picker market is segmented by Fuel type (Diesel-powered pickers, Electric and hybrid pickers) Type (Spindle picker, Stripper) Product type (Self-propelled picker, Tractor-mounted picker)

Cansa Agriculture, Changzhou DGC Ltd., China National Machinery Ltd., CNH Industrial N.V., DASMESH MW Pvt. Ltd., Deere and Co., Erisha Agritech, JWA Machinery Co., Ltd., Lovol Heavy Industry Co. Ltd., OZEN IS, Sampo-Rosenlew Oy, Shandong Swan Machinery Ltd., Tirth Agro Technology Pvt. Ltd., Wuhan Anon TTC Ltd, Xinjiang Boshiran Co. Ltd, Zoomlion Heavy Tech Co. Ltd. are a few of the key vendors in the Cotton Picker market.

APAC will register the highest growth rate of 39.1% among the other regions. Therefore, the Cotton Picker market in APAC is expected to garner significant business opportunities for the vendors during the forecast period.

US, Canada, Mexico, China, Australia, India, Vietnam, Pakistan, Myanmar, Greece, Spain, Germany, Italy, Bulgaria, Portugal, Brazil, Argentina, Colombia, Turkey, South Africa, Egypt, Israel, Nigeria

  • Technological advancements in precision agriculture and autonomous operations is the driving factor this market.

The Cotton Picker market vendors should focus on grabbing business opportunities from the Fuel type segment as it accounted for the largest market share in the base year.