Crude Oil Flow Improvers Market by Product, Application, and Geography - Forecast and Analysis 2021-2025

Crude Oil Flow Improvers Market by Product, Application, and Geography - Forecast and Analysis 2021-2025

Published: Jul 2021 120 Pages SKU: IRTNTR45393

Market Overview at a Glance

$32.7 B
Market Opportunity
4.02%
CAGR
YoY growth 2020-2021(%)

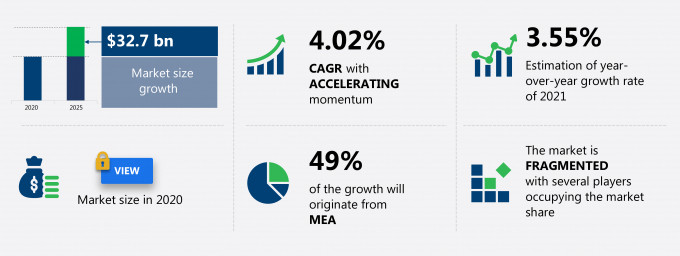
The crude oil flow improvers market share is expected to increase by USD 32.7 billion from 2020 to 2025, and the market’s growth momentum will accelerate at a CAGR of 4.02%.

This crude oil flow improvers market research report provides valuable insights on the post COVID-19 impact on the market, which will help companies evaluate their business approaches. Furthermore, this report extensively covers crude oil flow improvers market segmentation by product (paraffin inhibitors, asphaltene inhibitors, scale inhibitors, drag-reducing agents, and hydrate inhibitors), application (extraction, refining, and transportation), and geography (MEA, North America, Europe, APAC, and South America). The crude oil flow improvers market report also offers information on several market vendors, including Baker Hughes Co., BASF SE, Clariant International Ltd., Croda International Plc, Dorf Ketal Chemicals (I) Pvt. Ltd., Dow Inc., Evonik Industries AG, Infineum International Ltd., Schlumberger Ltd., and The Lubrizol Corp. among others.

What will the Crude Oil Flow Improvers Market Size be During the Forecast Period?

Download the Free Report Sample to Unlock the Crude Oil Flow Improvers Market Size for the Forecast Period and Other Important Statistics


Crude Oil Flow Improvers Market: Key Drivers, Trends, and Challenges

Based on our research output, there has been a neutral impact on the market growth during and post COVID-19 era. The shift from shallow to deep water exploration is notably driving the crude oil flow improvers market growth, although factors such as stringent regulations and policies may impede the market growth. Our research analysts have studied the historical data and deduced the key market drivers and the COVID-19 pandemic impact on the crude oil flow improvers industry. The holistic analysis of the drivers will help in deducing end goals and refining marketing strategies to gain a competitive edge.

Key Crude Oil Flow Improvers Market Driver

The shift from shallow to Deepwater exploration is one of the key factors driving the growth of the global crude oil flow improvers market. Most of the offshore production is mainly concentrated in shallow waters because of the low cost and technical challenges. Advances in drilling technology, floating production, dynamic positioning equipment, and drilling units have made deepwater exploration a viable option. The exhaustion of some of the shallow offshore resources has pushed the vendors to explore and produce oil and gas from deepwater and ultra-deepwater (at depths of 1,500 meters or more) resources. The increasing oil exploration in deepwater and ultra-deepwater is expected to drive the demand for crude oil flow improvers. Low temperatures and high pressure on offshore locations can lead to the precipitation of waxes, hydrates, and asphaltenes. Crude oil flow improvers enhance the flow assurance of crude oil and help in increasing production capacity.

Key Crude Oil Flow Improvers Market Trend

The refracturing of old crude oil wells will fuel the global crude oil flow and improvers market growth. Refracturing shale wells is a topical issue as operators can use the latest technologies on old wells, thereby increasing the production without incurring costs on new wells. The functions of old or underperforming wells are stopped, and hydraulic stimulation is applied for completion. The application of hydraulic stimulation in horizontal shale wells is in the initial phase. The fracking process uses horizontal drilling to access the shale deposits that were previously inaccessible using conventional drilling methods. After drilling into the earth, a high-pressure water mixture, which is called fracking fluid, is applied to the rock to trigger the release of the gas and petroleum present inside. The rising adoption of the fracking technique has enabled energy companies to discover and obtain very large quantities of oil and natural gas in various parts of the world. Such instances of mergers and acquisitions are expected to foster market growth during the forecast period.

Key Crude Oil Flow Improvers Market Challenge

The stringent regulations and policies are a major challenge for the global crude oil flow and improvers market growth. The US Environmental Protection Agency (EPA) is undertaking a study to understand the relationship between hydraulic fracturing and drinking water resources and focus on the fracturing of shale natural gas wells. In California, a lawsuit was filed, which challenged the Federal government's insufficient investigation of the offshore fracking threats on the coast of California. Following France, Bulgaria, and Germany, Scotland banned the fracking process in 2015 because of its harmful environmental effects. The UK, Romania, Denmark, Ireland, South Africa, and the Czech Republic have imposed moratoriums on fracking. However, under an emergency order, the US EPA forced three oil production companies operating in the Fort Peck Reservation in the US to repay the city of Poplar, Montana, US, for expenditure on water infrastructure incurred as a result of their drilling activities. All these regulations have restricted improvements in hydraulic fracturing technology, thereby slowing down the growth of the global crude oil flow improvers market.

This crude oil flow improvers market analysis report also provides detailed information on other upcoming trends and challenges that will have a far-reaching effect on the market growth. The actionable insights on the trends and challenges will help companies evaluate and develop growth strategies for 2021-2025.

Parent Market Analysis

Technavio categorizes the global crude oil flow improvers market as a part of the global commodity chemicals market within the global chemicals market. Our research report has extensively covered external factors influencing the parent market growth potential in the coming years, which will determine the levels of growth of the crude oil flow improvers market during the forecast period.

Who are the Major Crude Oil Flow Improvers Market Vendors?

The report analyzes the market’s competitive landscape and offers information on several market vendors, including:


  • Baker Hughes Co.
  • BASF SE
  • Clariant International Ltd.
  • Croda International Plc
  • Dorf Ketal Chemicals (I) Pvt. Ltd.
  • Dow Inc.
  • Evonik Industries AG
  • Infineum International Ltd.
  • Schlumberger Ltd.
  • The Lubrizol Corp.


This statistical study of the crude oil flow improvers market encompasses successful business strategies deployed by the key vendors. The crude oil flow improvers market is fragmented and the vendors are deploying organic and inorganic growth strategies to compete in the market.

Product Insights and News

  • Baker Hughes Co. - The company offers crude oil flow improvers under the brand, TOLAD

To make the most of the opportunities and recover from post COVID-19 impact, market vendors should focus more on the growth prospects in the fast-growing segments, while maintaining their positions in the slow-growing segments.

The crude oil flow improvers market forecast report offers in-depth insights into key vendor profiles. The profiles include information on the production, sustainability, and prospects of the leading companies.

Crude Oil Flow Improvers Market Value Chain Analysis

Our report provides extensive information on the value chain analysis for the crude oil flow improvers market, which vendors can leverage to gain a competitive advantage during the forecast period. The end-to-end understanding of the value chain is essential in profit margin optimization and evaluation of business strategies. The data available in our value chain analysis segment can help vendors drive costs and enhance customer services during the forecast period.

The value chain of the global chemicals market includes the following core components:

  • Inputs
  • Inbound logistics
  • Operations
  • Outbound logistics
  • Marketing and sales
  • Service
  • Support activities
  • Innovation

The report has further elucidated other innovative approaches being followed by service providers to ensure a sustainable market presence.

Which are the Key Regions for Crude Oil Flow Improvers Market?

For more insights on the market share of various regions Request for a FREE sample now!

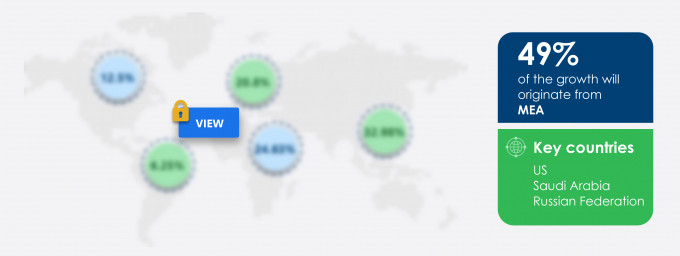
49% of the market’s growth will originate from MEA during the forecast period. Saudi Arabia and Iraq are the key markets for crude oil flow improvers market in MEA. Market growth in this region will be faster than the growth of the market in regions.

The shift from shallow to Deepwater exploration will facilitate the crude oil flow improvers market growth in MEA over the forecast period. This market research report entails detailed information on the competitive intelligence, marketing gaps, and regional opportunities in store for vendors, which will assist in creating efficient business plans.

COVID Impact and Recovery Analysis

MEA has also been affected by the outbreak of the COVID-19 pandemic, which is posing a major challenge to oil and gas extraction activities. Iran, Saudi Arabia, Qatar, Egypt, Bahrain, Iraq, the UAE, Kuwait, South Africa, and Algeria are some of the key countries affected by the pandemic in the region. Hence, oil production units in the region have been closed to contain the spread of the pandemic. However, in 2021, the initiation of large-scale vaccination drives lifted the lockdown and travel restrictions, which led to the resumption of supply chain activities. Such factors are expected to drive the market during the forecast period.

What are the Revenue-generating Product Segments in the Crude Oil Flow Improvers Market?

To gain further insights on the market contribution of various segments Request for a FREE sample

The crude oil flow improvers market share growth by the paraffin inhibitors segment will be significant during the forecast period. Rising global demand for paraffin inhibitors, especially in middle eastern markets, has led to a surge in technology advancements by market players in recent past years.

This report provides an accurate prediction of the contribution of all the segments to the growth of the crude oil flow improvers market size and actionable market insights on post COVID-19 impact on each segment.


Crude Oil Flow Improvers Market Scope

Report Coverage

Details

Page number

120

Base year

2020

Forecast period

2021-2025

Growth momentum & CAGR

Accelerate at a CAGR of 4.02%

Market growth 2021-2025

$ 32.7 billion

Market structure

Fragmented

YoY growth (%)

3.55

Regional analysis

MEA, North America, Europe, APAC, and South America

Performing market contribution

MEA at 49%

Key consumer countries

US, Saudi Arabia, Russian Federation, Canada, and Iraq

Competitive landscape

Leading companies, Competitive strategies, Consumer engagement scope

Key companies profiled

Baker Hughes Co., BASF SE, Clariant International Ltd., Croda International Plc, Dorf Ketal Chemicals (I) Pvt. Ltd., Dow Inc., Evonik Industries AG, Infineum International Ltd., Schlumberger Ltd., and The Lubrizol Corp.

Market dynamics

Parent market analysis, Market growth inducers and obstacles, Fast-growing and slow-growing segment analysis, COVID 19 impact and recovery analysis and future consumer dynamics, Market condition analysis for forecast period

Customization purview

If our report has not included the data that you are looking for, you can reach out to our analysts and get segments customized.

Request for a FREE sample

What are the Key Data Covered in this Crude Oil Flow Improvers Market Report?

  • CAGR of the market during the forecast period 2021-2025
  • Detailed information on factors that will drive crude oil flow improvers market growth during the next five years
  • Precise estimation of the crude oil flow improvers market size and its contribution to the parent market
  • Accurate predictions on upcoming trends and changes in consumer behavior
  • The growth of the crude oil flow improvers the market industry across MEA, North America, Europe, APAC, and South America
  • A thorough analysis of the market’s competitive landscape and detailed information on vendors
  • Comprehensive details of factors that will challenge the growth of crude oil flow improvers market vendors

We can help! Our analysts can customize this report to meet your requirements. Get in touch

1 Executive Summary

2 Market Landscape

  • 2.1 Market ecosystem
    • Exhibit 01: Parent market
    • Exhibit 02: Market characteristics
  • 2.2 Value chain analysis
    • Exhibit 03: Value chain analysis: Commodity chemicals market

3 Market Sizing

  • 3.1 Market definition
    • Exhibit 04: Offerings of vendors included in the market definition
  • 3.2 Market segment analysis
    • Exhibit 05: Market segments
  • 3.3 Market size 2020
    • 3.4 Market outlook: Forecast for 2020 - 2025
      • Exhibit 06: Global - Market size and forecast 2020 - 2025 ($ million)
      • Exhibit 07: Global market: Year-over-year growth 2020 - 2025 (%)

    4 Five Forces Analysis

    • 4.1 Five forces summary
      • Exhibit 08: Five forces analysis 2020 & 2025
    • 4.2 Bargaining power of buyers
      • Exhibit 09: Bargaining power of buyers
    • 4.3 Bargaining power of suppliers
      • Exhibit 10: Bargaining power of suppliers
    • 4.4 Threat of new entrants
      • Exhibit 11: Threat of new entrants
    • 4.5 Threat of substitutes
      • Exhibit 12: Threat of substitutes
    • 4.6 Threat of rivalry
      • Exhibit 13: Threat of rivalry
    • 4.7 Market condition
      • Exhibit 14: Market condition - Five forces 2020

    5 Market Segmentation by Product

    • 5.1 Market segments
      • Exhibit 15: Product - Market share 2020-2025 (%)
    • 5.2 Comparison by Product
      • Exhibit 16: Comparison by Product
    • 5.3 Paraffin inhibitors - Market size and forecast 2020-2025
      • Exhibit 17: Paraffin inhibitors - Market size and forecast 2020-2025 ($ million)
      • Exhibit 18: Paraffin inhibitors - Year-over-year growth 2020-2025 (%)
    • 5.4 Asphaltene inhibitors - Market size and forecast 2020-2025
      • Exhibit 19: Asphaltene inhibitors - Market size and forecast 2020-2025 ($ million)
      • Exhibit 20: Asphaltene inhibitors - Year-over-year growth 2020-2025 (%)
    • 5.5 Scale inhibitors - Market size and forecast 2020-2025
      • Exhibit 21: Scale inhibitors - Market size and forecast 2020-2025 ($ million)
      • Exhibit 22: Scale inhibitors - Year-over-year growth 2020-2025 (%)
    • 5.6 Drag reducing agents - Market size and forecast 2020-2025
      • Exhibit 23: Drag reducing agents - Market size and forecast 2020-2025 ($ million)
      • Exhibit 24: Drag reducing agents - Year-over-year growth 2020-2025 (%)
    • 5.7 Hydrate inhibitors - Market size and forecast 2020-2025
      • Exhibit 25: Hydrate inhibitors - Market size and forecast 2020-2025 ($ million)
      • Exhibit 26: Hydrate inhibitors - Year-over-year growth 2020-2025 (%)
    • 5.8 Market opportunity by Product
      • Exhibit 27: Market opportunity by Product

    6 Market Segmentation by Application

    • 6.1 Market segments
      • Exhibit 28: Application - Market share 2020-2025 (%)
    • 6.2 Comparison by Application
      • Exhibit 29: Comparison by Application
    • 6.3 Extraction - Market size and forecast 2020-2025
      • Exhibit 30: Extraction - Market size and forecast 2020-2025 ($ million)
      • Exhibit 31: Extraction - Year-over-year growth 2020-2025 (%)
    • 6.4 Refining - Market size and forecast 2020-2025
      • Exhibit 32: Refining - Market size and forecast 2020-2025 ($ million)
      • Exhibit 33: Refining - Year-over-year growth 2020-2025 (%)
    • 6.5 Transportation - Market size and forecast 2020-2025
      • Exhibit 34: Transportation - Market size and forecast 2020-2025 ($ million)
      • Exhibit 35: Transportation - Year-over-year growth 2020-2025 (%)
    • 6.6 Market opportunity by Application
      • Exhibit 36: Market opportunity by Application

    7 Customer landscape

    8 Geographic Landscape

    • 8.1 Geographic segmentation
      • Exhibit 38: Market share by geography 2020-2025 (%)
    • 8.2 Geographic comparison
      • Exhibit 39: Geographic comparison
    • 8.3 MEA - Market size and forecast 2020-2025
      • Exhibit 40: MEA - Market size and forecast 2020-2025 ($ million)
      • Exhibit 41: MEA - Year-over-year growth 2020-2025 (%)
    • 8.4 North America - Market size and forecast 2020-2025
      • Exhibit 42: North America - Market size and forecast 2020-2025 ($ million)
      • Exhibit 43: North America - Year-over-year growth 2020-2025 (%)
    • 8.5 Europe - Market size and forecast 2020-2025
      • Exhibit 44: Europe - Market size and forecast 2020-2025 ($ million)
      • Exhibit 45: Europe - Year-over-year growth 2020-2025 (%)
    • 8.6 APAC - Market size and forecast 2020-2025
      • Exhibit 46: APAC - Market size and forecast 2020-2025 ($ million)
      • Exhibit 47: APAC - Year-over-year growth 2020-2025 (%)
    • 8.7 South America - Market size and forecast 2020-2025
      • Exhibit 48: South America - Market size and forecast 2020-2025 ($ million)
      • Exhibit 49: South America - Year-over-year growth 2020-2025 (%)
    • 8.8 Key leading countries
      • Exhibit 50: Key leading countries
    • 8.9 Market opportunity by geography
      • Exhibit 51: Market opportunity by geography ($ million)

    9 Drivers, Challenges, and Trends

    • 9.1 Market drivers
      • 9.2 Market challenges
        • Exhibit 52: Impact of drivers and challenges
      • 9.3 Market trends

        10 Vendor Landscape

        • 10.1 Competitive scenario
          • 10.2 Vendor landscape
            • Exhibit 53: Vendor landscape
          • 10.3 Landscape disruption
            • Exhibit 54: Landscape disruption
            • Exhibit 55: Industry risks

          11 Vendor Analysis

          • 11.1 Vendors covered
            • Exhibit 56: Vendors covered
          • 11.2 Market positioning of vendors
            • Exhibit 57: Market positioning of vendors
          • 11.3 Baker Hughes Co.
            • Exhibit 58: Baker Hughes Co. - Overview
            • Exhibit 59: Baker Hughes Co. - Business segments
            • Exhibit 60: Baker Hughes Co. - Key offerings
            • Exhibit 61: Baker Hughes Co. – Key news
            • Exhibit 62: Baker Hughes Co. - Segment focus
          • 11.4 BASF SE
            • Exhibit 63: BASF SE - Overview
            • Exhibit 64: BASF SE - Business segments
            • Exhibit 65: BASF SE - Key offerings
            • Exhibit 66: BASF SE – Key news
            • Exhibit 67: BASF SE - Segment focus
          • 11.5 Clariant International Ltd.
            • Exhibit 68: Clariant International Ltd. - Overview
            • Exhibit 69: Clariant International Ltd. - Business segments
            • Exhibit 70: Clariant International Ltd. - Key offerings
            • Exhibit 71: Clariant International Ltd. – Key news
            • Exhibit 72: Clariant International Ltd. - Segment focus
          • 11.6 Croda International Plc
            • Exhibit 73: Croda International Plc - Overview
            • Exhibit 74: Croda International Plc - Business segments
            • Exhibit 75: Croda International Plc - Key offerings
            • Exhibit 76: Croda International Plc – Key news
            • Exhibit 77: Croda International Plc - Segment focus
          • 11.7 Dorf Ketal Chemicals (I) Pvt. Ltd.
            • Exhibit 78: Dorf Ketal Chemicals (I) Pvt. Ltd. - Overview
            • Exhibit 79: Dorf Ketal Chemicals (I) Pvt. Ltd. - Product and service
            • Exhibit 80: Dorf Ketal Chemicals (I) Pvt. Ltd. - Key offerings
            • Exhibit 81: Dorf Ketal Chemicals (I) Pvt. Ltd. - Segment focus
          • 11.8 Dow Inc.
            • Exhibit 82: Dow Inc. - Overview
            • Exhibit 83: Dow Inc. - Business segments
            • Exhibit 84: Dow Inc. - Key offerings
            • Exhibit 85: Dorf Ketal Chemicals (I) Pvt. Ltd. – Key news
            • Exhibit 86: Dow Inc. - Segment focus
          • 11.9 Evonik Industries AG
            • Exhibit 87: Evonik Industries AG - Overview
            • Exhibit 88: Evonik Industries AG - Business segments
            • Exhibit 89: Evonik Industries AG - Key offerings
            • Exhibit 90: Evonik Industries AG – Key news
            • Exhibit 91: Evonik Industries AG - Segment focus
          • 11.10 Infineum International Ltd.
            • Exhibit 92: Infineum International Ltd. - Overview
            • Exhibit 93: Infineum International Ltd. - Product and service
            • Exhibit 94: Infineum International Ltd. - Key offerings
          • 11.11 Schlumberger Ltd.
            • Exhibit 95: Schlumberger Ltd. - Overview
            • Exhibit 96: Schlumberger Ltd. - Business segments
            • Exhibit 97: Schlumberger Ltd. - Key offerings
            • Exhibit 98: Schlumberger Ltd. – Key news
            • Exhibit 99: Schlumberger Ltd. - Segment focus
          • 11.12 The Lubrizol Corp.
            • Exhibit 100: The Lubrizol Corp. - Overview
            • Exhibit 101: The Lubrizol Corp. - Product and service
            • Exhibit 102: The Lubrizol Corp. - Key offerings

          12 Appendix

          • 12.1 Scope of the report
            • 12.2 Currency conversion rates for US$
              • Exhibit 103: Currency conversion rates for US$
            • 12.3 Research methodology
              • Exhibit 104: Research Methodology
              • Exhibit 105: Validation techniques employed for market sizing
              • Exhibit 106: Information sources
            • 12.4 List of abbreviations
              • Exhibit 107: List of abbreviations

            Research Methodology

            Technavio presents a detailed picture of the market by way of study, synthesis, and summation of data from multiple sources. The analysts have presented the various facets of the market with a particular focus on identifying the key industry influencers. The data thus presented is comprehensive, reliable, and the result of extensive research, both primary and secondary.

            INFORMATION SOURCES

            Primary sources

            • Manufacturers and suppliers
            • Channel partners
            • Industry experts
            • Strategic decision makers

            Secondary sources

            • Industry journals and periodicals
            • Government data
            • Financial reports of key industry players
            • Historical data
            • Press releases

            DATA ANALYSIS

            Data Synthesis

            • Collation of data
            • Estimation of key figures
            • Analysis of derived insights

            Data Validation

            • Triangulation with data models
            • Reference against proprietary databases
            • Corroboration with industry experts

            REPORT WRITING

            Qualitative

            • Market drivers
            • Market challenges
            • Market trends
            • Five forces analysis

            Quantitative

            • Market size and forecast
            • Market segmentation
            • Geographical insights
            • Competitive landscape

            Interested in this report?

            Get your sample now to see our research methodology and insights!

            Download Now

            Frequently Asked Questions

            Crude Oil Flow Improvers market growth will increase by $ 32.7 bn during 2021-2025 .

            The Crude Oil Flow Improvers market is expected to grow at a CAGR of 4.02% during 2021-2025 .

            Crude Oil Flow Improvers market is segmented by Product( paraffin inhibitors, asphaltene inhibitors, scale inhibitors, drag reducing agents, hydrate inhibitors) Application( extraction, refining, transportation)

            Baker Hughes Co., BASF SE, Clariant International Ltd., Croda International Plc, Dorf Ketal Chemicals (I) Pvt. Ltd., Dow Inc., Evonik Industries AG, Infineum International Ltd., Schlumberger Ltd., The Lubrizol Corp. are a few of the key vendors in the Crude Oil Flow Improvers market.

            MEA will register the highest growth rate of 49% among the other regions. Therefore, the Crude Oil Flow Improvers market in MEA is expected to garner significant business opportunities for the vendors during the forecast period.

            US, Saudi Arabia, Russian Federation, Canada, Iraq

            • Shift from s hallow to D eepwater explorationMost of the offshore production is mainly concentrated in shallow waters because of the low cost and technical challenges. Advances in drilling technology is the driving factor this market.
            • floating production is the driving factor this market.
            • dynamic positioning equipment is the driving factor this market.
            • and drilling units have made deepwater exploration a viable option. The exhaustion of some of the shallow offshore resources has pushed the vendors to explore and produce oil and gas from deepwater and ultra-deepwater (at depths of 1 is the driving factor this market.
            • 500 meters or more) resources. The increasing oil exploration in deepwater and ultra-deepwater is expected to drive the demand for crude oil flow improvers. Low temperatures and high pressure on the offshore locations can lead to the precipitation of waxes is the driving factor this market.
            • hydrates is the driving factor this market.
            • and asphaltenes. Crude oil flow improvers enhance the flow assurance of crude oil and help in increasing production capacity. Advances in drilling technology is the driving factor this market.
            • dynamic positioning equipment is the driving factor this market.
            • floating production is the driving factor this market.
            • and a rise in the number of drilling units have augmented the growth in deepwater exploration activities in recent years. Although technological advancements have made new areas accessible is the driving factor this market.
            • deepwater projects require higher investments and time compared to shallow waters or onshore developments. As a result is the driving factor this market.
            • most developing nations with offshore assets still prefer to operate only in shallow water.Major oil and gas companies such as Total SA is the driving factor this market.
            • is the driving factor this market.
            • Exxon is the driving factor this market.
            • Petrobras is the driving factor this market.
            • is the driving factor this market.
            • and others are exploring the potential of deepwater drilling in countries and regions like Brazil is the driving factor this market.
            • China is the driving factor this market.
            • Cuba is the driving factor this market.
            • the Eastern Mediterranean is the driving factor this market.
            • East Africa is the driving factor this market.
            • and the Gulf of Mexico. For instance is the driving factor this market.
            • In January 2020 is the driving factor this market.
            • Total SA is the driving factor this market.
            • a multinational oil and gas company is the driving factor this market.
            • announced the drilling of the world s deepest offshore well in Angola is the driving factor this market.
            • at a record water depth of over 3 is the driving factor this market.
            • 600 meters. Therefore is the driving factor this market.
            • such deepwater drilling activities are expected to propel the demand for crude oil flow improvers is the driving factor this market.
            • during the forecast period. is the driving factor this market.

            The Crude Oil Flow Improvers market vendors should focus on grabbing business opportunities from the paraffin inhibitors segment as it accounted for the largest market share in the base year.