Dried Fruits Market Analysis Europe, North America, APAC, Middle East and Africa, South America - US, China, UK, Germany, India - Size and Forecast 2024-2028

Dried Fruits Market Analysis Europe, North America, APAC, Middle East and Africa, South America - US, China, UK, Germany, India - Size and Forecast 2024-2028

Published: Aug 2024 160 Pages SKU: IRTNTR75262

Market Overview at a Glance

$1.60 B
Market Opportunity
4.36%
CAGR
4.11
YoY growth 2023-2024(%)

Dried Fruits Market Size 2024-2028 

The dried fruits market size is forecast to increase by USD 1.60 billion at a CAGR of 4.36% between 2023 and 2028. The market is experiencing significant growth due to several key trends and drivers. Firstly, the increasing preference for healthy snacking habits among consumers is fueling the demand for dried fruits as they are rich sources of essential vitamins, antioxidants, and vital nutrients. Additionally, dehydration processes preserve the nutritional value of these fruits, making them a popular choice for those following a health-conscious lifestyle. Moreover, the processed foods industry is incorporating dried fruits into various culinary applications due to their versatility and unique flavors. Artificial stimulants are being replaced with natural ingredients, such as dried fruits, to enhance the taste and nutritional value of processed foods. Sustainable packaging options are also gaining popularity in the market as consumers become more environmentally conscious. Online eateries aggregators have made it easier for consumers to order dried fruits and other healthy snacks online, further boosting market growth. However, the market faces challenges such as the negative impacts of climatic change on horticulture, which can affect the availability and quality of raw materials. It is crucial for market players to adapt to these challenges by implementing sustainable farming practices and exploring alternative sourcing options to ensure a consistent supply of high-quality dried fruits.

Dried Fruits Market Size

 Request Free Sample

Dried fruits have gained significant popularity among health-conscious consumers in the US market due to their nutritional benefits. These nutritious snacks are rich in essential vitamins, minerals, fibers, proteins, and unsaturated fats, making them an ideal choice for those following protein-rich diets. The increasing health consciousness among consumers has led to a shift from processed foods containing artificial stimulants towards clean-label products like dehydrated fruits. Dried fruits undergo dehydration processes to preserve their vital nutrients, making them a convenient and healthy alternative to fresh fruits. The stressful work culture in the US has resulted in consumers looking for ready-to-eat and ready-to-cook food options.

Further, dried fruits cater to this demand, providing fiber and potassium, folate and magnesium, vitamin C, and antioxidants. They are also a great source of energy and can be used in various culinary applications. Moreover, dried fruits are an excellent snacking option for those following a healthy diet chart. They are free from added sugars and provide essential nutrients, making them a preferred choice over processed snacks. The channel proliferation of dried fruits in the US market is expected to continue due to their versatility, convenience, and nutritional benefits.

Market Segmentation

The market research report provides comprehensive data (region-wise segment analysis), with forecasts and estimates in "USD million" for the period 2024-2028, as well as historical data from 2018-2022 for the following segments.

  • Product
    • Raisins
    • Dates
    • Apricots
    • Figs
    • Others
  • Distribution Channel
    • Supermarkets and hypermarkets
    • Convenience stores
    • Online
  • Geography
    • Europe
      • Germany
      • UK
    • North America
      • US
    • APAC
      • China
      • India
    • Middle East and Africa
    • South America

By Product Insights

The raisins segment is estimated to witness significant growth during the forecast period. Dried fruits, such as raisins, apricots, figs, dates, and berries, have gained popularity in the US market due to their nutritional benefits and extended shelf life. These fruits undergo a natural drying process that concentrates their nutrients and sugars, making them high in essential vitamins, minerals, and calories. Raisins, for instance, are rich in iron, copper, vitamin K, potassium, manganese, and boron. Boron, specifically, is known to support bone and joint health, aid in wound healing, and enhance cognitive function. Raisins and other dried fruits are also packed with antioxidants, which help protect cells from damage caused by aging and lifestyle-related disorders, such as obesity.

Further, the drying process preserves these antioxidants, making them more potent than in their fresh counterparts. Organic food products, including dried fruits, are increasingly preferred by health-conscious consumers, further fueling market growth. In the bakery and confectionery industries, dried fruits are used as ingredients to add texture, flavor, and nutritional value to various products.

Dried Fruits Market Size

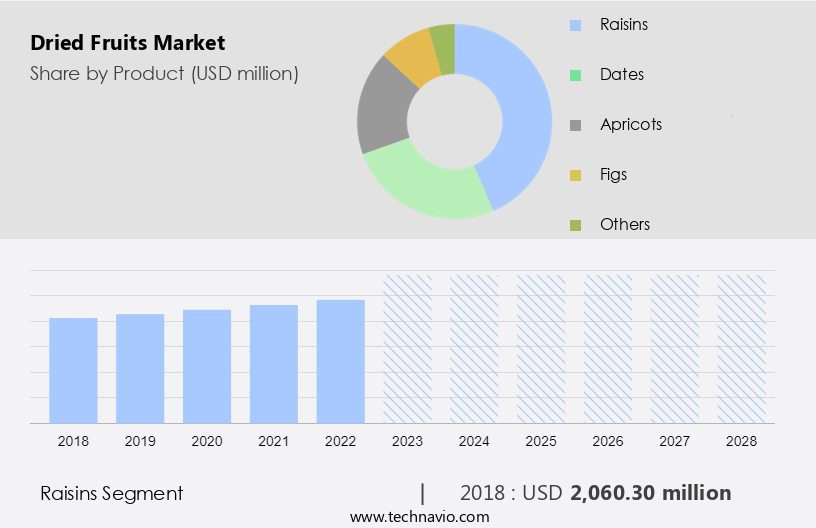
Get a glance at the market share of various segments Request Free Sample

The raisins segment accounted for USD 2.06 billion in 2018 and showed a gradual increase during the forecast period.

Regional Insights

APAC is estimated to contribute 41% to the growth of the global market during the forecast period. Technavio's analysts have elaborately explained the regional trends and drivers that shape the market during the forecast period.

Dried Fruits Market Share by Geography

For more insights on the market share of various regions Request Free Sample

Europe holds a substantial position in The market, serving as a significant consumer and producer. The European market's growth is fueled by the increasing recognition of dried fruits' health advantages, such as their rich fiber, vitamin, and mineral content. Dried fruits have gained popularity in European diets as snacks and components in various food applications, including breakfast cereals, bakery products, and confectionery. Notable European producers, including Turkey, Greece, and Spain, are celebrated for their top-tier dried fruits, such as apricots, figs, raisins, and dates. These countries' production is bolstered by favorable climatic conditions and long-standing cultivation traditions, ensuring a steady flow of superior quality products. Dried fruits, particularly organic ones, offer a longer shelf life than their fresh counterparts, making them a convenient and healthy option for consumers dealing with obesity and lifestyle-related disorders.

Our researchers analyzed the data with 2023 as the base year, along with the key drivers, trends, and challenges. A holistic analysis of drivers will help companies refine their marketing strategies to gain a competitive advantage.

Market Driver

The growing prominence of e-commerce is the key driver of the market. The rising health consciousness among consumers has driven significant growth in the market for dried fruits as they offer numerous nutritional benefits. These nutrient-dense snacks are rich in unsaturated fats, proteins, vitamins, and fibers, making them an ideal addition to protein-rich diets and diet charts. With the increasing preference for nutritious snacks, online distribution channels have emerged as a popular platform for purchasing dried fruits.

Additionally, e-commerce platforms enable consumers to access a wide range of dried fruit brands from various regions, making it convenient for them to meet their nutritional needs. Major online retailers, such as Amazon, Alibaba, and eBay, offer personalized shopping assistance and suggestions on dried fruits, enhancing the overall shopping experience. The ease of purchasing dried fruits online, coupled with their numerous health benefits, is expected to continue driving the growth of this market.

Market Trends

Increasing preference for healthy snacking is the upcoming trend in the market. In today's health-conscious society, consumers are prioritizing nutritious snacking options to support their active lifestyles and manage their weight. Dried fruits have emerged as a popular choice due to their rich nutritional benefits, including unsaturated fats, proteins, vitamins, and fibers. These snacks offer a significant nutritional value compared to processed alternatives, making them an ideal addition to a balanced diet. With the rising concern over obesity and the importance of maintaining a healthy weight, the demand for dried fruits as a nutritious snack option has flooded. Consumers appreciate the convenience of dried fruits as they can be easily carried and consumed throughout the day, ensuring they receive essential vitamins and nutrients to fuel their bodies.

Market Challenge

The negative impacts of climatic change on horticulture is a key challenge affecting the market growth. Dried fruits have gained significant popularity among consumers due to their nutritional benefits and use as nutritious snacks. Consumers are increasingly conscious of their health and are incorporating protein-rich diets and unsaturated fats into their diet charts. Dried fruits, rich in proteins, vitamins, fibers, and unsaturated fats, make an excellent addition to such diets. However, the production of dried fruits can be adversely affected by various weather conditions and environmental factors. Extreme weather conditions, such as heat waves, cold waves, and floods, can negatively impact horticultural output.

Additionally, pollution levels and deforestation can alter the climate, leading to global warming and unfavorable conditions for fruit production.  Despite these challenges, the demand for dried fruits remains strong, making it a resilient market. Consumers continue to seek out these nutrient-dense snacks as part of their health-conscious lifestyle choices.

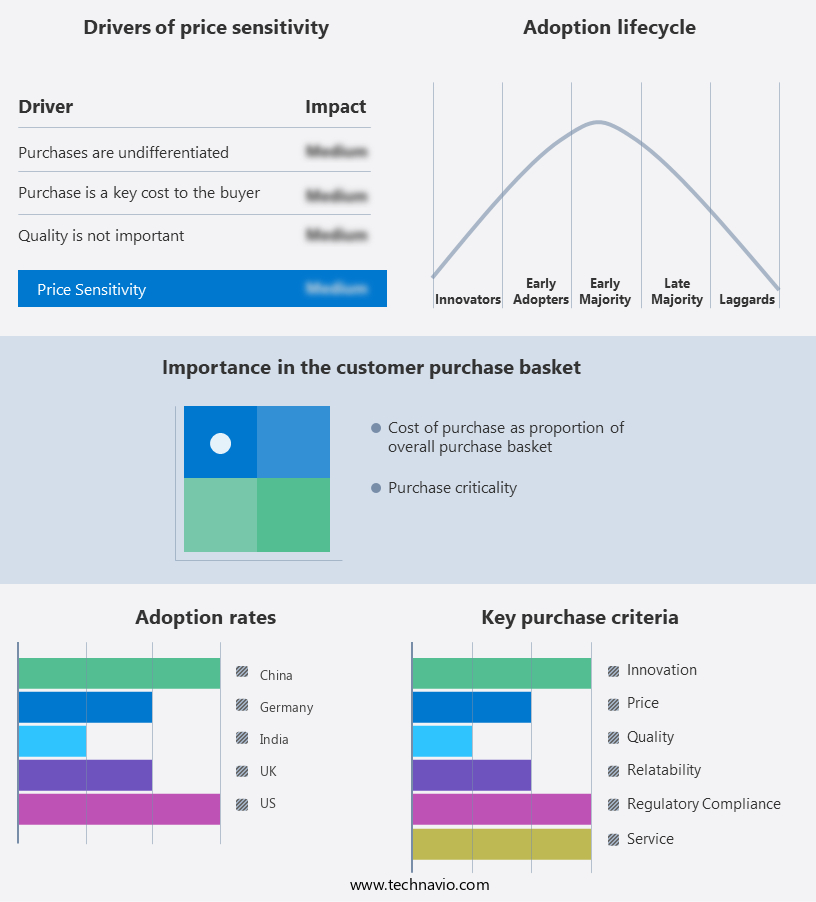
Exclusive Customer Landscape

The market forecasting report includes the adoption lifecycle of the market, covering from the innovator's stage to the laggard's stage. It focuses on adoption rates in different regions based on penetration. Furthermore, the report also includes key purchase criteria and drivers of price sensitivity to help companies evaluate and develop their market growth analysis strategies.

Dried Fruits Market Share by Geography

 Customer Landscape

Key Companies & Market Insights

Companies are implementing various strategies, such as strategic alliances, partnerships, mergers and acquisitions, geographical expansion, and product/service launches, to enhance their presence in the market.

Angas Park: The company offers dried fruits such as Angas Park Whole Prunes, Angas Park Medjool Dates, and Angas Park Diced Apricots.

The market research and growth report includes detailed analyses of the competitive landscape of the market and information about key companies, including:

  • Absolute Organic
  • Agthia Group PJSC
  • Bergin Fruit and Nut Co. Inc.
  • Ceres Enterprises Ltd.
  • Dohler GmbH
  • Geobres S.A.
  • KBB NUTS PVT. LTD.
  • Kiril Mischeff Ltd.
  • LIOGAM Forys Kot Przeslak sp. j.
  • Lion Raisins
  • National Raisin Co.
  • Ocean Spray Cranberries Inc.
  • Paradise Fruits Solutions GmbH and Co. KG
  • Royal Nut Co.
  • Sun Maid Growers of California
  • Sunbeam Foods
  • Sunsweet Growers Inc.
  • Traina Dried Fruit Inc.
  • Woodland Foods Ltd.

Qualitative and quantitative analysis of companies has been conducted to help clients understand the wider business environment as well as the strengths and weaknesses of key market players. Data is qualitatively analyzed to categorize companies as pure play, category-focused, industry-focused, and diversified; it is quantitatively analyzed to categorize companies as dominant, leading, strong, tentative, and weak.

Research Analyst Overview

Dried fruits have gained significant popularity among health-conscious consumers as nutritious snack options. These fruits, including raisins, apricots, figs, dates, and berries, are rich in essential vitamins, minerals, proteins, unsaturated fats, and fibers. Consumers are increasingly incorporating dried fruits into their diet charts due to their nutritional benefits. The trend of protein-rich diets and the rising prevalence of obesity and lifestyle-related disorders have fueled the demand for dried fruits. Dried fruits are used in various food applications, such as bakery and confectionery, breakfast cereals, beverages, and ready-to-cook food. The bakery industry has witnessed the launch of fiber-rich cakes, muffins, snacks, cereal bars, and breakfast bars made with dried fruits. Millennials are particularly drawn to dried fruits due to their long shelf life and convenience. Organic food products, such as dried fruits, are in high demand as consumers seek clean label products free from adulteration during processing.

Additionally, the dehydration processes used to preserve fruits help retain vital nutrients, making dried fruits an excellent source of anti-oxidants and essential vitamins. Sustainable packaging options and waste minimization are crucial considerations in the market. Companies are focusing on extended shelf life and ready-to-use food to cater to the stressful work culture and the increasing demand for processed foods. Online eateries aggregators offer a convenient way for consumers to purchase dried fruits and other healthy snacking options. Dried fruits are an essential component of a balanced diet, providing natural protein, fiber, and essential vitamins and minerals. Athletes and individuals with high carbohydrate intake requirements also benefit from the nutritional benefits of dried fruits. Fiber and potassium, folate and magnesium, and vitamin C are some of the vital nutrients found in dried fruits.

Market Scope

Report Coverage

Details

Page number

160

Base year

2023

Historic period

2018-2022

Forecast period

2024-2028

Growth momentum & CAGR

Accelerate at a CAGR of 4.36%

Market Growth 2024-2028

USD 1.60 billion

Market structure

Fragmented

YoY growth 2023-2024(%)

4.11

Regional analysis

Europe, North America, APAC, Middle East and Africa, and South America

Performing market contribution

APAC at 41%

Key countries

US, China, UK, Germany, and India

Competitive landscape

Leading Companies, Market Positioning of Companies, Competitive Strategies, and Industry Risks

Key companies profiled

Absolute Organic, Agthia Group PJSC, Angas Park, Bergin Fruit and Nut Co. Inc., Ceres Enterprises Ltd., Dohler GmbH, Geobres S.A., KBB NUTS PVT. LTD., Kiril Mischeff Ltd., LIOGAM Forys Kot Przeslak sp. j., Lion Raisins, National Raisin Co., Ocean Spray Cranberries Inc., Paradise Fruits Solutions GmbH and Co. KG, Royal Nut Co., Sun Maid Growers of California, Sunbeam Foods, Sunsweet Growers Inc., Traina Dried Fruit Inc., and Woodland Foods Ltd.

Market dynamics

Parent market analysis, market growth inducers and obstacles, market forecast, fast-growing and slow-growing segment analysis, COVID-19 impact and recovery analysis and future consumer dynamics, market condition analysis for the forecast period

Customization purview

If our market report has not included the data that you are looking for, you can reach out to our analysts and get segments customized.

Request Free Sample

What are the Key Data Covered in this Market Research and Growth Report?

  • CAGR of the market during the forecast period
  • Detailed information on factors that will drive the market growth and forecasting between 2024 and 2028
  • Precise estimation of the size of the market  and its contribution of the market in focus to the parent market
  • Accurate predictions about upcoming market growth and trends and changes in consumer behaviour
  • Growth of the market across Europe, North America, APAC, Middle East and Africa, and South America
  • Thorough analysis of the market's competitive landscape and detailed information about companies
  • Comprehensive analysis of factors that will challenge the growth of market companies

We can help! Our analysts can customize this market research report to meet your requirements. Get in touch

1 Executive Summary

  • 1.1 Market overview
    • Executive Summary - Chart on Market Overview
    • Executive Summary - Data Table on Market Overview
    • Executive Summary - Chart on Global Market Characteristics
    • Executive Summary - Chart on Market by Geography
    • Executive Summary - Chart on Market Segmentation by Product
    • Executive Summary - Chart on Market Segmentation by Distribution Channel
    • Executive Summary - Chart on Incremental Growth
    • Executive Summary - Data Table on Incremental Growth
    • Executive Summary - Chart on Company Market Positioning

2 Market Landscape

  • 2.1 Market ecosystem
    • Parent Market
    • Data Table on - Parent Market
  • 2.2 Market characteristics
    • Market characteristics analysis
  • 2.3 Value chain analysis
    • Value Chain Analysis

3 Market Sizing

  • 3.1 Market definition
    • Offerings of companies included in the market definition
  • 3.2 Market segment analysis
    • Market segments
  • 3.3 Market size 2023
    • 3.4 Market outlook: Forecast for 2023-2028
      • Chart on Global - Market size and forecast 2023-2028 ($ million)
      • Data Table on Global - Market size and forecast 2023-2028 ($ million)
      • Chart on Global Market: Year-over-year growth 2023-2028 (%)
      • Data Table on Global Market: Year-over-year growth 2023-2028 (%)

    4 Historic Market Size

    • 4.1 Global Dried Fruits Market 2018 - 2022
      • Historic Market Size - Data Table on Global Dried Fruits Market 2018 - 2022 ($ million)
    • 4.2 Product segment analysis 2018 - 2022
      • Historic Market Size - Product Segment 2018 - 2022 ($ million)
    • 4.3 Distribution Channel segment analysis 2018 - 2022
      • Historic Market Size - Distribution Channel Segment 2018 - 2022 ($ million)
    • 4.4 Geography segment analysis 2018 - 2022
      • Historic Market Size - Geography Segment 2018 - 2022 ($ million)
    • 4.5 Country segment analysis 2018 - 2022
      • Historic Market Size - Country Segment 2018 - 2022 ($ million)

    5 Five Forces Analysis

    • 5.1 Five forces summary
      • Five forces analysis - Comparison between 2023 and 2028
    • 5.2 Bargaining power of buyers
      • Bargaining power of buyers - Impact of key factors 2023 and 2028
    • 5.3 Bargaining power of suppliers
      • Bargaining power of suppliers - Impact of key factors in 2023 and 2028
    • 5.4 Threat of new entrants
      • Threat of new entrants - Impact of key factors in 2023 and 2028
    • 5.5 Threat of substitutes
      • Threat of substitutes - Impact of key factors in 2023 and 2028
    • 5.6 Threat of rivalry
      • Threat of rivalry - Impact of key factors in 2023 and 2028
    • 5.7 Market condition
      • Chart on Market condition - Five forces 2023 and 2028

    6 Market Segmentation by Product

    • 6.1 Market segments
      • Chart on Product - Market share 2023-2028 (%)
      • Data Table on Product - Market share 2023-2028 (%)
    • 6.2 Comparison by Product
      • Chart on Comparison by Product
      • Data Table on Comparison by Product
    • 6.3 Raisins - Market size and forecast 2023-2028
      • Chart on Raisins - Market size and forecast 2023-2028 ($ million)
      • Data Table on Raisins - Market size and forecast 2023-2028 ($ million)
      • Chart on Raisins - Year-over-year growth 2023-2028 (%)
      • Data Table on Raisins - Year-over-year growth 2023-2028 (%)
    • 6.4 Dates - Market size and forecast 2023-2028
      • Chart on Dates - Market size and forecast 2023-2028 ($ million)
      • Data Table on Dates - Market size and forecast 2023-2028 ($ million)
      • Chart on Dates - Year-over-year growth 2023-2028 (%)
      • Data Table on Dates - Year-over-year growth 2023-2028 (%)
    • 6.5 Apricots - Market size and forecast 2023-2028
      • Chart on Apricots - Market size and forecast 2023-2028 ($ million)
      • Data Table on Apricots - Market size and forecast 2023-2028 ($ million)
      • Chart on Apricots - Year-over-year growth 2023-2028 (%)
      • Data Table on Apricots - Year-over-year growth 2023-2028 (%)
    • 6.6 Figs - Market size and forecast 2023-2028
      • Chart on Figs - Market size and forecast 2023-2028 ($ million)
      • Data Table on Figs - Market size and forecast 2023-2028 ($ million)
      • Chart on Figs - Year-over-year growth 2023-2028 (%)
      • Data Table on Figs - Year-over-year growth 2023-2028 (%)
    • 6.7 Others - Market size and forecast 2023-2028
      • Chart on Others - Market size and forecast 2023-2028 ($ million)
      • Data Table on Others - Market size and forecast 2023-2028 ($ million)
      • Chart on Others - Year-over-year growth 2023-2028 (%)
      • Data Table on Others - Year-over-year growth 2023-2028 (%)
    • 6.8 Market opportunity by Product
      • Market opportunity by Product ($ million)
      • Data Table on Market opportunity by Product ($ million)

    7 Market Segmentation by Distribution Channel

    • 7.1 Market segments
      • Chart on Distribution Channel - Market share 2023-2028 (%)
      • Data Table on Distribution Channel - Market share 2023-2028 (%)
    • 7.2 Comparison by Distribution Channel
      • Chart on Comparison by Distribution Channel
      • Data Table on Comparison by Distribution Channel
    • 7.3 Supermarkets and hypermarkets - Market size and forecast 2023-2028
      • Chart on Supermarkets and hypermarkets - Market size and forecast 2023-2028 ($ million)
      • Data Table on Supermarkets and hypermarkets - Market size and forecast 2023-2028 ($ million)
      • Chart on Supermarkets and hypermarkets - Year-over-year growth 2023-2028 (%)
      • Data Table on Supermarkets and hypermarkets - Year-over-year growth 2023-2028 (%)
    • 7.4 Convenience stores - Market size and forecast 2023-2028
      • Chart on Convenience stores - Market size and forecast 2023-2028 ($ million)
      • Data Table on Convenience stores - Market size and forecast 2023-2028 ($ million)
      • Chart on Convenience stores - Year-over-year growth 2023-2028 (%)
      • Data Table on Convenience stores - Year-over-year growth 2023-2028 (%)
    • 7.5 Online - Market size and forecast 2023-2028
      • Chart on Online - Market size and forecast 2023-2028 ($ million)
      • Data Table on Online - Market size and forecast 2023-2028 ($ million)
      • Chart on Online - Year-over-year growth 2023-2028 (%)
      • Data Table on Online - Year-over-year growth 2023-2028 (%)
    • 7.6 Market opportunity by Distribution Channel
      • Market opportunity by Distribution Channel ($ million)
      • Data Table on Market opportunity by Distribution Channel ($ million)

    8 Customer Landscape

    • 8.1 Customer landscape overview
      • Analysis of price sensitivity, lifecycle, customer purchase basket, adoption rates, and purchase criteria

    9 Geographic Landscape

    • 9.1 Geographic segmentation
      • Chart on Market share by geography 2023-2028 (%)
      • Data Table on Market share by geography 2023-2028 (%)
    • 9.2 Geographic comparison
      • Chart on Geographic comparison
      • Data Table on Geographic comparison
    • 9.3 Europe - Market size and forecast 2023-2028
      • Chart on Europe - Market size and forecast 2023-2028 ($ million)
      • Data Table on Europe - Market size and forecast 2023-2028 ($ million)
      • Chart on Europe - Year-over-year growth 2023-2028 (%)
      • Data Table on Europe - Year-over-year growth 2023-2028 (%)
    • 9.4 North America - Market size and forecast 2023-2028
      • Chart on North America - Market size and forecast 2023-2028 ($ million)
      • Data Table on North America - Market size and forecast 2023-2028 ($ million)
      • Chart on North America - Year-over-year growth 2023-2028 (%)
      • Data Table on North America - Year-over-year growth 2023-2028 (%)
    • 9.5 APAC - Market size and forecast 2023-2028
      • Chart on APAC - Market size and forecast 2023-2028 ($ million)
      • Data Table on APAC - Market size and forecast 2023-2028 ($ million)
      • Chart on APAC - Year-over-year growth 2023-2028 (%)
      • Data Table on APAC - Year-over-year growth 2023-2028 (%)
    • 9.6 Middle East and Africa - Market size and forecast 2023-2028
      • Chart on Middle East and Africa - Market size and forecast 2023-2028 ($ million)
      • Data Table on Middle East and Africa - Market size and forecast 2023-2028 ($ million)
      • Chart on Middle East and Africa - Year-over-year growth 2023-2028 (%)
      • Data Table on Middle East and Africa - Year-over-year growth 2023-2028 (%)
    • 9.7 South America - Market size and forecast 2023-2028
      • Chart on South America - Market size and forecast 2023-2028 ($ million)
      • Data Table on South America - Market size and forecast 2023-2028 ($ million)
      • Chart on South America - Year-over-year growth 2023-2028 (%)
      • Data Table on South America - Year-over-year growth 2023-2028 (%)
    • 9.8 US - Market size and forecast 2023-2028
      • Chart on US - Market size and forecast 2023-2028 ($ million)
      • Data Table on US - Market size and forecast 2023-2028 ($ million)
      • Chart on US - Year-over-year growth 2023-2028 (%)
      • Data Table on US - Year-over-year growth 2023-2028 (%)
    • 9.9 China - Market size and forecast 2023-2028
      • Chart on China - Market size and forecast 2023-2028 ($ million)
      • Data Table on China - Market size and forecast 2023-2028 ($ million)
      • Chart on China - Year-over-year growth 2023-2028 (%)
      • Data Table on China - Year-over-year growth 2023-2028 (%)
    • 9.10 UK - Market size and forecast 2023-2028
      • Chart on UK - Market size and forecast 2023-2028 ($ million)
      • Data Table on UK - Market size and forecast 2023-2028 ($ million)
      • Chart on UK - Year-over-year growth 2023-2028 (%)
      • Data Table on UK - Year-over-year growth 2023-2028 (%)
    • 9.11 Germany - Market size and forecast 2023-2028
      • Chart on Germany - Market size and forecast 2023-2028 ($ million)
      • Data Table on Germany - Market size and forecast 2023-2028 ($ million)
      • Chart on Germany - Year-over-year growth 2023-2028 (%)
      • Data Table on Germany - Year-over-year growth 2023-2028 (%)
    • 9.12 India - Market size and forecast 2023-2028
      • Chart on India - Market size and forecast 2023-2028 ($ million)
      • Data Table on India - Market size and forecast 2023-2028 ($ million)
      • Chart on India - Year-over-year growth 2023-2028 (%)
      • Data Table on India - Year-over-year growth 2023-2028 (%)
    • 9.13 Market opportunity by geography
      • Market opportunity by geography ($ million)
      • Data Tables on Market opportunity by geography ($ million)

    10 Drivers, Challenges, and Opportunity/Restraints

    • 10.1 Market drivers
      • 10.2 Market challenges
        • 10.3 Impact of drivers and challenges
          • Impact of drivers and challenges in 2023 and 2028
        • 10.4 Market opportunities/restraints

          11 Competitive Landscape

          • 11.1 Overview
            • 11.2 Competitive Landscape
              • Overview on criticality of inputs and factors of differentiation
            • 11.3 Landscape disruption
              • Overview on factors of disruption
            • 11.4 Industry risks
              • Impact of key risks on business

            12 Competitive Analysis

            • 12.1 Companies profiled
              • Companies covered
            • 12.2 Market positioning of companies
              • Matrix on companies position and classification
            • 12.3 Agthia Group PJSC
              • Agthia Group PJSC - Overview
              • Agthia Group PJSC - Business segments
              • Agthia Group PJSC - Key offerings
              • Agthia Group PJSC - Segment focus
            • 12.4 Angas Park
              • Angas Park - Overview
              • Angas Park - Product / Service
              • Angas Park - Key offerings
            • 12.5 Bergin Fruit and Nut Co. Inc.
              • Bergin Fruit and Nut Co. Inc. - Overview
              • Bergin Fruit and Nut Co. Inc. - Product / Service
              • Bergin Fruit and Nut Co. Inc. - Key offerings
            • 12.6 Geobres S.A.
              • Geobres S.A. - Overview
              • Geobres S.A. - Product / Service
              • Geobres S.A. - Key offerings
            • 12.7 KBB NUTS PVT. LTD.
              • KBB NUTS PVT. LTD. - Overview
              • KBB NUTS PVT. LTD. - Product / Service
              • KBB NUTS PVT. LTD. - Key offerings
            • 12.8 Kiril Mischeff Ltd.
              • Kiril Mischeff Ltd. - Overview
              • Kiril Mischeff Ltd. - Product / Service
              • Kiril Mischeff Ltd. - Key offerings
            • 12.9 Lion Raisins
              • Lion Raisins - Overview
              • Lion Raisins - Product / Service
              • Lion Raisins - Key offerings
            • 12.10 National Raisin Co.
              • National Raisin Co. - Overview
              • National Raisin Co. - Product / Service
              • National Raisin Co. - Key offerings
            • 12.11 Ocean Spray Cranberries Inc.
              • Ocean Spray Cranberries Inc. - Overview
              • Ocean Spray Cranberries Inc. - Product / Service
              • Ocean Spray Cranberries Inc. - Key news
              • Ocean Spray Cranberries Inc. - Key offerings
            • 12.12 Royal Nut Co.
              • Royal Nut Co. - Overview
              • Royal Nut Co. - Product / Service
              • Royal Nut Co. - Key offerings
            • 12.13 Sun Maid Growers of California
              • Sun Maid Growers of California - Overview
              • Sun Maid Growers of California - Product / Service
              • Sun Maid Growers of California - Key offerings
            • 12.14 Sunbeam Foods
              • Sunbeam Foods - Overview
              • Sunbeam Foods - Product / Service
              • Sunbeam Foods - Key offerings
            • 12.15 Sunsweet Growers Inc.
              • Sunsweet Growers Inc. - Overview
              • Sunsweet Growers Inc. - Product / Service
              • Sunsweet Growers Inc. - Key offerings
            • 12.16 Traina Dried Fruit Inc.
              • Traina Dried Fruit Inc. - Overview
              • Traina Dried Fruit Inc. - Product / Service
              • Traina Dried Fruit Inc. - Key offerings
            • 12.17 Woodland Foods Ltd.
              • Woodland Foods Ltd. - Overview
              • Woodland Foods Ltd. - Product / Service
              • Woodland Foods Ltd. - Key offerings

            13 Appendix

            • 13.1 Scope of the report
              • 13.2 Inclusions and exclusions checklist
                • Inclusions checklist
                • Exclusions checklist
              • 13.3 Currency conversion rates for US$
                • Currency conversion rates for US$
              • 13.4 Research methodology
                • Research methodology
              • 13.5 Data procurement
                • Information sources
              • 13.6 Data validation
                • Data validation
              • 13.7 Validation techniques employed for market sizing
                • Validation techniques employed for market sizing
              • 13.8 Data synthesis
                • Data synthesis
              • 13.9 360 degree market analysis
                • 360 degree market analysis
              • 13.10 List of abbreviations
                • List of abbreviations

              Research Methodology

              Technavio presents a detailed picture of the market by way of study, synthesis, and summation of data from multiple sources. The analysts have presented the various facets of the market with a particular focus on identifying the key industry influencers. The data thus presented is comprehensive, reliable, and the result of extensive research, both primary and secondary.

              INFORMATION SOURCES

              Primary sources

              • Manufacturers and suppliers
              • Channel partners
              • Industry experts
              • Strategic decision makers

              Secondary sources

              • Industry journals and periodicals
              • Government data
              • Financial reports of key industry players
              • Historical data
              • Press releases

              DATA ANALYSIS

              Data Synthesis

              • Collation of data
              • Estimation of key figures
              • Analysis of derived insights

              Data Validation

              • Triangulation with data models
              • Reference against proprietary databases
              • Corroboration with industry experts

              REPORT WRITING

              Qualitative

              • Market drivers
              • Market challenges
              • Market trends
              • Five forces analysis

              Quantitative

              • Market size and forecast
              • Market segmentation
              • Geographical insights
              • Competitive landscape

              Interested in this report?

              Get your sample now to see our research methodology and insights!

              Download Now

              Frequently Asked Questions

              Dried Fruits market growth will increase by $ 1602.1 mn during 2024-2028.

              The Dried Fruits market is expected to grow at a CAGR of 4.36% during 2024-2028.

              Dried Fruits market is segmented by Product( Raisins, Dates, Apricots, Figs, Others) Distribution Channel( Supermarkets and hypermarkets, Convenience stores, Online)

              Absolute Organic, Agthia Group PJSC, Angas Park, Bergin Fruit and Nut Co. Inc., Ceres Enterprises Ltd., Dohler GmbH, Geobres S.A., KBB NUTS PVT. LTD., Kiril Mischeff Ltd., LIOGAM Forys Kot Przeslak sp. j., Lion Raisins, National Raisin Co., Ocean Spray Cranberries Inc., Paradise Fruits Solutions GmbH and Co. KG, Royal Nut Co., Sun Maid Growers of California, Sunbeam Foods, Sunsweet Growers Inc., Traina Dried Fruit Inc., Woodland Foods Ltd. are a few of the key vendors in the Dried Fruits market.

              APAC will register the highest growth rate of 41% among the other regions. Therefore, the Dried Fruits market in APAC is expected to garner significant business opportunities for the vendors during the forecast period.

              US, China, UK, Germany, India

              • Growing prominence of e-commerceOnline distribution channels is the driving factor this market.
              • also referred to as e-commerce is the driving factor this market.
              • have significantly fueled the growth of the global dried fruits market for the last decade. E-commerce enables customers to access regional and global brands of dried fruits. Also is the driving factor this market.
              • a significant increase in the number of e-commerce vendors globally is fueled by increased smartphone penetration. Various types of e-commerce platforms offering dried fruits include brand-owned online platforms and pure-play e-retailers. Amazon.com (Amazon) is the driving factor this market.
              • Alibaba Inc. (Alibaba) is the driving factor this market.
              • and eBay Inc. (eBay) are some of the major online retailers of dried fruits globally. Personalized shopping assistance and suggestions on dried fruits are some of the primary benefits of online shopping. Also is the driving factor this market.
              • e-commerce vendors such as Amazon allow customers to collect information and compare various dried fruits available online is the driving factor this market.
              • which helps customers to choose the best options based on their requirements. Also is the driving factor this market.
              • online platforms provide an opportunity for vendors to expand their market reach in different regions that they cannot reach physically. Owing to these benefits is the driving factor this market.
              • certain vendors of dried fruits started using online channels to sell their products and inform potential consumers about their products. Therefore is the driving factor this market.
              • the increasing inclination of consumers toward online retailing is the driving factor this market.
              • complimented by the rising Internet penetration in various regions is the driving factor this market.
              • is expected to drive the growth of the market during the forecast period. is the driving factor this market.

              The Dried Fruits market vendors should focus on grabbing business opportunities from the Raisins segment as it accounted for the largest market share in the base year.
              RIA - Research AI Assistant
              Ask RIA