Dust Suppression Systems Market Analysis, Size, and Forecast 2026-2030: APAC (China, Japan, and India), North America (US, Canada, and Mexico), Europe (Germany, UK, and France), Middle East and Africa (South Africa, Saudi Arabia, and UAE), South America (Brazil and Argentina), and Rest of World (ROW)

Dust Suppression Systems Market Analysis, Size, and Forecast 2026-2030:
APAC (China, Japan, and India), North America (US, Canada, and Mexico), Europe (Germany, UK, and France), Middle East and Africa (South Africa, Saudi Arabia, and UAE), South America (Brazil and Argentina), and Rest of World (ROW)

Published: Dec 2025 291 Pages SKU: IRTNTR45909

Market Overview at a Glance

$5.41 B
Market Opportunity
5.7%
CAGR 2025 - 2030
38.7%
APAC Growth
$13.99 B
Wet systems segment 2024

Dust Suppression Systems Market Size 2026-2030

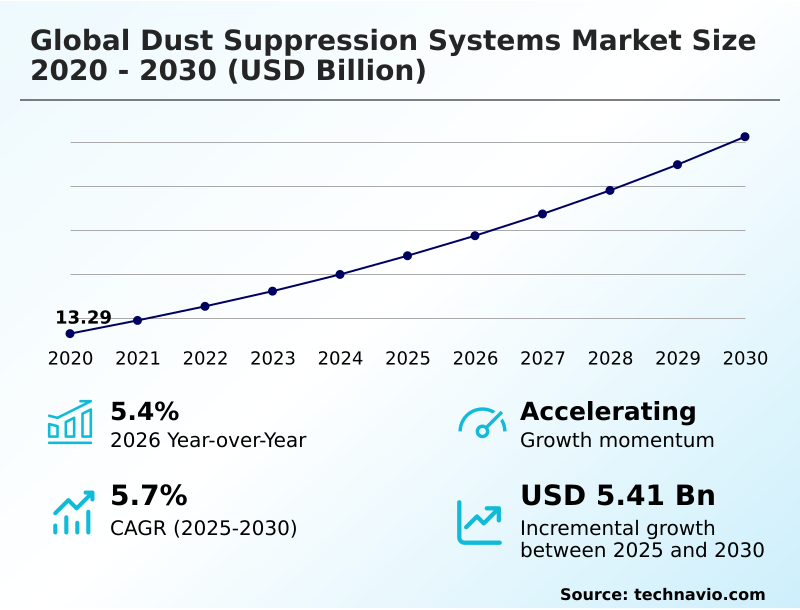
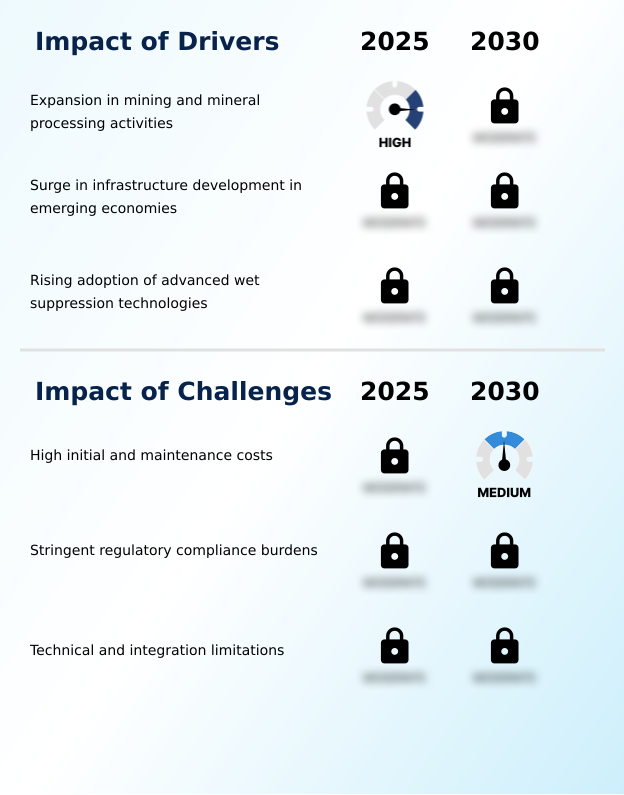
The dust suppression systems market size is valued to increase by USD 5.41 billion, at a CAGR of 5.7% from 2025 to 2030. Expansion in mining and mineral processing activities will drive the dust suppression systems market.

Major Market Trends & Insights

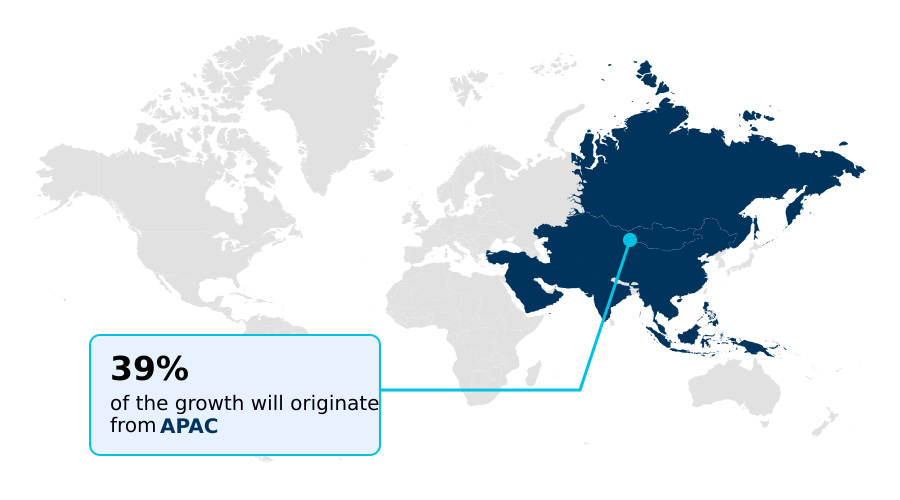
  • APAC dominated the market and accounted for a 38.7% growth during the forecast period.
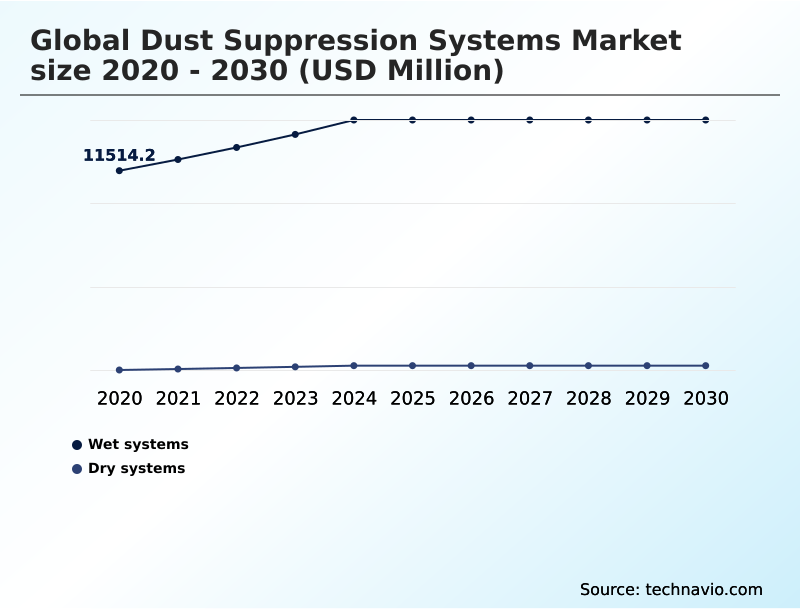
  • By Product - Wet systems segment was valued at USD 13.99 billion in 2024
  • By End-user - Construction segment accounted for the largest market revenue share in 2024

Market Size & Forecast

  • Market Opportunities: USD 8.94 billion
  • Market Future Opportunities: USD 5.41 billion
  • CAGR from 2025 to 2030 : 5.7%

Market Summary

  • The dust suppression systems market is shaped by stringent regulations and the industrial necessity to control airborne particulates. A primary driver is the expansion of mining and construction, where controlling respirable crystalline silica is critical for meeting occupational health standards.
  • Concurrently, a significant trend involves the integration of automation and IoT for proactive dust management, enabling operators to optimize resource use. For instance, a mining operator can leverage real-time air quality data to automate misting systems, ensuring environmental compliance while minimizing water consumption, a key operational efficiency metric.
  • However, the high capital and maintenance costs associated with advanced technologies like electrostatic precipitators and high-efficiency dust collectors present a substantial challenge, particularly for smaller enterprises. This financial barrier is compounded by the technical complexities of integrating new systems with legacy infrastructure.
  • The industry is responding with modular designs and sustainable dust control methods, balancing performance with affordability to support wider adoption.

What will be the Size of the Dust Suppression Systems Market during the forecast period?

Get Key Insights on Market Forecast (PDF) Request Free Sample

How is the Dust Suppression Systems Market Segmented?

The dust suppression systems industry research report provides comprehensive data (region-wise segment analysis), with forecasts and estimates in "USD million" for the period 2026-2030, as well as historical data from 2020-2024 for the following segments.

  • Product
    • Wet systems
    • Dry systems
  • End-user
    • Construction
    • Mining
    • Energy
    • Chemical
    • Others
  • Mobility type
    • Stationary
    • Portable
  • Geography
    • APAC
      • China
      • Japan
      • India
    • North America
      • US
      • Canada
      • Mexico
    • Europe
      • Germany
      • UK
      • France
    • Middle East and Africa
      • South Africa
      • Saudi Arabia
      • UAE
    • South America
      • Brazil
      • Argentina
    • Rest of World (ROW)

By Product Insights

The wet systems segment is estimated to witness significant growth during the forecast period.

Wet systems represent a significant portion of the market, utilizing technologies from high-pressure water misting to foam based dust control to manage airborne particulates. These solutions are vital in industries where cost-effective dust abatement is a priority.

Modern wet suppression systems incorporate advanced atomizing nozzles and non-ionic surfactants to improve particle agglomeration. The focus on water consumption optimization has led to the development of systems that offer precise hydroscopic dust suppression, reducing waste.

A site-specific dust assessment guides the deployment of automated suppression technology, which supports proactive dust management and can reduce labor requirements by up to 40%.

Innovations in low-moisture dust control, such as advanced fogging units, are further enhancing efficiency across various industrial applications.

Request Free Sample

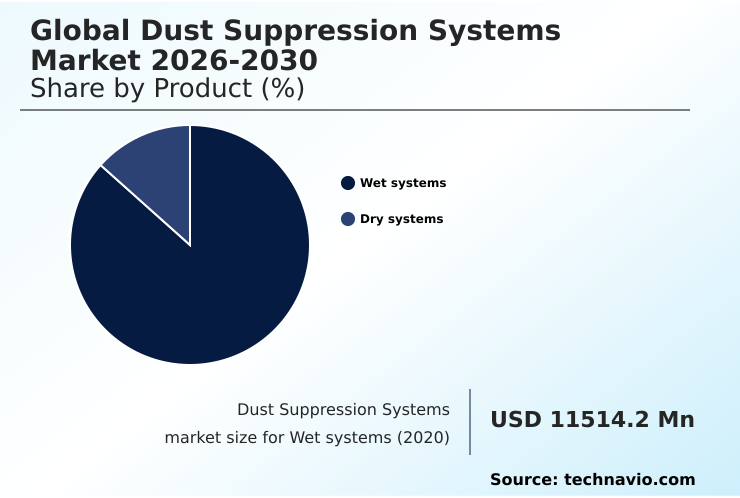
The Wet systems segment was valued at USD 13.99 billion in 2024 and showed a gradual increase during the forecast period.

Request Free Sample

Regional Analysis

APAC is estimated to contribute 38.7% to the growth of the global market during the forecast period.Technavio’s analysts have elaborately explained the regional trends and drivers that shape the market during the forecast period.

See How Dust Suppression Systems Market Demand is Rising in APAC Request Free Sample

The geographic landscape is defined by varied industrial needs and regulatory pressures, with the APAC region accounting for 38.7% of market activity, driven by infrastructure growth.

North America follows, with a strong focus on environmental compliance monitoring and implementing advanced industrial air filtration solutions. In Europe, stringent air quality management goals push the adoption of source-capture systems to prevent cross-contamination in manufacturing.

Key applications globally include stockpile dust prevention and managing emissions from conveyor transfer point solutions. Industries like quarry dust extraction and those with bulk material handling emissions are investing heavily in technologies such as electrostatic precipitators.

Combustible dust mitigation and integrated explosion isolation devices are critical in specialized sectors, reflecting a global push to control airborne particulate matter and enhance workplace safety.

Market Dynamics

Our researchers analyzed the data with 2025 as the base year, along with the key drivers, trends, and challenges. A holistic analysis of drivers will help companies refine their marketing strategies to gain a competitive advantage.

  • Strategic decisions in the global dust suppression systems market 2026-2030 are increasingly complex, weighing wet versus dry dust suppression cost against operational needs. For large-scale operations, automated dust suppression for mining is becoming standard to ensure compliance with osha silica dust rule.
  • When evaluating dust control solutions for construction sites, project managers analyze the roi of iot-enabled dust monitoring, which can improve resource allocation significantly. A critical consideration for chemical dust suppressant safety data is its impact on both workers and the environment, leading to a rise in demand for biodegradable dust control chemicals.
  • Best practices for haul road dust control are evolving, with a focus on reducing water usage in dust control. For temporary needs, rental options for dust suppression equipment offer flexibility, especially for demolition projects. In fixed facilities, preventing combustible dust explosions is paramount, influencing system design in bulk material handling and at ports and terminals.
  • The applications for mobile dust suppression cannon are expanding beyond construction to agriculture and waste management. Proper maintenance of dust collection systems, especially filtration efficiency in baghouse collectors, is crucial for long-term performance.
  • Advanced techniques for managing dust from coal stockpiles and tailings dam dust stabilization methods are also gaining traction, alongside specialized high-pressure fogging system design to meet unique site challenges. Adopting these advanced systems can cut non-compliance incidents by more than half compared to traditional methods.

What are the key market drivers leading to the rise in the adoption of Dust Suppression Systems Industry?

  • The global expansion of mineral processing and mining activities serves as a significant driver for the market, increasing demand for effective dust control.

  • The market is primarily driven by the stringent enforcement of occupational health standards and the growing scale of industrial activities.
  • The critical need for particulate matter control, especially for fugitive dust emissions containing respirable crystalline silica, is compelling industries to invest in advanced solutions.
  • Compliance with workplace safety regulations and participation in silicosis prevention programs are no longer optional, making industrial hygiene solutions a core operational requirement.
  • In mining and construction, effective haul road dust management and crusher dust containment are essential for maintaining operational licenses.
  • This has fueled demand for high-performance chemical dust binders, surface-stabilization agents, and hygroscopic salts that provide durable dust agglomeration, directly contributing to safer work environments and community relations.

What are the market trends shaping the Dust Suppression Systems Industry?

  • A primary trend influencing the market is the definitive shift toward sustainable solutions. This movement prioritizes the adoption of biodegradable agents and water-efficient technologies.

  • Key market trends are centered on sustainability and automation, reshaping fugitive dust control practices. The adoption of sustainable dust control methods includes a shift toward biodegradable polymer emulsions and lignosulfonate binders. Mobile dust-control machines and automated misting systems are now integrated with real-time air quality data, enabling precise particulate emission reduction and significant operational gains.
  • This shift has resulted in up to 40% reductions in resource use compared to conventional methods. Innovations like dry fog dust suppression and permanent wind fence systems are gaining traction in water-scarce regions, offering effective control with minimal environmental impact.
  • The focus on automation also improves regulatory compliance reporting and leads to reduced equipment wear, extending asset lifecycles and lowering total ownership costs.

What challenges does the Dust Suppression Systems Industry face during its growth?

  • High initial capital investment and ongoing maintenance costs for advanced dust suppression technologies present a primary challenge to broader market adoption and growth.

  • Key challenges stem from the high costs and technical complexities of advanced systems. The initial investment for high-efficiency dust collectors, including baghouse collectors and cartridge filtration units, can be prohibitive for smaller operators. Integrating solutions like industrial scrubbers or a wet electrostatic precipitator into existing infrastructure often requires significant downtime and engineering expertise.
  • Furthermore, the performance of advanced filtration media in dry dust collectors is highly dependent on consistent maintenance, affecting overall operational efficiency metrics. In specialized applications like foundry air quality control or port and terminal dust control, standard cyclonic separation may be insufficient, necessitating customized systems.
  • These factors, combined with challenges in demolition dust safety and tailings dam dust control, create hurdles for widespread adoption.

Exclusive Technavio Analysis on Customer Landscape

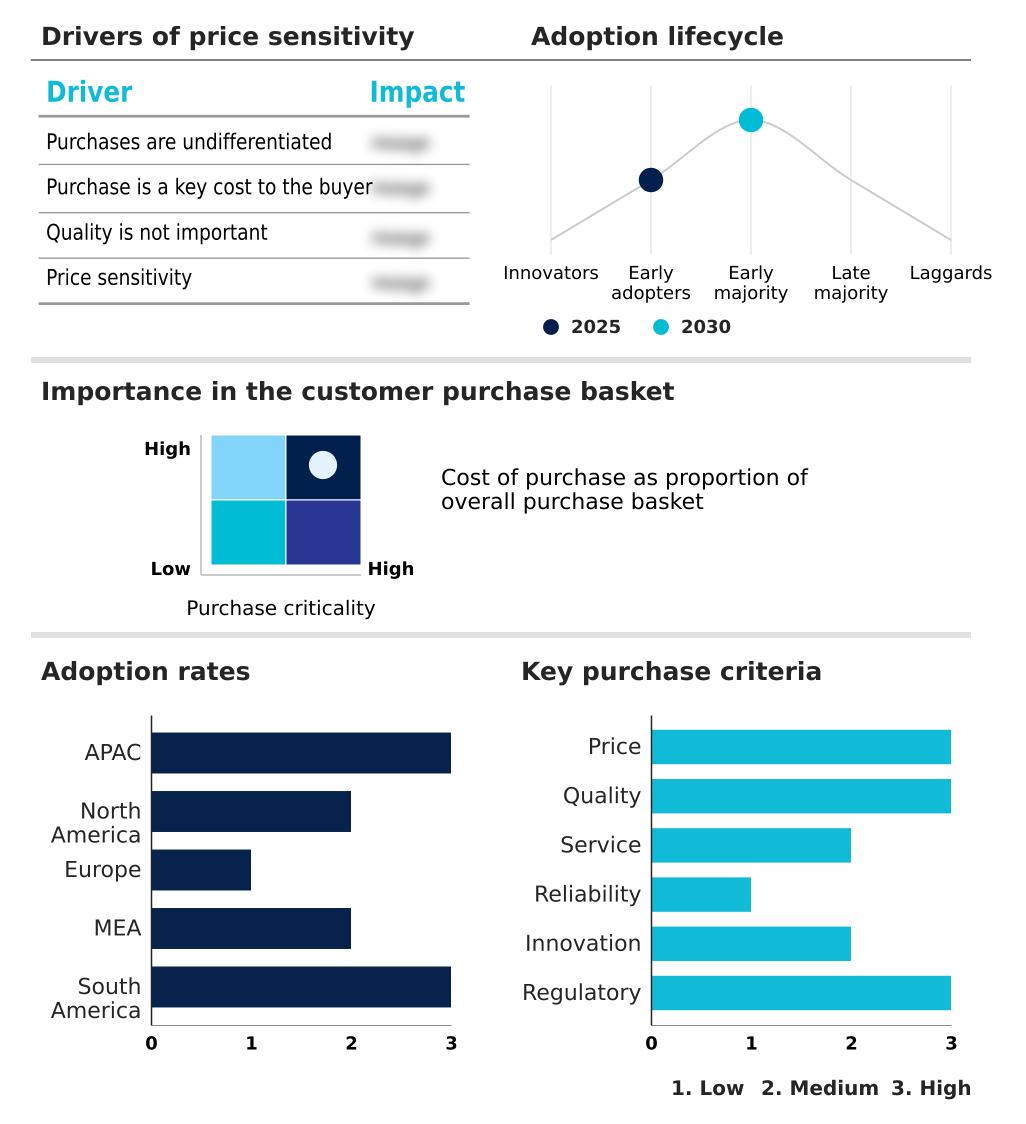
The dust suppression systems market forecasting report includes the adoption lifecycle of the market, covering from the innovator’s stage to the laggard’s stage. It focuses on adoption rates in different regions based on penetration. Furthermore, the dust suppression systems market report also includes key purchase criteria and drivers of price sensitivity to help companies evaluate and develop their market growth analysis strategies.

Customer Landscape of Dust Suppression Systems Industry

Competitive Landscape

Companies are implementing various strategies, such as strategic alliances, dust suppression systems market forecast, partnerships, mergers and acquisitions, geographical expansion, and product/service launches, to enhance their presence in the industry.

BASF SE - Provides chemical-based dust control, including specialized binders and surface-stabilization agents, for effective particulate matter management in industrial settings.

The industry research and growth report includes detailed analyses of the competitive landscape of the market and information about key companies, including:

  • BASF SE
  • Beltran Technologies Inc.
  • Camfil AB
  • Company Wrench Ltd.
  • Dantherm Group AS
  • Donaldson Co. Inc.
  • DSH Systems Ltd.
  • Dust Control Technologies Inc.
  • Duztech AB
  • EmiControls GmbH
  • Envirosystems Manufacturing
  • Global Road Technology Ltd.
  • IKEUCHI EUROPE B.V.
  • JKF Industri A/S
  • Nederman Holding AB
  • Parker Hannifin Corp.
  • Quaker Houghton
  • Savic Group
  • Sly Inc.
  • Spraying Systems Co.

Qualitative and quantitative analysis of companies has been conducted to help clients understand the wider business environment as well as the strengths and weaknesses of key industry players. Data is qualitatively analyzed to categorize companies as pure play, category-focused, industry-focused, and diversified; it is quantitatively analyzed to categorize companies as dominant, leading, strong, tentative, and weak.

Recent Development and News in Dust suppression systems market

  • In December, 2024, The European Union formally adopted the revised Ambient Air Quality Directive, establishing stricter limit values for particulate matter (PM2.5 and PM10) to align with World Health Organization guidelines, compelling industries to implement more robust dust abatement plans.
  • In March, 2025, Nederman Holding AB announced the acquisition of Euro-Equip S.L., a move intended to strengthen its presence in the foundry sector and enhance its capability to deliver complete industrial air filtration solutions in the Iberian Peninsula.
  • In May, 2025, Emerson announced it is empowering manufacturers with advanced industrial artificial intelligence (AI) and data solutions for mission-critical applications, including optimizing autonomous operations for improved environmental controls and safety.
  • In May, 2025, South Africa's Minister of Forestry, Fisheries and the Environment issued the draft National Dust Control Amendment Regulations, aimed at closing legislative gaps with more stringent monitoring and reporting requirements for mining and industrial operations.

Dive into Technavio’s robust research methodology, blending expert interviews, extensive data synthesis, and validated models for unparalleled Dust Suppression Systems Market insights. See full methodology.

Market Scope
Page number 291
Base year 2025
Historic period 2020-2024
Forecast period 2026-2030
Growth momentum & CAGR Accelerate at a CAGR of 5.7%
Market growth 2026-2030 USD 5409.8 million
Market structure Fragmented
YoY growth 2025-2026(%) 5.4%
Key countries China, Japan, India, South Korea, Australia, Indonesia, US, Canada, Mexico, Germany, UK, France, Italy, Spain, The Netherlands, South Africa, Saudi Arabia, UAE, Turkey, Israel, Brazil, Argentina and Chile
Competitive landscape Leading Companies, Market Positioning of Companies, Competitive Strategies, and Industry Risks

Request Free Sample

Research Analyst Overview

  • The global dust suppression systems market 2026-2030 is driven by the critical need for particulate matter control and fugitive dust control across heavy industries. Boardroom decisions are increasingly influenced by the need to comply with standards for respirable crystalline silica, mandating investments in effective technologies.
  • Solutions range from wet suppression systems, including high-pressure water misting and foam based dust control, to dry dust collectors like baghouse collectors and industrial scrubbers. Innovations in chemical dust binders, lignosulfonate binders, and surface-stabilization agents offer enhanced dust agglomeration. Advanced automated misting systems, fogging units, and mobile dust-control machines are being deployed for fugitive dust emissions management.
  • Technologies such as electrostatic precipitators, including wet electrostatic precipitator variants, and high-efficiency dust collectors with advanced cartridge filtration units are key. The use of hydroscopic dust suppression with non-ionic surfactants, hygroscopic salts, and polymer emulsions is rising. For high-risk areas, cyclonic separation, source-capture systems, and combustible dust mitigation strategies featuring explosion isolation devices and industrial air filtration are essential.
  • Sustainable options like dry fog dust suppression and wind fence systems are also gaining traction, with some operators reporting up to 40% reductions in resource use, proving their financial and environmental viability.

What are the Key Data Covered in this Dust Suppression Systems Market Research and Growth Report?

  • What is the expected growth of the Dust Suppression Systems Market between 2026 and 2030?

    • USD 5.41 billion, at a CAGR of 5.7%

  • What segmentation does the market report cover?

    • The report is segmented by Product (Wet systems, and Dry systems), End-user (Construction, Mining, Energy, Chemical, and Others), Mobility Type (Stationary, and Portable) and Geography (APAC, North America, Europe, Middle East and Africa, South America)

  • Which regions are analyzed in the report?

    • APAC, North America, Europe, Middle East and Africa and South America

  • What are the key growth drivers and market challenges?

    • Expansion in mining and mineral processing activities, High initial and maintenance costs

  • Who are the major players in the Dust Suppression Systems Market?

    • BASF SE, Beltran Technologies Inc., Camfil AB, Company Wrench Ltd., Dantherm Group AS, Donaldson Co. Inc., DSH Systems Ltd., Dust Control Technologies Inc., Duztech AB, EmiControls GmbH, Envirosystems Manufacturing, Global Road Technology Ltd., IKEUCHI EUROPE B.V., JKF Industri A/S, Nederman Holding AB, Parker Hannifin Corp., Quaker Houghton, Savic Group, Sly Inc. and Spraying Systems Co.

Market Research Insights

  • Market dynamics are increasingly shaped by a focus on comprehensive air quality management and stringent occupational health standards. Industries are implementing proactive dust management strategies that deliver a measurable return on investment, with automated suppression technology reducing resource use by over 35% in some applications. The demand for sustainable dust control methods is driving innovation in cost-effective dust abatement solutions.
  • Enhanced operational efficiency metrics are achieved through systems that support real-time air quality data monitoring, with some operators seeing a 15% improvement in compliance reporting accuracy. The adoption of advanced filtration media and solutions designed for low-moisture dust control underscores the industry's commitment to both environmental stewardship and operational excellence.

We can help! Our analysts can customize this dust suppression systems market research report to meet your requirements.

Get in touch

1. Executive Summary

1.1 Market overview

Executive Summary - Chart on Market Overview
Executive Summary - Data Table on Market Overview
Executive Summary - Chart on Global Market Characteristics
Executive Summary - Chart on Market by Geography
Executive Summary - Chart on Market Segmentation by Product
Executive Summary - Chart on Market Segmentation by End-user
Executive Summary - Chart on Market Segmentation by Mobility Type
Executive Summary - Chart on Incremental Growth
Executive Summary - Data Table on Incremental Growth
Executive Summary - Chart on Company Market Positioning

2. Technavio Analysis

2.1 Analysis of price sensitivity, lifecycle, customer purchase basket, adoption rates, and purchase criteria

2.2 Criticality of inputs and Factors of differentiation

Chart on Overview on criticality of inputs and factors of differentiation

2.3 Factors of disruption

Chart on Overview on factors of disruption

2.4 Impact of drivers and challenges

Chart on Impact of drivers and challenges in 2025 and 2030

3. Market Landscape

3.1 Market ecosystem

Chart on Parent Market
Data Table on - Parent Market

3.2 Market characteristics

Chart on Market characteristics analysis

3.3 Value chain analysis

Chart on Value chain analysis

4. Market Sizing

4.1 Market definition

Data Table on Offerings of companies included in the market definition

4.2 Market segment analysis

Market segments

4.3 Market size 2025

4.4 Market outlook: Forecast for 2025-2030

Chart on Global - Market size and forecast 2025-2030 ($ million)
Data Table on Global - Market size and forecast 2025-2030 ($ million)
Chart on Global Market: Year-over-year growth 2025-2030 (%)
Data Table on Global Market: Year-over-year growth 2025-2030 (%)

5. Historic Market Size

5.1 Global Dust Suppression Systems Market 2020 - 2024

Historic Market Size - Data Table on Global Dust Suppression Systems Market 2020 - 2024 ($ million)

5.2 Product segment analysis 2020 - 2024

Historic Market Size - Product Segment 2020 - 2024 ($ million)

5.3 End-user segment analysis 2020 - 2024

Historic Market Size - End-user Segment 2020 - 2024 ($ million)

5.4 Mobility Type segment analysis 2020 - 2024

Historic Market Size - Mobility Type Segment 2020 - 2024 ($ million)

5.5 Geography segment analysis 2020 - 2024

Historic Market Size - Geography Segment 2020 - 2024 ($ million)

5.6 Country segment analysis 2020 - 2024

Historic Market Size - Country Segment 2020 - 2024 ($ million)

6. Qualitative Analysis

6.1 The AI impact on Global Dust Suppression Systems Market

7. Five Forces Analysis

7.1 Five forces summary

Five forces analysis - Comparison between 2025 and 2030

7.2 Bargaining power of buyers

Bargaining power of buyers - Impact of key factors 2025 and 2030

7.3 Bargaining power of suppliers

Bargaining power of suppliers - Impact of key factors in 2025 and 2030

7.4 Threat of new entrants

Threat of new entrants - Impact of key factors in 2025 and 2030

7.5 Threat of substitutes

Threat of substitutes - Impact of key factors in 2025 and 2030

7.6 Threat of rivalry

Threat of rivalry - Impact of key factors in 2025 and 2030

7.7 Market condition

Chart on Market condition - Five forces 2025 and 2030

8. Market Segmentation by Product

8.1 Market segments

Chart on Product - Market share 2025-2030 (%)
Data Table on Product - Market share 2025-2030 (%)

8.2 Comparison by Product

Chart on Comparison by Product
Data Table on Comparison by Product

8.3 Wet systems - Market size and forecast 2025-2030

Chart on Wet systems - Market size and forecast 2025-2030 ($ million)
Data Table on Wet systems - Market size and forecast 2025-2030 ($ million)
Chart on Wet systems - Year-over-year growth 2025-2030 (%)
Data Table on Wet systems - Year-over-year growth 2025-2030 (%)

8.4 Dry systems - Market size and forecast 2025-2030

Chart on Dry systems - Market size and forecast 2025-2030 ($ million)
Data Table on Dry systems - Market size and forecast 2025-2030 ($ million)
Chart on Dry systems - Year-over-year growth 2025-2030 (%)
Data Table on Dry systems - Year-over-year growth 2025-2030 (%)

8.5 Market opportunity by Product

Market opportunity by Product ($ million)
Data Table on Market opportunity by Product ($ million)

9. Market Segmentation by End-user

9.1 Market segments

Chart on End-user - Market share 2025-2030 (%)
Data Table on End-user - Market share 2025-2030 (%)

9.2 Comparison by End-user

Chart on Comparison by End-user
Data Table on Comparison by End-user

9.3 Construction - Market size and forecast 2025-2030

Chart on Construction - Market size and forecast 2025-2030 ($ million)
Data Table on Construction - Market size and forecast 2025-2030 ($ million)
Chart on Construction - Year-over-year growth 2025-2030 (%)
Data Table on Construction - Year-over-year growth 2025-2030 (%)

9.4 Mining - Market size and forecast 2025-2030

Chart on Mining - Market size and forecast 2025-2030 ($ million)
Data Table on Mining - Market size and forecast 2025-2030 ($ million)
Chart on Mining - Year-over-year growth 2025-2030 (%)
Data Table on Mining - Year-over-year growth 2025-2030 (%)

9.5 Energy - Market size and forecast 2025-2030

Chart on Energy - Market size and forecast 2025-2030 ($ million)
Data Table on Energy - Market size and forecast 2025-2030 ($ million)
Chart on Energy - Year-over-year growth 2025-2030 (%)
Data Table on Energy - Year-over-year growth 2025-2030 (%)

9.6 Chemical - Market size and forecast 2025-2030

Chart on Chemical - Market size and forecast 2025-2030 ($ million)
Data Table on Chemical - Market size and forecast 2025-2030 ($ million)
Chart on Chemical - Year-over-year growth 2025-2030 (%)
Data Table on Chemical - Year-over-year growth 2025-2030 (%)

9.7 Others - Market size and forecast 2025-2030

Chart on Others - Market size and forecast 2025-2030 ($ million)
Data Table on Others - Market size and forecast 2025-2030 ($ million)
Chart on Others - Year-over-year growth 2025-2030 (%)
Data Table on Others - Year-over-year growth 2025-2030 (%)

9.8 Market opportunity by End-user

Market opportunity by End-user ($ million)
Data Table on Market opportunity by End-user ($ million)

10. Market Segmentation by Mobility Type

10.1 Market segments

Chart on Mobility Type - Market share 2025-2030 (%)
Data Table on Mobility Type - Market share 2025-2030 (%)

10.2 Comparison by Mobility Type

Chart on Comparison by Mobility Type
Data Table on Comparison by Mobility Type

10.3 Stationary - Market size and forecast 2025-2030

Chart on Stationary - Market size and forecast 2025-2030 ($ million)
Data Table on Stationary - Market size and forecast 2025-2030 ($ million)
Chart on Stationary - Year-over-year growth 2025-2030 (%)
Data Table on Stationary - Year-over-year growth 2025-2030 (%)

10.4 Portable - Market size and forecast 2025-2030

Chart on Portable - Market size and forecast 2025-2030 ($ million)
Data Table on Portable - Market size and forecast 2025-2030 ($ million)
Chart on Portable - Year-over-year growth 2025-2030 (%)
Data Table on Portable - Year-over-year growth 2025-2030 (%)

10.5 Market opportunity by Mobility Type

Market opportunity by Mobility Type ($ million)
Data Table on Market opportunity by Mobility Type ($ million)

11. Customer Landscape

11.1 Customer landscape overview

Analysis of price sensitivity, lifecycle, customer purchase basket, adoption rates, and purchase criteria

12. Geographic Landscape

12.1 Geographic segmentation

Chart on Market share by geography 2025-2030 (%)
Data Table on Market share by geography 2025-2030 (%)

12.2 Geographic comparison

Chart on Geographic comparison
Data Table on Geographic comparison

12.3 APAC - Market size and forecast 2025-2030

Chart on APAC - Market size and forecast 2025-2030 ($ million)
Data Table on APAC - Market size and forecast 2025-2030 ($ million)
Chart on APAC - Year-over-year growth 2025-2030 (%)
Data Table on APAC - Year-over-year growth 2025-2030 (%)
Chart on Regional Comparison - APAC
Data Table on Regional Comparison - APAC

12.3.1 China - Market size and forecast 2025-2030

Chart on China - Market size and forecast 2025-2030 ($ million)
Data Table on China - Market size and forecast 2025-2030 ($ million)
Chart on China - Year-over-year growth 2025-2030 (%)
Data Table on China - Year-over-year growth 2025-2030 (%)

12.3.2 Japan - Market size and forecast 2025-2030

Chart on Japan - Market size and forecast 2025-2030 ($ million)
Data Table on Japan - Market size and forecast 2025-2030 ($ million)
Chart on Japan - Year-over-year growth 2025-2030 (%)
Data Table on Japan - Year-over-year growth 2025-2030 (%)

12.3.3 India - Market size and forecast 2025-2030

Chart on India - Market size and forecast 2025-2030 ($ million)
Data Table on India - Market size and forecast 2025-2030 ($ million)
Chart on India - Year-over-year growth 2025-2030 (%)
Data Table on India - Year-over-year growth 2025-2030 (%)

12.3.4 South Korea - Market size and forecast 2025-2030

Chart on South Korea - Market size and forecast 2025-2030 ($ million)
Data Table on South Korea - Market size and forecast 2025-2030 ($ million)
Chart on South Korea - Year-over-year growth 2025-2030 (%)
Data Table on South Korea - Year-over-year growth 2025-2030 (%)

12.3.5 Australia - Market size and forecast 2025-2030

Chart on Australia - Market size and forecast 2025-2030 ($ million)
Data Table on Australia - Market size and forecast 2025-2030 ($ million)
Chart on Australia - Year-over-year growth 2025-2030 (%)
Data Table on Australia - Year-over-year growth 2025-2030 (%)

12.3.6 Indonesia - Market size and forecast 2025-2030

Chart on Indonesia - Market size and forecast 2025-2030 ($ million)
Data Table on Indonesia - Market size and forecast 2025-2030 ($ million)
Chart on Indonesia - Year-over-year growth 2025-2030 (%)
Data Table on Indonesia - Year-over-year growth 2025-2030 (%)

12.4 North America - Market size and forecast 2025-2030

Chart on North America - Market size and forecast 2025-2030 ($ million)
Data Table on North America - Market size and forecast 2025-2030 ($ million)
Chart on North America - Year-over-year growth 2025-2030 (%)
Data Table on North America - Year-over-year growth 2025-2030 (%)
Chart on Regional Comparison - North America
Data Table on Regional Comparison - North America

12.4.1 US - Market size and forecast 2025-2030

Chart on US - Market size and forecast 2025-2030 ($ million)
Data Table on US - Market size and forecast 2025-2030 ($ million)
Chart on US - Year-over-year growth 2025-2030 (%)
Data Table on US - Year-over-year growth 2025-2030 (%)

12.4.2 Canada - Market size and forecast 2025-2030

Chart on Canada - Market size and forecast 2025-2030 ($ million)
Data Table on Canada - Market size and forecast 2025-2030 ($ million)
Chart on Canada - Year-over-year growth 2025-2030 (%)
Data Table on Canada - Year-over-year growth 2025-2030 (%)

12.4.3 Mexico - Market size and forecast 2025-2030

Chart on Mexico - Market size and forecast 2025-2030 ($ million)
Data Table on Mexico - Market size and forecast 2025-2030 ($ million)
Chart on Mexico - Year-over-year growth 2025-2030 (%)
Data Table on Mexico - Year-over-year growth 2025-2030 (%)

12.5 Europe - Market size and forecast 2025-2030

Chart on Europe - Market size and forecast 2025-2030 ($ million)
Data Table on Europe - Market size and forecast 2025-2030 ($ million)
Chart on Europe - Year-over-year growth 2025-2030 (%)
Data Table on Europe - Year-over-year growth 2025-2030 (%)
Chart on Regional Comparison - Europe
Data Table on Regional Comparison - Europe

12.5.1 Germany - Market size and forecast 2025-2030

Chart on Germany - Market size and forecast 2025-2030 ($ million)
Data Table on Germany - Market size and forecast 2025-2030 ($ million)
Chart on Germany - Year-over-year growth 2025-2030 (%)
Data Table on Germany - Year-over-year growth 2025-2030 (%)

12.5.2 UK - Market size and forecast 2025-2030

Chart on UK - Market size and forecast 2025-2030 ($ million)
Data Table on UK - Market size and forecast 2025-2030 ($ million)
Chart on UK - Year-over-year growth 2025-2030 (%)
Data Table on UK - Year-over-year growth 2025-2030 (%)

12.5.3 France - Market size and forecast 2025-2030

Chart on France - Market size and forecast 2025-2030 ($ million)
Data Table on France - Market size and forecast 2025-2030 ($ million)
Chart on France - Year-over-year growth 2025-2030 (%)
Data Table on France - Year-over-year growth 2025-2030 (%)

12.5.4 Italy - Market size and forecast 2025-2030

Chart on Italy - Market size and forecast 2025-2030 ($ million)
Data Table on Italy - Market size and forecast 2025-2030 ($ million)
Chart on Italy - Year-over-year growth 2025-2030 (%)
Data Table on Italy - Year-over-year growth 2025-2030 (%)

12.5.5 Spain - Market size and forecast 2025-2030

Chart on Spain - Market size and forecast 2025-2030 ($ million)
Data Table on Spain - Market size and forecast 2025-2030 ($ million)
Chart on Spain - Year-over-year growth 2025-2030 (%)
Data Table on Spain - Year-over-year growth 2025-2030 (%)

12.5.6 The Netherlands - Market size and forecast 2025-2030

Chart on The Netherlands - Market size and forecast 2025-2030 ($ million)
Data Table on The Netherlands - Market size and forecast 2025-2030 ($ million)
Chart on The Netherlands - Year-over-year growth 2025-2030 (%)
Data Table on The Netherlands - Year-over-year growth 2025-2030 (%)

12.6 Middle East and Africa - Market size and forecast 2025-2030

Chart on Middle East and Africa - Market size and forecast 2025-2030 ($ million)
Data Table on Middle East and Africa - Market size and forecast 2025-2030 ($ million)
Chart on Middle East and Africa - Year-over-year growth 2025-2030 (%)
Data Table on Middle East and Africa - Year-over-year growth 2025-2030 (%)
Chart on Regional Comparison - Middle East and Africa
Data Table on Regional Comparison - Middle East and Africa

12.6.1 South Africa - Market size and forecast 2025-2030

Chart on South Africa - Market size and forecast 2025-2030 ($ million)
Data Table on South Africa - Market size and forecast 2025-2030 ($ million)
Chart on South Africa - Year-over-year growth 2025-2030 (%)
Data Table on South Africa - Year-over-year growth 2025-2030 (%)

12.6.2 Saudi Arabia - Market size and forecast 2025-2030

Chart on Saudi Arabia - Market size and forecast 2025-2030 ($ million)
Data Table on Saudi Arabia - Market size and forecast 2025-2030 ($ million)
Chart on Saudi Arabia - Year-over-year growth 2025-2030 (%)
Data Table on Saudi Arabia - Year-over-year growth 2025-2030 (%)

12.6.3 UAE - Market size and forecast 2025-2030

Chart on UAE - Market size and forecast 2025-2030 ($ million)
Data Table on UAE - Market size and forecast 2025-2030 ($ million)
Chart on UAE - Year-over-year growth 2025-2030 (%)
Data Table on UAE - Year-over-year growth 2025-2030 (%)

12.6.4 Turkey - Market size and forecast 2025-2030

Chart on Turkey - Market size and forecast 2025-2030 ($ million)
Data Table on Turkey - Market size and forecast 2025-2030 ($ million)
Chart on Turkey - Year-over-year growth 2025-2030 (%)
Data Table on Turkey - Year-over-year growth 2025-2030 (%)

12.6.5 Israel - Market size and forecast 2025-2030

Chart on Israel - Market size and forecast 2025-2030 ($ million)
Data Table on Israel - Market size and forecast 2025-2030 ($ million)
Chart on Israel - Year-over-year growth 2025-2030 (%)
Data Table on Israel - Year-over-year growth 2025-2030 (%)

12.7 South America - Market size and forecast 2025-2030

Chart on South America - Market size and forecast 2025-2030 ($ million)
Data Table on South America - Market size and forecast 2025-2030 ($ million)
Chart on South America - Year-over-year growth 2025-2030 (%)
Data Table on South America - Year-over-year growth 2025-2030 (%)
Chart on Regional Comparison - South America
Data Table on Regional Comparison - South America

12.7.1 Brazil - Market size and forecast 2025-2030

Chart on Brazil - Market size and forecast 2025-2030 ($ million)
Data Table on Brazil - Market size and forecast 2025-2030 ($ million)
Chart on Brazil - Year-over-year growth 2025-2030 (%)
Data Table on Brazil - Year-over-year growth 2025-2030 (%)

12.7.2 Argentina - Market size and forecast 2025-2030

Chart on Argentina - Market size and forecast 2025-2030 ($ million)
Data Table on Argentina - Market size and forecast 2025-2030 ($ million)
Chart on Argentina - Year-over-year growth 2025-2030 (%)
Data Table on Argentina - Year-over-year growth 2025-2030 (%)

12.7.3 Chile - Market size and forecast 2025-2030

Chart on Chile - Market size and forecast 2025-2030 ($ million)
Data Table on Chile - Market size and forecast 2025-2030 ($ million)
Chart on Chile - Year-over-year growth 2025-2030 (%)
Data Table on Chile - Year-over-year growth 2025-2030 (%)

12.8 Market opportunity by geography

Market opportunity by geography ($ million)
Data Tables on Market opportunity by geography ($ million)

13. Drivers, Challenges, and Opportunity

13.1 Market drivers

Expansion in mining and mineral processing activities
Surge in infrastructure development in emerging economies
Rising adoption of advanced wet suppression technologies

13.2 Market challenges

High initial and maintenance costs
Stringent regulatory compliance burdens
Technical and integration limitations

13.3 Impact of drivers and challenges

Impact of drivers and challenges in 2025 and 2030

13.4 Market opportunities

Shift toward sustainable solutions
Growing remote monitoring and automation
Increasing focus on occupational health and safety

14. Competitive Landscape

14.1 Overview

14.2

Overview on criticality of inputs and factors of differentiation

14.3 Landscape disruption

Overview on factors of disruption

14.4 Industry risks

Impact of key risks on business

15. Competitive Analysis

15.1 Companies profiled

Companies covered

15.2 Company ranking index

15.3 Market positioning of companies

Matrix on companies position and classification

15.4 BASF SE

BASF SE - Overview
BASF SE - Business segments
BASF SE - Key news
BASF SE - Key offerings
BASF SE - Segment focus
SWOT

15.5 Beltran Technologies Inc.

Beltran Technologies Inc. - Overview
Beltran Technologies Inc. - Product / Service
Beltran Technologies Inc. - Key offerings
SWOT

15.6 Camfil AB

Camfil AB - Overview
Camfil AB - Product / Service
Camfil AB - Key offerings
SWOT

15.7 Company Wrench Ltd.

Company Wrench Ltd. - Overview
Company Wrench Ltd. - Product / Service
Company Wrench Ltd. - Key offerings
SWOT

15.8 Donaldson Co. Inc.

Donaldson Co. Inc. - Overview
Donaldson Co. Inc. - Business segments
Donaldson Co. Inc. - Key news
Donaldson Co. Inc. - Key offerings
Donaldson Co. Inc. - Segment focus
SWOT

15.9 DSH Systems Ltd.

DSH Systems Ltd. - Overview
DSH Systems Ltd. - Product / Service
DSH Systems Ltd. - Key offerings
SWOT

15.10 Dust Control Technologies Inc.

Dust Control Technologies Inc. - Overview
Dust Control Technologies Inc. - Product / Service
Dust Control Technologies Inc. - Key offerings
SWOT

15.11 Duztech AB

Duztech AB - Overview
Duztech AB - Product / Service
Duztech AB - Key offerings
SWOT

15.12 EmiControls GmbH

EmiControls GmbH - Overview
EmiControls GmbH - Product / Service
EmiControls GmbH - Key offerings
SWOT

15.13 Nederman Holding AB

Nederman Holding AB - Overview
Nederman Holding AB - Product / Service
Nederman Holding AB - Key offerings
SWOT

15.14 Parker Hannifin Corp.

Parker Hannifin Corp. - Overview
Parker Hannifin Corp. - Business segments
Parker Hannifin Corp. - Key offerings
Parker Hannifin Corp. - Segment focus
SWOT

15.15 Quaker Houghton

Quaker Houghton - Overview
Quaker Houghton - Business segments
Quaker Houghton - Key offerings
Quaker Houghton - Segment focus
SWOT

15.16 Savic Group

Savic Group - Overview
Savic Group - Product / Service
Savic Group - Key offerings
SWOT

15.17 Sly Inc.

Sly Inc. - Overview
Sly Inc. - Product / Service
Sly Inc. - Key offerings
SWOT

15.18 Spraying Systems Co.

Spraying Systems Co. - Overview
Spraying Systems Co. - Product / Service
Spraying Systems Co. - Key offerings
SWOT

16. Appendix

16.1 Scope of the report

Market definition
Objectives
Notes and caveats

16.2 Inclusions and exclusions checklist

Inclusions checklist
Exclusions checklist

16.3 Currency conversion rates for US$

16.4 Research methodology

16.5 Data procurement

Information sources

16.6 Data validation

16.7 Validation techniques employed for market sizing

16.8 Data synthesis

16.9 360 degree market analysis

16.10 List of abbreviations

Research Methodology

Technavio presents a detailed picture of the market by way of study, synthesis, and summation of data from multiple sources. The analysts have presented the various facets of the market with a particular focus on identifying the key industry influencers. The data thus presented is comprehensive, reliable, and the result of extensive research, both primary and secondary.

INFORMATION SOURCES

Primary sources

  • Manufacturers and suppliers
  • Channel partners
  • Industry experts
  • Strategic decision makers

Secondary sources

  • Industry journals and periodicals
  • Government data
  • Financial reports of key industry players
  • Historical data
  • Press releases

DATA ANALYSIS

Data Synthesis

  • Collation of data
  • Estimation of key figures
  • Analysis of derived insights

Data Validation

  • Triangulation with data models
  • Reference against proprietary databases
  • Corroboration with industry experts

REPORT WRITING

Qualitative

  • Market drivers
  • Market challenges
  • Market trends
  • Five forces analysis

Quantitative

  • Market size and forecast
  • Market segmentation
  • Geographical insights
  • Competitive landscape

Interested in this report?

Get your sample now to see our research methodology and insights!

Download Now

Frequently Asked Questions

Dust Suppression Systems market growth will increase by USD 5409.8 million during 2026-2030.

The Dust Suppression Systems market is expected to grow at a CAGR of 5.7% during 2026-2030.

Dust Suppression Systems market is segmented by Product (Wet systems, Dry systems) End-user (Construction, Mining, Energy, Chemical, Others) Mobility type (Stationary, Portable)

BASF SE, Beltran Technologies Inc., Camfil AB, Company Wrench Ltd., Dantherm Group AS, Donaldson Co. Inc., DSH Systems Ltd., Dust Control Technologies Inc., Duztech AB, EmiControls GmbH, Envirosystems Manufacturing, Global Road Technology Ltd., IKEUCHI EUROPE B.V., JKF Industri A/S, Nederman Holding AB, Parker Hannifin Corp., Quaker Houghton, Savic Group, Sly Inc., Spraying Systems Co. are a few of the key vendors in the Dust Suppression Systems market.

APAC will register the highest growth rate of 38.7% among the other regions. Therefore, the Dust Suppression Systems market in APAC is expected to garner significant business opportunities for the vendors during the forecast period.

China, Japan, India, South Korea, Australia, Indonesia, US, Canada, Mexico, Germany, UK, France, Italy, Spain, The Netherlands, South Africa, Saudi Arabia, UAE, Turkey, Israel, Brazil, Argentina, Chile

  • Expansion in mining and mineral processing activities is the driving factor this market.

The Dust Suppression Systems market vendors should focus on grabbing business opportunities from the Product segment as it accounted for the largest market share in the base year.