Energy Attribute Certificate (EAC) Trading Platforms Market Analysis, Size, and Forecast 2026-2030: North America (US, Canada, and Mexico), Europe (Germany, UK, and France), APAC (China, India, and Japan), Middle East and Africa (Saudi Arabia, UAE, and South Africa), South America (Brazil, Argentina, and Colombia), and Rest of World (ROW)

Energy Attribute Certificate (EAC) Trading Platforms Market Analysis, Size, and Forecast 2026-2030:
North America (US, Canada, and Mexico), Europe (Germany, UK, and France), APAC (China, India, and Japan), Middle East and Africa (Saudi Arabia, UAE, and South Africa), South America (Brazil, Argentina, and Colombia), and Rest of World (ROW)

Published: Mar 2026 287 Pages SKU: IRTNTR81314

Market Overview at a Glance

$3.62 B
Market Opportunity
22.6%
CAGR 2025 - 2030
31.5%
North America Growth
$823.7 Mn
Renewable energy certificates segment 2024

Energy Attribute Certificate (EAC) Trading Platforms Market Size 2026-2030

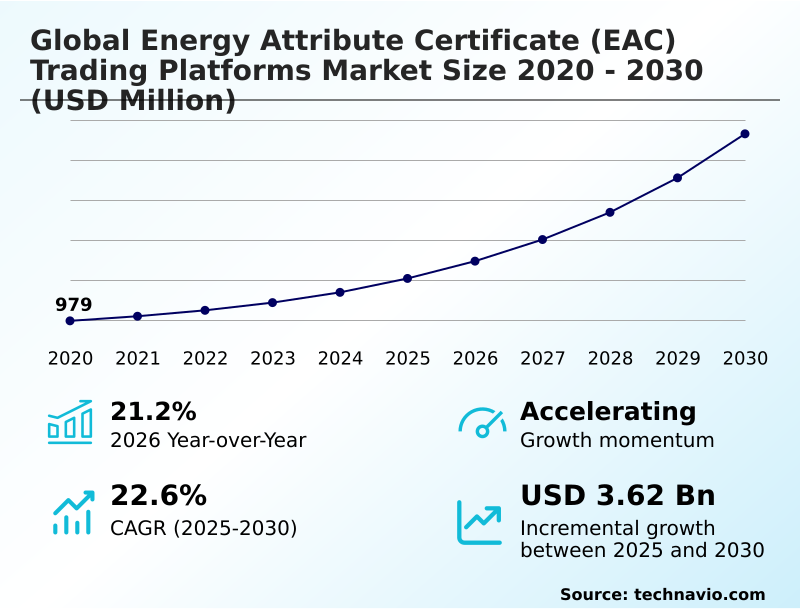
The energy attribute certificate (eac) trading platforms market size is valued to increase by USD 3.62 billion, at a CAGR of 22.6% from 2025 to 2030. Corporate sustainability commitments and proliferation of net-zero targets will drive the energy attribute certificate (eac) trading platforms market.

Major Market Trends & Insights

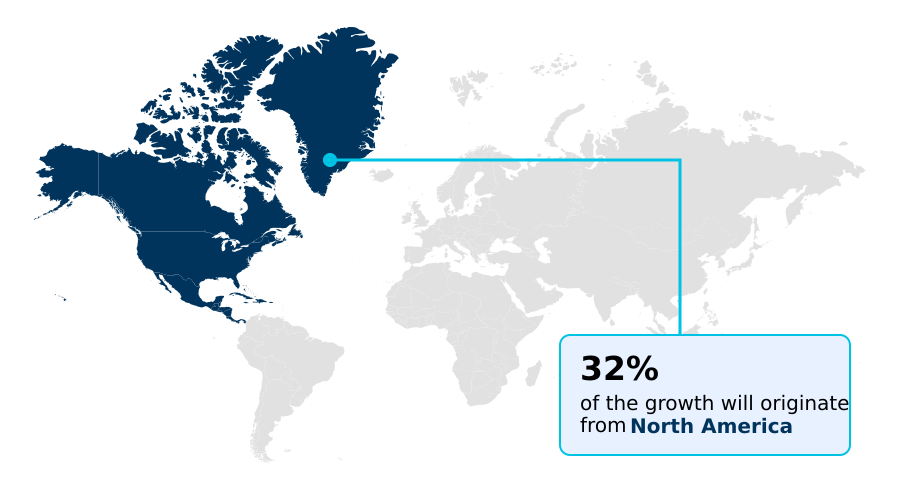
  • North America dominated the market and accounted for a 31.5% growth during the forecast period.
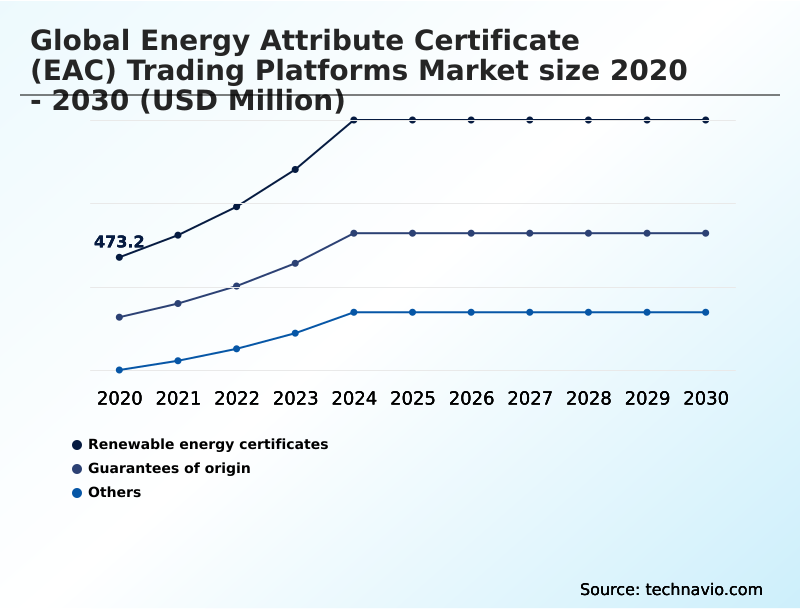
  • By Type - Renewable energy certificates segment was valued at USD 823.7 million in 2024
  • By End-user - Corporate buyers segment accounted for the largest market revenue share in 2024

Market Size & Forecast

  • Market Opportunities: USD 4.68 billion
  • Market Future Opportunities: USD 3.62 billion
  • CAGR from 2025 to 2030 : 22.6%

Market Summary

  • The energy attribute certificate (EAC) trading platforms market is driven by the global corporate push for verifiable decarbonization and transparent ESG reporting. These digital ecosystems provide the critical infrastructure for trading environmental attributes, enabling companies to meet renewable energy goals and mitigate regulatory risks.
  • The market is evolving rapidly with the integration of technologies like blockchain, which ensures the immutability of certificates and prevents double-counting. A key trend is the shift toward more granular tracking, such as hourly matching of energy consumption with renewable generation, which provides a more accurate representation of a company's carbon footprint.
  • For instance, a multinational manufacturing firm can use a unified platform to source and retire certificates from various jurisdictions, ensuring compliance with diverse regional mandates while maintaining a consistent global sustainability strategy. However, the industry faces challenges related to market fragmentation and the lack of a single international standard, which complicates cross-border transactions and increases administrative burdens for participants.
  • The ongoing development of these platforms is essential for creating liquid, efficient, and trustworthy global markets for environmental commodities.

What will be the Size of the Energy Attribute Certificate (EAC) Trading Platforms Market during the forecast period?

Get Key Insights on Market Forecast (PDF) Request Free Sample

How is the Energy Attribute Certificate (EAC) Trading Platforms Market Segmented?

The energy attribute certificate (eac) trading platforms industry research report provides comprehensive data (region-wise segment analysis), with forecasts and estimates in "USD million" for the period 2026-2030, as well as historical data from 2020-2024 for the following segments.

  • Type
    • Renewable energy certificates
    • Guarantees of origin
    • Others
  • End-user
    • Corporate buyers
    • Utilities and energy suppliers
    • Project developers
  • Platform
    • Exchange based trading platforms
    • Over the counter trading platforms
  • Geography
    • North America
      • US
      • Canada
      • Mexico
    • Europe
      • Germany
      • UK
      • France
    • APAC
      • China
      • India
      • Japan
    • Middle East and Africa
      • Saudi Arabia
      • UAE
      • South Africa
    • South America
      • Brazil
      • Argentina
      • Colombia
    • Rest of World (ROW)

By Type Insights

The renewable energy certificates segment is estimated to witness significant growth during the forecast period.

The segment for renewable energy certificates (RECs) is defined by its dual function in both compliance and voluntary markets. In compliance-driven markets, RECs are essential digital environmental assets for load-serving entities to meet state-mandated renewable portfolio standards.

The voluntary market, however, is shaped by corporate procurement strategies aligned with ESG reporting requirements and carbon accounting integration. Effective environmental attribute tracking and complete certificate lifecycle management are paramount.

Advanced platforms are now incorporating cross-border trading protocols to harmonize disparate regional systems.

This addresses a market where over 31% of growth is driven by regions with complex, multi-jurisdictional compliance needs, pushing platforms to support sophisticated demand-side management incentives and robust additionality criteria verification to ensure claim integrity.

Request Free Sample

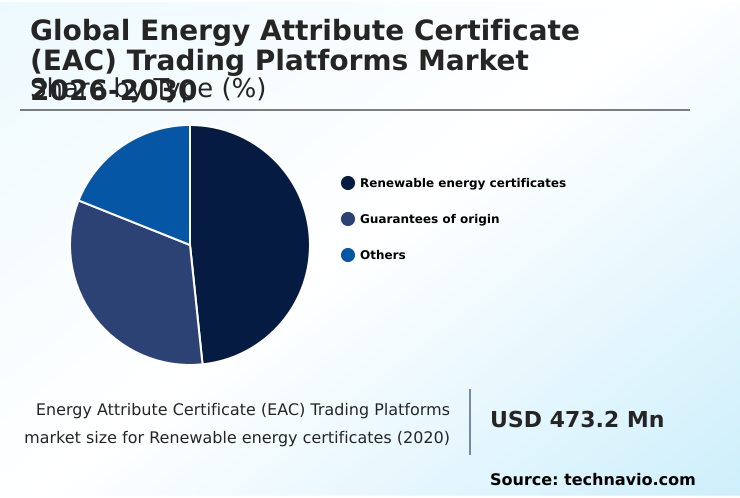
The Renewable energy certificates segment was valued at USD 823.7 million in 2024 and showed a gradual increase during the forecast period.

Request Free Sample

Regional Analysis

North America is estimated to contribute 31.5% to the growth of the global market during the forecast period.Technavio’s analysts have elaborately explained the regional trends and drivers that shape the market during the forecast period.

See How Energy Attribute Certificate (EAC) Trading Platforms Market Demand is Rising in North America Request Free Sample

The geographic landscape of the market is diverse, with established regions like Europe operating on a harmonized system of guarantees of origin, while North America is governed by state-level renewable portfolio standards.

APAC, representing the fastest-growing region with a CAGR of 23.9%, relies heavily on international renewable energy certificates to meet the ESG reporting requirements of multinational corporations.

North America is set to contribute over 31% of the market's incremental growth, driven by sophisticated corporate procurement strategies demanding granular certificate data.

Trading platforms are evolving to bridge these regional divides, offering both spot exchange marketplace access and regulated derivatives exchange products to manage risk. This global integration is critical for facilitating cross-border transactions and ensuring auditable environmental claims worldwide.

Market Dynamics

Our researchers analyzed the data with 2025 as the base year, along with the key drivers, trends, and challenges. A holistic analysis of drivers will help companies refine their marketing strategies to gain a competitive advantage.

  • The evolution of the global energy attribute certificate (EAC) trading platforms market 2026-2030 is creating sophisticated pathways for corporate decarbonization. The demand for platform solutions for 24/7 carbon-free energy is compelling providers to offer hourly REC matching software solutions, moving beyond annual accounting.
  • This granularity is essential for verifying additionality in voluntary REC markets and tracking Scope 2 emissions with EACs. Integrating EAC trading with ERP systems is becoming a key operational requirement for automating EAC procurement and retirement. As markets mature, the role of AI in EAC portfolio optimization will become critical for risk management for EAC price volatility.
  • The expansion into new asset classes, with dedicated certificate solutions for green biomethane and green hydrogen certificate market infrastructure, broadens the scope of environmental tracking. Technology is also at the forefront, with blockchain for renewable energy verification enabling trusted peer-to-peer trading for solar RECs.
  • However, challenges in global EAC market standardization persist, requiring advanced regulatory technology for EAC compliance and managing liquidity in emerging EAC markets. Digital marketplaces for corporate PPA EACs are streamlining complex transactions, yet firms focused on cross-border guarantees of origin trading must navigate a fragmented legal landscape.
  • This complexity underscores why the market, while expected to more than double in the forecast period, requires strategic foresight in operational planning to ensure compliance.

What are the key market drivers leading to the rise in the adoption of Energy Attribute Certificate (EAC) Trading Platforms Industry?

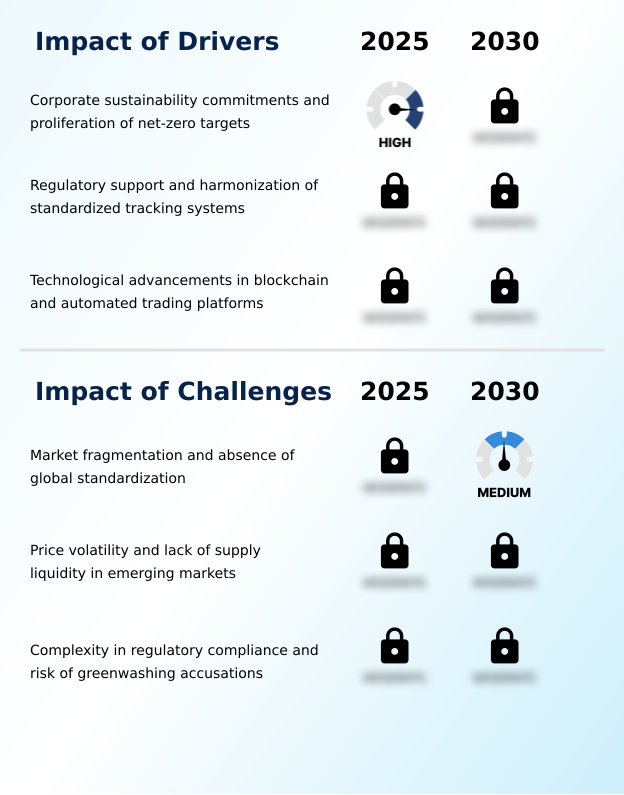
  • The proliferation of corporate sustainability commitments and the global push toward net-zero targets serve as a key driver for market growth.

  • Intensifying corporate sustainability commitments are a primary market driver, compelling organizations to adopt sophisticated tools for tracking scope 2 emissions reduction.
  • The integration of technology, particularly the use of a blockchain-based platform with immutable ledger technology, provides the auditable transaction trails necessary for credible reporting. This has been shown to reduce verification costs by up to 30%.
  • Smart contract execution automates procurement and retirement, enabling automated emissions reduction and streamlining adherence to complex regulatory compliance frameworks.
  • These platforms facilitate new models like peer-to-peer energy trading and integrate seamlessly with corporate energy management systems, improving data accuracy for sustainability reports by more than 50% and providing a robust framework for global environmental asset management.

What are the market trends shaping the Energy Attribute Certificate (EAC) Trading Platforms Industry?

  • A key market trend is the emergence of time-granular and hourly matching frameworks. This evolution is driven by the increasing demand for greater transparency and accuracy in renewable energy claims.

  • The market is shifting decisively toward high-resolution verification, with hourly matching frameworks and 24/7 carbon-free energy models becoming standard for companies pursuing ambitious net-zero emissions targets. This digital transformation of energy sourcing improves claim accuracy by over 40% compared to annual accounting.
  • The scope is also expanding beyond electricity to include green hydrogen certification and biomethane certification, creating integrated environmental commodity markets. Another key trend is the democratization of access through micro-EAC aggregation, which supports community-based sustainability projects.
  • Platforms are enhancing investment-grade data verification and integrating with complex power purchase agreements, enabling a more granular and transparent approach to decarbonization and reducing reporting discrepancies by up to 25%.

What challenges does the Energy Attribute Certificate (EAC) Trading Platforms Industry face during its growth?

  • Market fragmentation and the absence of a unified global standardization framework pose a key challenge to seamless cross-border trading and industry growth.

  • Navigating the complexities of global energy attribute certificate (EAC) trading platforms market is a significant challenge, largely due to persistent market fragmentation issues and a lack of harmonized rules from international standardization bodies. This environment exacerbates price volatility management and creates supply liquidity challenges, especially in emerging markets where trading volumes can be 40% lower than in mature regions.
  • The rise of decentralized energy resources and specialized instruments like emissionality-based EACs adds another layer of complexity, increasing the operational burden for ensuring effective counterparty risk mitigation.
  • Moreover, heightened scrutiny under new climate disclosure regulations and frameworks like the carbon border adjustment mechanism elevates the need for robust greenwashing risk mitigation, with firms facing a 25% higher risk of compliance failure without advanced tracking systems.

Exclusive Technavio Analysis on Customer Landscape

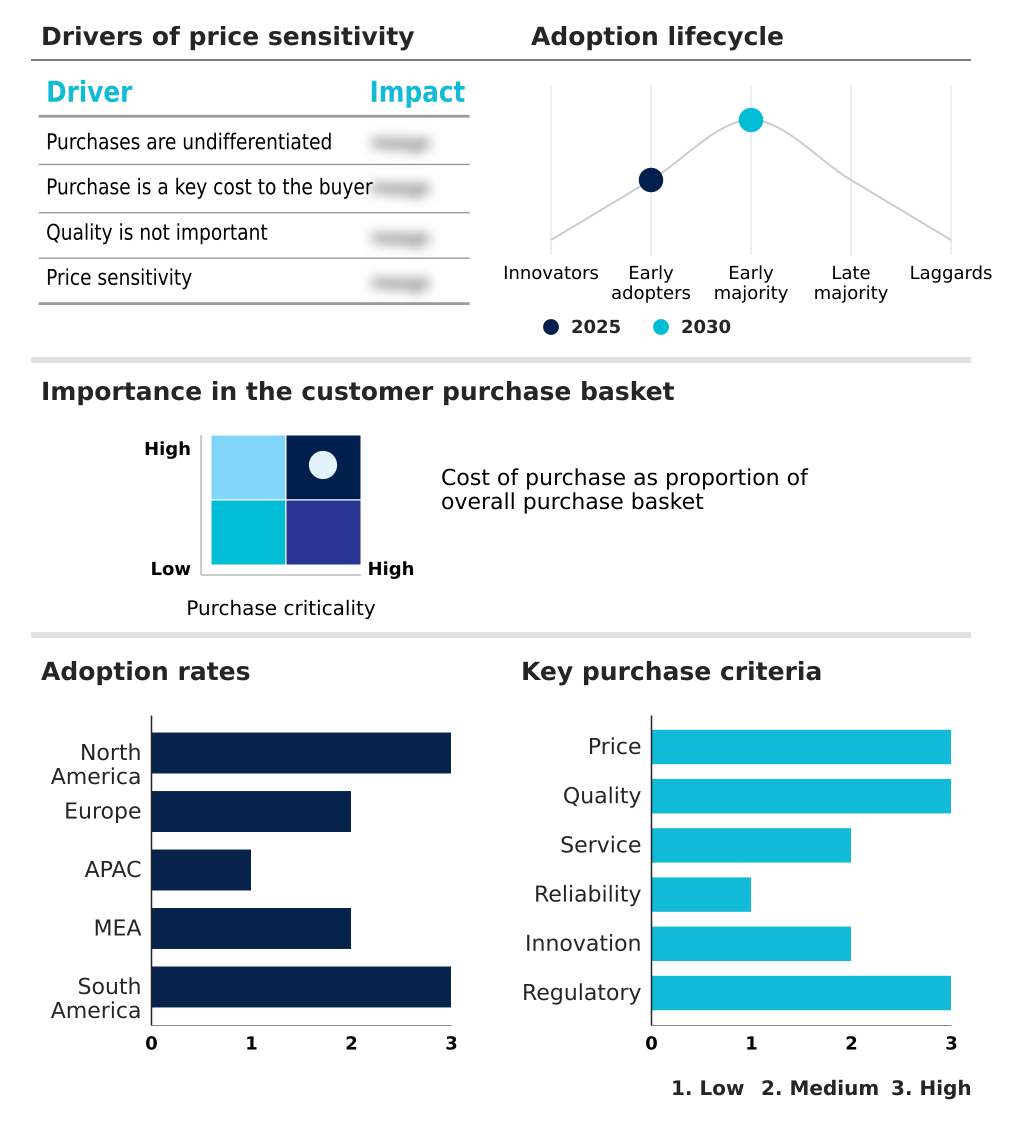
The energy attribute certificate (eac) trading platforms market forecasting report includes the adoption lifecycle of the market, covering from the innovator’s stage to the laggard’s stage. It focuses on adoption rates in different regions based on penetration. Furthermore, the energy attribute certificate (eac) trading platforms market report also includes key purchase criteria and drivers of price sensitivity to help companies evaluate and develop their market growth analysis strategies.

Customer Landscape of Energy Attribute Certificate (EAC) Trading Platforms Industry

Competitive Landscape

Companies are implementing various strategies, such as strategic alliances, energy attribute certificate (eac) trading platforms market forecast, partnerships, mergers and acquisitions, geographical expansion, and product/service launches, to enhance their presence in the industry.

ACT Group - Delivers regulated spot and futures markets, enhancing liquidity and price discovery for environmental commodities through integrated registry and clearing services.

The industry research and growth report includes detailed analyses of the competitive landscape of the market and information about key companies, including:

  • ACT Group
  • ALLCOT
  • Clearloop
  • Ecohz
  • EEX Group
  • ENGIE SA
  • Evident
  • Flexidao
  • LevelTen Energy
  • Nasdaq Inc.
  • Nodal Exchange
  • Pexapark
  • Powerledger
  • Redshaw Advisors Ltd.
  • South Pole
  • Statkraft AS
  • STX Group
  • Targray Technology Inc.
  • WattTime
  • Xpansiv

Qualitative and quantitative analysis of companies has been conducted to help clients understand the wider business environment as well as the strengths and weaknesses of key industry players. Data is qualitatively analyzed to categorize companies as pure play, category-focused, industry-focused, and diversified; it is quantitatively analyzed to categorize companies as dominant, leading, strong, tentative, and weak.

Recent Development and News in Energy attribute certificate (eac) trading platforms market

  • In May 2025, the Indonesia Commodity and Derivatives Exchange (ICDX) announced that it had formally obtained regulatory approval from the Commodity Futures Trading Regulatory Agency (Bappebti) to operate as the authorized exchange for Renewable Energy Certificate (REC) trading in Indonesia.
  • In October 2025, Constellation Energy, together with Xpansiv, announced plans to introduce clean energy-based annual Emission-Free Energy Certificates (EFECs) on an online trading platform.
  • In October 2025, Singapores Ministry of Trade and Industry (MTI), the Energy Market Authority (EMA), and the I-TRACK Foundation announced plans to develop a cross-border Renewable Energy Certificate (REC) framework tailored for Southeast Asia.
  • In March 2025, the Astana International Exchange (AIX) launched trading in International Renewable Energy Certificates (I-REC), representing a significant advancement in Kazakhstans sustainable finance framework and voluntary carbon market development.

Dive into Technavio’s robust research methodology, blending expert interviews, extensive data synthesis, and validated models for unparalleled Energy Attribute Certificate (EAC) Trading Platforms Market insights. See full methodology.

Market Scope
Page number 287
Base year 2025
Historic period 2020-2024
Forecast period 2026-2030
Growth momentum & CAGR Accelerate at a CAGR of 22.6%
Market growth 2026-2030 USD 3615.2 million
Market structure Fragmented
YoY growth 2025-2026(%) 21.2%
Key countries US, Canada, Mexico, Germany, UK, France, Italy, The Netherlands, Spain, China, India, Japan, South Korea, Australia, Indonesia, Saudi Arabia, UAE, South Africa, Israel, Turkey, Brazil, Argentina and Colombia
Competitive landscape Leading Companies, Market Positioning of Companies, Competitive Strategies, and Industry Risks

Request Free Sample

Research Analyst Overview

  • The market's architecture is rapidly advancing through the integration of sophisticated technologies. A blockchain-based platform provides an immutable ledger technology, crucial for environmental attribute tracking and ensuring the integrity of renewable energy certificates and guarantees of origin.
  • This technological backbone supports a diverse ecosystem, including peer-to-peer energy trading, a regulated derivatives exchange for hedging, and a spot exchange marketplace for immediate procurement. The push for greater transparency is driving the adoption of time-granular tracking and hourly matching frameworks, enabling true 24/7 carbon-free energy accounting.
  • The integration of such platforms has demonstrated a 30% reduction in the administrative burden associated with environmental reporting. Boardroom decisions are now heavily influenced by the availability of green hydrogen certification and biomethane certification, signaling long-term investment shifts toward new energy carriers.
  • Platforms facilitate this through complete certificate lifecycle management, handling everything from micro-EAC aggregation from decentralized energy resources to the execution of cross-border trading protocols. This ensures that digital environmental assets are managed with precision, supporting both compliance and voluntary sustainability goals.

What are the Key Data Covered in this Energy Attribute Certificate (EAC) Trading Platforms Market Research and Growth Report?

  • What is the expected growth of the Energy Attribute Certificate (EAC) Trading Platforms Market between 2026 and 2030?

    • USD 3.62 billion, at a CAGR of 22.6%

  • What segmentation does the market report cover?

    • The report is segmented by Type (Renewable energy certificates, Guarantees of origin, and Others), End-user (Corporate buyers, Utilities and energy suppliers, and Project developers), Platform (Exchange based trading platforms, and Over the counter trading platforms) and Geography (North America, Europe, APAC, Middle East and Africa, South America)

  • Which regions are analyzed in the report?

    • North America, Europe, APAC, Middle East and Africa and South America

  • What are the key growth drivers and market challenges?

    • Corporate sustainability commitments and proliferation of net-zero targets, Market fragmentation and absence of global standardization

  • Who are the major players in the Energy Attribute Certificate (EAC) Trading Platforms Market?

    • ACT Group, ALLCOT, Clearloop, Ecohz, EEX Group, ENGIE SA, Evident, Flexidao, LevelTen Energy, Nasdaq Inc., Nodal Exchange, Pexapark, Powerledger, Redshaw Advisors Ltd., South Pole, Statkraft AS, STX Group, Targray Technology Inc., WattTime and Xpansiv

Market Research Insights

  • Market dynamics are shaped by escalating ESG reporting requirements and complex corporate procurement strategies, where the impact of undifferentiated certificate purchases is high. Platform adoption has increased by 40% among firms with stringent corporate sustainability commitments, as these systems provide the investment-grade data verification needed for auditable transaction trails.
  • Effective platforms reduce compliance-related reporting errors by over 60%, a critical factor as companies navigate diverse climate disclosure regulations and mitigate greenwashing risks. The need to manage market fragmentation issues and counterparty risk is also driving innovation, pushing providers to offer more sophisticated tools that integrate with existing energy management systems and support global net-zero emissions targets.

We can help! Our analysts can customize this energy attribute certificate (eac) trading platforms market research report to meet your requirements.

Get in touch

1. Executive Summary

1.1 Market overview

Executive Summary - Chart on Market Overview
Executive Summary - Data Table on Market Overview
Executive Summary - Chart on Global Market Characteristics
Executive Summary - Chart on Market by Geography
Executive Summary - Chart on Market Segmentation by Type
Executive Summary - Chart on Market Segmentation by End-user
Executive Summary - Chart on Market Segmentation by Platform
Executive Summary - Chart on Incremental Growth
Executive Summary - Data Table on Incremental Growth
Executive Summary - Chart on Company Market Positioning

2. Technavio Analysis

2.1 Analysis of price sensitivity, lifecycle, customer purchase basket, adoption rates, and purchase criteria

2.2 Criticality of inputs and Factors of differentiation

Chart on Overview on criticality of inputs and factors of differentiation

2.3 Factors of disruption

Chart on Overview on factors of disruption

2.4 Impact of drivers and challenges

Chart on Impact of drivers and challenges in 2025 and 2030

3. Market Landscape

3.1 Market ecosystem

Chart on Parent Market
Data Table on - Parent Market

3.2 Market characteristics

Chart on Market characteristics analysis

3.3 Value chain analysis

Chart on Value chain analysis

4. Market Sizing

4.1 Market definition

Data Table on Offerings of companies included in the market definition

4.2 Market segment analysis

Market segments

4.3 Market size 2025

4.4 Market outlook: Forecast for 2025-2030

Chart on Global - Market size and forecast 2025-2030 ($ million)
Data Table on Global - Market size and forecast 2025-2030 ($ million)
Chart on Global Market: Year-over-year growth 2025-2030 (%)
Data Table on Global Market: Year-over-year growth 2025-2030 (%)

5. Historic Market Size

5.1 Global Energy Attribute Certificate (EAC) Trading Platforms Market 2020 - 2024

Historic Market Size - Data Table on Global Energy Attribute Certificate (EAC) Trading Platforms Market 2020 - 2024 ($ million)

5.2 Type segment analysis 2020 - 2024

Historic Market Size - Type Segment 2020 - 2024 ($ million)

5.3 End-user segment analysis 2020 - 2024

Historic Market Size - End-user Segment 2020 - 2024 ($ million)

5.4 Platform segment analysis 2020 - 2024

Historic Market Size - Platform Segment 2020 - 2024 ($ million)

5.5 Geography segment analysis 2020 - 2024

Historic Market Size - Geography Segment 2020 - 2024 ($ million)

5.6 Country segment analysis 2020 - 2024

Historic Market Size - Country Segment 2020 - 2024 ($ million)

6. Qualitative Analysis

6.1 Impact of AI on Global Energy Attribute Certificate (EAC) Trading Platforms Market

7. Five Forces Analysis

7.1 Five forces summary

Five forces analysis - Comparison between 2025 and 2030

7.2 Bargaining power of buyers

Bargaining power of buyers - Impact of key factors 2025 and 2030

7.3 Bargaining power of suppliers

Bargaining power of suppliers - Impact of key factors in 2025 and 2030

7.4 Threat of new entrants

Threat of new entrants - Impact of key factors in 2025 and 2030

7.5 Threat of substitutes

Threat of substitutes - Impact of key factors in 2025 and 2030

7.6 Threat of rivalry

Threat of rivalry - Impact of key factors in 2025 and 2030

7.7 Market condition

Chart on Market condition - Five forces 2025 and 2030

8. Market Segmentation by Type

8.1 Market segments

Chart on Type - Market share 2025-2030 (%)
Data Table on Type - Market share 2025-2030 (%)

8.2 Comparison by Type

Chart on Comparison by Type
Data Table on Comparison by Type

8.3 Renewable energy certificates - Market size and forecast 2025-2030

Chart on Renewable energy certificates - Market size and forecast 2025-2030 ($ million)
Data Table on Renewable energy certificates - Market size and forecast 2025-2030 ($ million)
Chart on Renewable energy certificates - Year-over-year growth 2025-2030 (%)
Data Table on Renewable energy certificates - Year-over-year growth 2025-2030 (%)

8.4 Guarantees of origin - Market size and forecast 2025-2030

Chart on Guarantees of origin - Market size and forecast 2025-2030 ($ million)
Data Table on Guarantees of origin - Market size and forecast 2025-2030 ($ million)
Chart on Guarantees of origin - Year-over-year growth 2025-2030 (%)
Data Table on Guarantees of origin - Year-over-year growth 2025-2030 (%)

8.5 Others - Market size and forecast 2025-2030

Chart on Others - Market size and forecast 2025-2030 ($ million)
Data Table on Others - Market size and forecast 2025-2030 ($ million)
Chart on Others - Year-over-year growth 2025-2030 (%)
Data Table on Others - Year-over-year growth 2025-2030 (%)

8.6 Market opportunity by Type

Market opportunity by Type ($ million)
Data Table on Market opportunity by Type ($ million)

9. Market Segmentation by End-user

9.1 Market segments

Chart on End-user - Market share 2025-2030 (%)
Data Table on End-user - Market share 2025-2030 (%)

9.2 Comparison by End-user

Chart on Comparison by End-user
Data Table on Comparison by End-user

9.3 Corporate buyers - Market size and forecast 2025-2030

Chart on Corporate buyers - Market size and forecast 2025-2030 ($ million)
Data Table on Corporate buyers - Market size and forecast 2025-2030 ($ million)
Chart on Corporate buyers - Year-over-year growth 2025-2030 (%)
Data Table on Corporate buyers - Year-over-year growth 2025-2030 (%)

9.4 Utilities and energy suppliers - Market size and forecast 2025-2030

Chart on Utilities and energy suppliers - Market size and forecast 2025-2030 ($ million)
Data Table on Utilities and energy suppliers - Market size and forecast 2025-2030 ($ million)
Chart on Utilities and energy suppliers - Year-over-year growth 2025-2030 (%)
Data Table on Utilities and energy suppliers - Year-over-year growth 2025-2030 (%)

9.5 Project developers - Market size and forecast 2025-2030

Chart on Project developers - Market size and forecast 2025-2030 ($ million)
Data Table on Project developers - Market size and forecast 2025-2030 ($ million)
Chart on Project developers - Year-over-year growth 2025-2030 (%)
Data Table on Project developers - Year-over-year growth 2025-2030 (%)

9.6 Market opportunity by End-user

Market opportunity by End-user ($ million)
Data Table on Market opportunity by End-user ($ million)

10. Market Segmentation by Platform

10.1 Market segments

Chart on Platform - Market share 2025-2030 (%)
Data Table on Platform - Market share 2025-2030 (%)

10.2 Comparison by Platform

Chart on Comparison by Platform
Data Table on Comparison by Platform

10.3 Exchange based trading platforms - Market size and forecast 2025-2030

Chart on Exchange based trading platforms - Market size and forecast 2025-2030 ($ million)
Data Table on Exchange based trading platforms - Market size and forecast 2025-2030 ($ million)
Chart on Exchange based trading platforms - Year-over-year growth 2025-2030 (%)
Data Table on Exchange based trading platforms - Year-over-year growth 2025-2030 (%)

10.4 Over the counter trading platforms - Market size and forecast 2025-2030

Chart on Over the counter trading platforms - Market size and forecast 2025-2030 ($ million)
Data Table on Over the counter trading platforms - Market size and forecast 2025-2030 ($ million)
Chart on Over the counter trading platforms - Year-over-year growth 2025-2030 (%)
Data Table on Over the counter trading platforms - Year-over-year growth 2025-2030 (%)

10.5 Market opportunity by Platform

Market opportunity by Platform ($ million)
Data Table on Market opportunity by Platform ($ million)

11. Customer Landscape

11.1 Customer landscape overview

Analysis of price sensitivity, lifecycle, customer purchase basket, adoption rates, and purchase criteria

12. Geographic Landscape

12.1 Geographic segmentation

Chart on Market share by geography 2025-2030 (%)
Data Table on Market share by geography 2025-2030 (%)

12.2 Geographic comparison

Chart on Geographic comparison
Data Table on Geographic comparison

12.3 North America - Market size and forecast 2025-2030

Chart on North America - Market size and forecast 2025-2030 ($ million)
Data Table on North America - Market size and forecast 2025-2030 ($ million)
Chart on North America - Year-over-year growth 2025-2030 (%)
Data Table on North America - Year-over-year growth 2025-2030 (%)
Chart on Regional Comparison - North America
Data Table on Regional Comparison - North America

12.3.1 US - Market size and forecast 2025-2030

Chart on US - Market size and forecast 2025-2030 ($ million)
Data Table on US - Market size and forecast 2025-2030 ($ million)
Chart on US - Year-over-year growth 2025-2030 (%)
Data Table on US - Year-over-year growth 2025-2030 (%)

12.3.2 Canada - Market size and forecast 2025-2030

Chart on Canada - Market size and forecast 2025-2030 ($ million)
Data Table on Canada - Market size and forecast 2025-2030 ($ million)
Chart on Canada - Year-over-year growth 2025-2030 (%)
Data Table on Canada - Year-over-year growth 2025-2030 (%)

12.3.3 Mexico - Market size and forecast 2025-2030

Chart on Mexico - Market size and forecast 2025-2030 ($ million)
Data Table on Mexico - Market size and forecast 2025-2030 ($ million)
Chart on Mexico - Year-over-year growth 2025-2030 (%)
Data Table on Mexico - Year-over-year growth 2025-2030 (%)

12.4 Europe - Market size and forecast 2025-2030

Chart on Europe - Market size and forecast 2025-2030 ($ million)
Data Table on Europe - Market size and forecast 2025-2030 ($ million)
Chart on Europe - Year-over-year growth 2025-2030 (%)
Data Table on Europe - Year-over-year growth 2025-2030 (%)
Chart on Regional Comparison - Europe
Data Table on Regional Comparison - Europe

12.4.1 Germany - Market size and forecast 2025-2030

Chart on Germany - Market size and forecast 2025-2030 ($ million)
Data Table on Germany - Market size and forecast 2025-2030 ($ million)
Chart on Germany - Year-over-year growth 2025-2030 (%)
Data Table on Germany - Year-over-year growth 2025-2030 (%)

12.4.2 UK - Market size and forecast 2025-2030

Chart on UK - Market size and forecast 2025-2030 ($ million)
Data Table on UK - Market size and forecast 2025-2030 ($ million)
Chart on UK - Year-over-year growth 2025-2030 (%)
Data Table on UK - Year-over-year growth 2025-2030 (%)

12.4.3 France - Market size and forecast 2025-2030

Chart on France - Market size and forecast 2025-2030 ($ million)
Data Table on France - Market size and forecast 2025-2030 ($ million)
Chart on France - Year-over-year growth 2025-2030 (%)
Data Table on France - Year-over-year growth 2025-2030 (%)

12.4.4 Italy - Market size and forecast 2025-2030

Chart on Italy - Market size and forecast 2025-2030 ($ million)
Data Table on Italy - Market size and forecast 2025-2030 ($ million)
Chart on Italy - Year-over-year growth 2025-2030 (%)
Data Table on Italy - Year-over-year growth 2025-2030 (%)

12.4.5 The Netherlands - Market size and forecast 2025-2030

Chart on The Netherlands - Market size and forecast 2025-2030 ($ million)
Data Table on The Netherlands - Market size and forecast 2025-2030 ($ million)
Chart on The Netherlands - Year-over-year growth 2025-2030 (%)
Data Table on The Netherlands - Year-over-year growth 2025-2030 (%)

12.4.6 Spain - Market size and forecast 2025-2030

Chart on Spain - Market size and forecast 2025-2030 ($ million)
Data Table on Spain - Market size and forecast 2025-2030 ($ million)
Chart on Spain - Year-over-year growth 2025-2030 (%)
Data Table on Spain - Year-over-year growth 2025-2030 (%)

12.5 APAC - Market size and forecast 2025-2030

Chart on APAC - Market size and forecast 2025-2030 ($ million)
Data Table on APAC - Market size and forecast 2025-2030 ($ million)
Chart on APAC - Year-over-year growth 2025-2030 (%)
Data Table on APAC - Year-over-year growth 2025-2030 (%)
Chart on Regional Comparison - APAC
Data Table on Regional Comparison - APAC

12.5.1 China - Market size and forecast 2025-2030

Chart on China - Market size and forecast 2025-2030 ($ million)
Data Table on China - Market size and forecast 2025-2030 ($ million)
Chart on China - Year-over-year growth 2025-2030 (%)
Data Table on China - Year-over-year growth 2025-2030 (%)

12.5.2 India - Market size and forecast 2025-2030

Chart on India - Market size and forecast 2025-2030 ($ million)
Data Table on India - Market size and forecast 2025-2030 ($ million)
Chart on India - Year-over-year growth 2025-2030 (%)
Data Table on India - Year-over-year growth 2025-2030 (%)

12.5.3 Japan - Market size and forecast 2025-2030

Chart on Japan - Market size and forecast 2025-2030 ($ million)
Data Table on Japan - Market size and forecast 2025-2030 ($ million)
Chart on Japan - Year-over-year growth 2025-2030 (%)
Data Table on Japan - Year-over-year growth 2025-2030 (%)

12.5.4 South Korea - Market size and forecast 2025-2030

Chart on South Korea - Market size and forecast 2025-2030 ($ million)
Data Table on South Korea - Market size and forecast 2025-2030 ($ million)
Chart on South Korea - Year-over-year growth 2025-2030 (%)
Data Table on South Korea - Year-over-year growth 2025-2030 (%)

12.5.5 Australia - Market size and forecast 2025-2030

Chart on Australia - Market size and forecast 2025-2030 ($ million)
Data Table on Australia - Market size and forecast 2025-2030 ($ million)
Chart on Australia - Year-over-year growth 2025-2030 (%)
Data Table on Australia - Year-over-year growth 2025-2030 (%)

12.5.6 Indonesia - Market size and forecast 2025-2030

Chart on Indonesia - Market size and forecast 2025-2030 ($ million)
Data Table on Indonesia - Market size and forecast 2025-2030 ($ million)
Chart on Indonesia - Year-over-year growth 2025-2030 (%)
Data Table on Indonesia - Year-over-year growth 2025-2030 (%)

12.6 Middle East and Africa - Market size and forecast 2025-2030

Chart on Middle East and Africa - Market size and forecast 2025-2030 ($ million)
Data Table on Middle East and Africa - Market size and forecast 2025-2030 ($ million)
Chart on Middle East and Africa - Year-over-year growth 2025-2030 (%)
Data Table on Middle East and Africa - Year-over-year growth 2025-2030 (%)
Chart on Regional Comparison - Middle East and Africa
Data Table on Regional Comparison - Middle East and Africa

12.6.1 Saudi Arabia - Market size and forecast 2025-2030

Chart on Saudi Arabia - Market size and forecast 2025-2030 ($ million)
Data Table on Saudi Arabia - Market size and forecast 2025-2030 ($ million)
Chart on Saudi Arabia - Year-over-year growth 2025-2030 (%)
Data Table on Saudi Arabia - Year-over-year growth 2025-2030 (%)

12.6.2 UAE - Market size and forecast 2025-2030

Chart on UAE - Market size and forecast 2025-2030 ($ million)
Data Table on UAE - Market size and forecast 2025-2030 ($ million)
Chart on UAE - Year-over-year growth 2025-2030 (%)
Data Table on UAE - Year-over-year growth 2025-2030 (%)

12.6.3 South Africa - Market size and forecast 2025-2030

Chart on South Africa - Market size and forecast 2025-2030 ($ million)
Data Table on South Africa - Market size and forecast 2025-2030 ($ million)
Chart on South Africa - Year-over-year growth 2025-2030 (%)
Data Table on South Africa - Year-over-year growth 2025-2030 (%)

12.6.4 Israel - Market size and forecast 2025-2030

Chart on Israel - Market size and forecast 2025-2030 ($ million)
Data Table on Israel - Market size and forecast 2025-2030 ($ million)
Chart on Israel - Year-over-year growth 2025-2030 (%)
Data Table on Israel - Year-over-year growth 2025-2030 (%)

12.6.5 Turkey - Market size and forecast 2025-2030

Chart on Turkey - Market size and forecast 2025-2030 ($ million)
Data Table on Turkey - Market size and forecast 2025-2030 ($ million)
Chart on Turkey - Year-over-year growth 2025-2030 (%)
Data Table on Turkey - Year-over-year growth 2025-2030 (%)

12.7 South America - Market size and forecast 2025-2030

Chart on South America - Market size and forecast 2025-2030 ($ million)
Data Table on South America - Market size and forecast 2025-2030 ($ million)
Chart on South America - Year-over-year growth 2025-2030 (%)
Data Table on South America - Year-over-year growth 2025-2030 (%)
Chart on Regional Comparison - South America
Data Table on Regional Comparison - South America

12.7.1 Brazil - Market size and forecast 2025-2030

Chart on Brazil - Market size and forecast 2025-2030 ($ million)
Data Table on Brazil - Market size and forecast 2025-2030 ($ million)
Chart on Brazil - Year-over-year growth 2025-2030 (%)
Data Table on Brazil - Year-over-year growth 2025-2030 (%)

12.7.2 Argentina - Market size and forecast 2025-2030

Chart on Argentina - Market size and forecast 2025-2030 ($ million)
Data Table on Argentina - Market size and forecast 2025-2030 ($ million)
Chart on Argentina - Year-over-year growth 2025-2030 (%)
Data Table on Argentina - Year-over-year growth 2025-2030 (%)

12.7.3 Colombia - Market size and forecast 2025-2030

Chart on Colombia - Market size and forecast 2025-2030 ($ million)
Data Table on Colombia - Market size and forecast 2025-2030 ($ million)
Chart on Colombia - Year-over-year growth 2025-2030 (%)
Data Table on Colombia - Year-over-year growth 2025-2030 (%)

12.8 Market opportunity by geography

Market opportunity by geography ($ million)
Data Tables on Market opportunity by geography ($ million)

13. Drivers, Challenges, and Opportunity

13.1 Market drivers

Corporate sustainability commitments and proliferation of net-zero targets
Regulatory support and harmonization of standardized tracking systems
Technological advancements in blockchain and automated trading platforms

13.2 Market challenges

Market fragmentation and absence of global standardization
Price volatility and lack of supply liquidity in emerging markets
Complexity in regulatory compliance and risk of greenwashing accusations

13.3 Impact of drivers and challenges

Impact of drivers and challenges in 2025 and 2030

13.4 Market opportunities

Emergence of time-granular and hourly matching frameworks
Diversification into non-electricity attributes for green hydrogen and biomethane
Decentralization and rise of micro-EACs for small and medium enterprises

14. Competitive Landscape

14.1 Overview

14.2

Overview on criticality of inputs and factors of differentiation

14.3 Landscape disruption

Overview on factors of disruption

14.4 Industry risks

Impact of key risks on business

15. Competitive Analysis

15.1 Companies profiled

Companies covered

15.2 Company ranking index

15.3 Market positioning of companies

Matrix on companies position and classification

15.4 Clearloop

Clearloop - Overview
Clearloop - Product / Service
Clearloop - Key offerings
SWOT

15.5 Ecohz

Ecohz - Overview
Ecohz - Product / Service
Ecohz - Key offerings
SWOT

15.6 EEX Group

EEX Group - Overview
EEX Group - Product / Service
EEX Group - Key offerings
SWOT

15.7 ENGIE SA

ENGIE SA - Overview
ENGIE SA - Business segments
ENGIE SA - Key offerings
ENGIE SA - Segment focus
SWOT

15.8 Evident

Evident - Overview
Evident - Product / Service
Evident - Key offerings
SWOT

15.9 Flexidao

Flexidao - Overview
Flexidao - Product / Service
Flexidao - Key offerings
SWOT

15.10 LevelTen Energy

LevelTen Energy - Overview
LevelTen Energy - Product / Service
LevelTen Energy - Key offerings
SWOT

15.11 Nodal Exchange

Nodal Exchange - Overview
Nodal Exchange - Product / Service
Nodal Exchange - Key offerings
SWOT

15.12 Pexapark

Pexapark - Overview
Pexapark - Product / Service
Pexapark - Key offerings
SWOT

15.13 Powerledger

Powerledger - Overview
Powerledger - Product / Service
Powerledger - Key offerings
SWOT

15.14 Redshaw Advisors Ltd.

Redshaw Advisors Ltd. - Overview
Redshaw Advisors Ltd. - Product / Service
Redshaw Advisors Ltd. - Key offerings
SWOT

15.15 South Pole

South Pole - Overview
South Pole - Product / Service
South Pole - Key offerings
SWOT

15.16 STX Group

STX Group - Overview
STX Group - Product / Service
STX Group - Key offerings
SWOT

15.17 WattTime

WattTime - Overview
WattTime - Product / Service
WattTime - Key offerings
SWOT

15.18 Xpansiv

Xpansiv - Overview
Xpansiv - Product / Service
Xpansiv - Key offerings
SWOT

16. Appendix

16.1 Scope of the report

Market definition
Objectives
Notes and caveats

16.2 Inclusions and exclusions checklist

Inclusions checklist
Exclusions checklist

16.3 Currency conversion rates for US$

16.4 Research methodology

16.5 Data procurement

Information sources

16.6 Data validation

16.7 Validation techniques employed for market sizing

16.8 Data synthesis

16.9 360 degree market analysis

16.10 List of abbreviations

Research Methodology

Technavio presents a detailed picture of the market by way of study, synthesis, and summation of data from multiple sources. The analysts have presented the various facets of the market with a particular focus on identifying the key industry influencers. The data thus presented is comprehensive, reliable, and the result of extensive research, both primary and secondary.

INFORMATION SOURCES

Primary sources

  • Manufacturers and suppliers
  • Channel partners
  • Industry experts
  • Strategic decision makers

Secondary sources

  • Industry journals and periodicals
  • Government data
  • Financial reports of key industry players
  • Historical data
  • Press releases

DATA ANALYSIS

Data Synthesis

  • Collation of data
  • Estimation of key figures
  • Analysis of derived insights

Data Validation

  • Triangulation with data models
  • Reference against proprietary databases
  • Corroboration with industry experts

REPORT WRITING

Qualitative

  • Market drivers
  • Market challenges
  • Market trends
  • Five forces analysis

Quantitative

  • Market size and forecast
  • Market segmentation
  • Geographical insights
  • Competitive landscape

Interested in this report?

Get your sample now to see our research methodology and insights!

Download Now

Frequently Asked Questions

Energy Attribute Certificate (EAC) Trading Platforms market growth will increase by USD 3615.2 million during 2026-2030.

The Energy Attribute Certificate (EAC) Trading Platforms market is expected to grow at a CAGR of 22.6% during 2026-2030.

Energy Attribute Certificate (EAC) Trading Platforms market is segmented by Type (Renewable energy certificates, Guarantees of origin, Others) End-user (Corporate buyers, Utilities and energy suppliers, Project developers) Platform (Exchange based trading platforms, Over the counter trading platforms)

ACT Group, ALLCOT, Clearloop, Ecohz, EEX Group, ENGIE SA, Evident, Flexidao, LevelTen Energy, Nasdaq Inc., Nodal Exchange, Pexapark, Powerledger, Redshaw Advisors Ltd., South Pole, Statkraft AS, STX Group, Targray Technology Inc., WattTime, Xpansiv are a few of the key vendors in the Energy Attribute Certificate (EAC) Trading Platforms market.

North America will register the highest growth rate of 31.5% among the other regions. Therefore, the Energy Attribute Certificate (EAC) Trading Platforms market in North America is expected to garner significant business opportunities for the vendors during the forecast period.

US, Canada, Mexico, Germany, UK, France, Italy, The Netherlands, Spain, China, India, Japan, South Korea, Australia, Indonesia, Saudi Arabia, UAE, South Africa, Israel, Turkey, Brazil, Argentina, Colombia

  • Corporate sustainability commitments and proliferation of net-zero targets is the driving factor this market.

The Energy Attribute Certificate (EAC) Trading Platforms market vendors should focus on grabbing business opportunities from the Type segment as it accounted for the largest market share in the base year.
RIA - Research AI Assistant
Ask RIA