Enterprise Prompt Management Platforms Market Analysis, Size, and Forecast 2026-2030: North America (US, Canada, and Mexico), Europe (Germany, UK, and France), APAC (China, India, and Japan), Middle East and Africa (Saudi Arabia, UAE, and South Africa), South America (Brazil, Argentina, and Colombia), and Rest of World (ROW)

Enterprise Prompt Management Platforms Market Analysis, Size, and Forecast 2026-2030:
North America (US, Canada, and Mexico), Europe (Germany, UK, and France), APAC (China, India, and Japan), Middle East and Africa (Saudi Arabia, UAE, and South Africa), South America (Brazil, Argentina, and Colombia), and Rest of World (ROW)

Published: May 2026 291 Pages SKU: IRTNTR81283

Market Overview at a Glance

$2.44 B
Market Opportunity
32.5%
CAGR 2025 - 2030
36.1%
North America Growth
$402.3 Mn
Cloud-based segment 2024

Enterprise Prompt Management Platforms Market Size and Growth Forecast 2026-2030

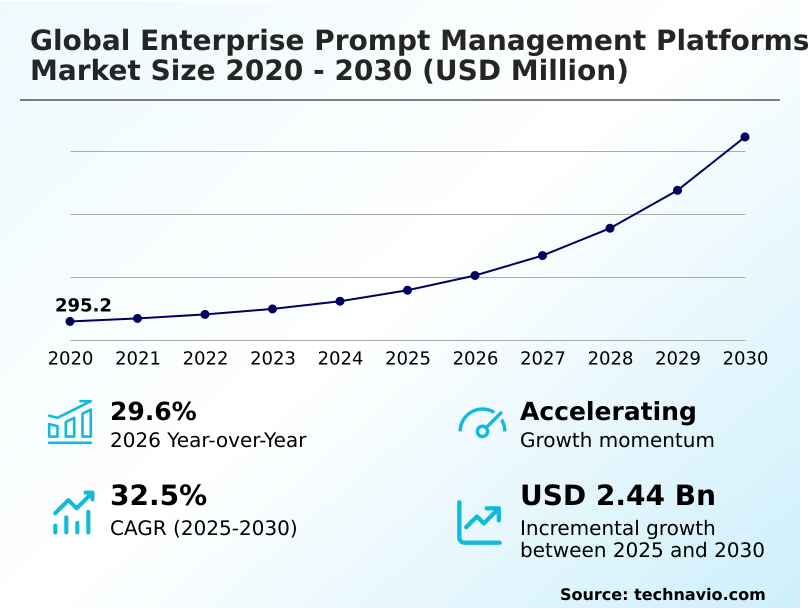
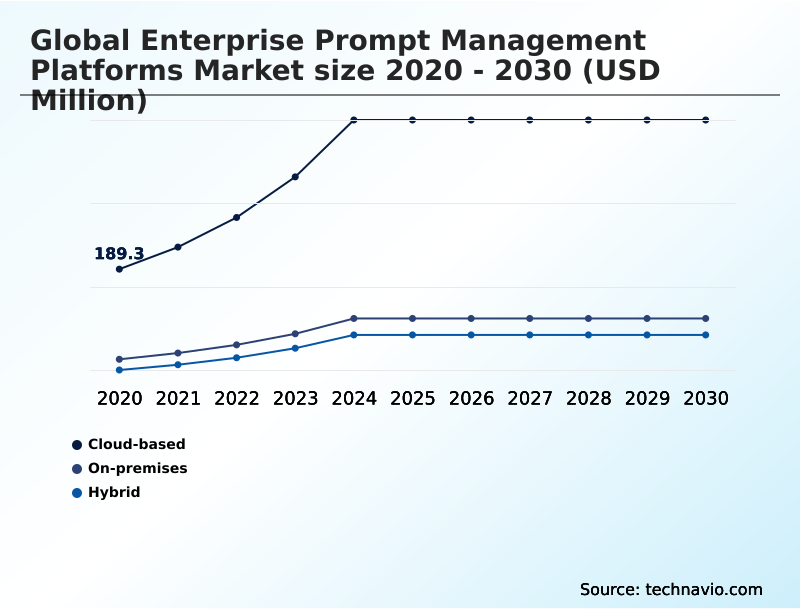
The Enterprise Prompt Management Platforms Market size was valued at USD 791.7 million in 2025 growing at a CAGR of 32.5% during the forecast period 2026-2030.

North America accounts for 36.1% of incremental growth during the forecast period. The Cloud-based segment by Deployment was valued at USD 402.3 million in 2024, while the Large enterprises segment holds the largest revenue share by End-user.

The market is projected to grow by USD 2.94 billion from 2020 to 2030, with USD 2.44 billion of the growth expected during the forecast period of 2025 to 2030.

Get Key Insights on Market Forecast (PDF) Request Free Sample

Enterprise Prompt Management Platforms Market Overview

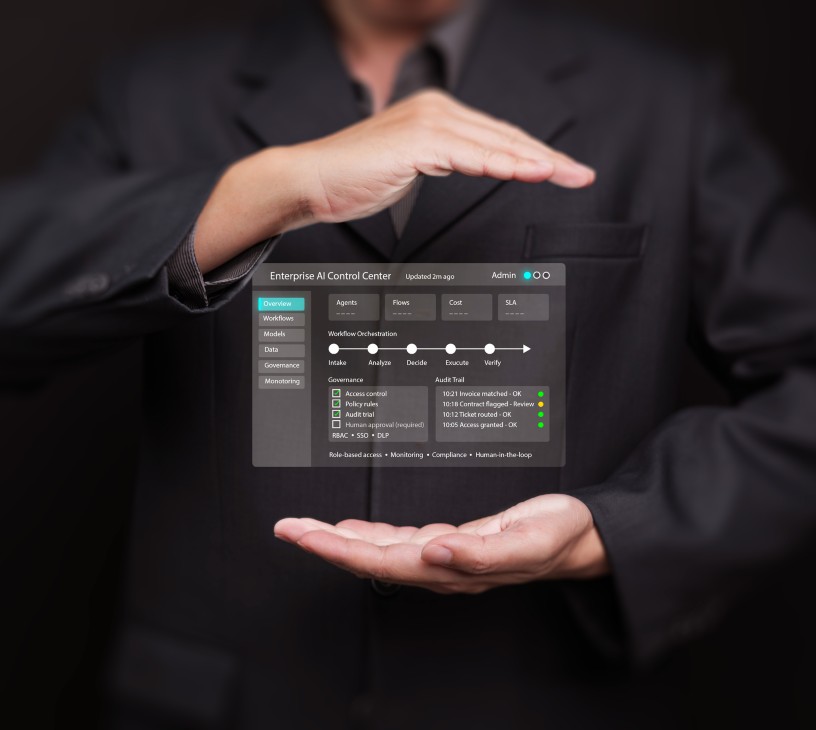
The enterprise prompt management platforms market is expanding as organizations move beyond experimental AI projects to production-grade deployments. This growth is driven by the need for robust generative AI governance to manage risks and ensure consistency. Effective LLM orchestration is critical for leveraging diverse models, while structured prompt lifecycle management ensures that instructional assets are optimized and versioned correctly. In a typical scenario, a financial services firm utilizes an AI model-agnostic platform to enforce compliance, using features like prompt injection defense to secure customer data. By implementing such platforms, firms can achieve significant LLM token cost optimization and maintain a defensible audit trail. With North America contributing over 36% of the market's incremental growth, the region's focus on technological adoption and regulatory adherence highlights the strategic importance of these management tools.

Drivers, Trends, and Challenges in the Enterprise Prompt Management Platforms Market

The strategic decision between adopting a formal prompt lifecycle management vs in-house tools is a central concern for C-level executives. While internal tools offer maximum customization, they often lack the sophisticated features needed for managing prompt drift in production environments and securing LLM prompts against data leakage, which are critical compliance points under the EU AI Act.

For instance, a global marketing agency implementing multimodal prompt management for image generation can reduce its creative cycle time by a significant margin compared to manual methods. This efficiency is paramount in sectors where speed and brand consistency are competitive differentiators.

The increasing complexity of enterprise prompt management for financial services, where regulatory scrutiny is intense, makes third-party platforms a more viable option. These platforms provide a structured approach to governance, helping organizations avoid the high costs and risks associated with developing and maintaining proprietary systems in a rapidly evolving technological landscape.

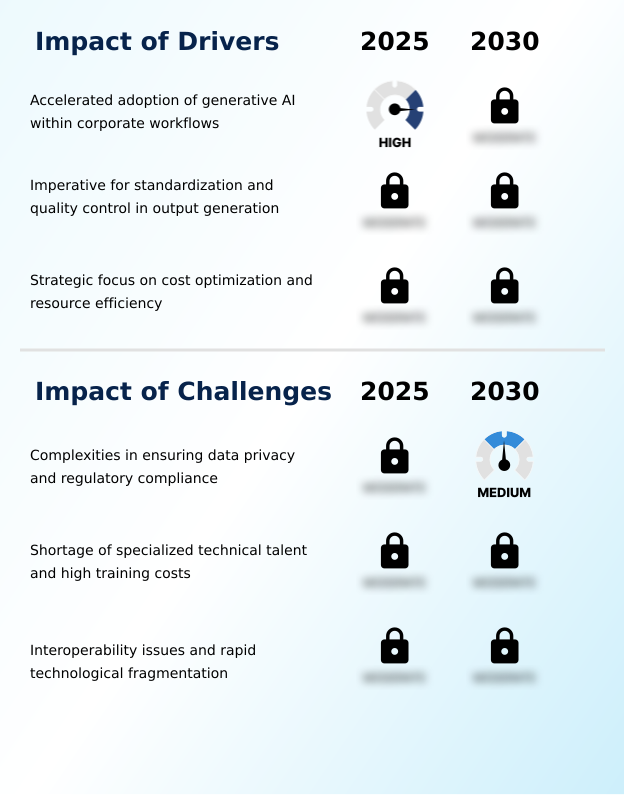
Primary Growth Driver: The accelerated adoption of generative AI within corporate workflows is the primary driver for the expansion of the enterprise prompt management platforms market.

The primary driver for market expansion is the strategic imperative for standardization and quality control as organizations scale their generative AI workflows. With a year-over-year growth of 29.6%, the demand is clear.

A unified prompt repository becomes essential to prevent fragmented, inconsistent outputs across an enterprise. These platforms provide a structured prompt engineering workflow, allowing for collaborative development and refinement.

Furthermore, the strategic focus on LLM token cost optimization is a powerful financial incentive.

By refining prompts to be more concise and effective within a managed platform, large enterprises that process millions of queries daily can realize substantial cost savings, proving the tangible ROI of their AI investments.

Emerging Market Trend: A transition toward structured prompt governance and enterprise-wide standardization frameworks is underway. This shift addresses the need for consistency and control as AI is integrated into core business operations.

The market is moving toward structured, operational methodologies, most notably the rise of PromptOps, which applies DevOps principles to the management of AI instructions. This trend involves creating dynamic, collaborative environments for prompt governance where teams can utilize sophisticated version control and A/B testing for prompts.

The expansion to include multimodal prompt support is also critical, as enterprises now work with models handling images, video, and audio, not just text. This requires platforms that offer cross-model compatibility and can manage complex prompt chain orchestration.

This shift signifies a maturation from simple prompt storage to a comprehensive lifecycle management approach that ensures quality, consistency, and adaptability in a multi-model AI ecosystem.

Key Industry Challenge: Complexities in ensuring data privacy and navigating stringent regulatory compliance frameworks present a key challenge affecting industry growth.

A significant challenge is the complex landscape of data privacy and regulatory compliance, particularly under frameworks like the GDPR. Enterprises must ensure that platforms offer robust features for data anonymization in prompts and are capable of securing LLM prompts against data leakage.

Another major hurdle is the industry-wide talent shortage of specialists who can navigate both the creative and technical aspects of prompt engineering. This is compounded by interoperability issues, as the market is fragmented with numerous AI models.

The phenomenon of model drift requires constant vigilance, and without standardized protocols, maintaining a prompt library that performs consistently across different models remains a formidable technical and operational challenge.

Explore Full Market Dynamics Analysis Request Free Sample

Enterprise Prompt Management Platforms Market Segmentation

The enterprise prompt management platforms industry research report provides comprehensive data including region-wise segment analysis, with forecasts and analysis for the period 2026-2030, as well as historical data from 2020-2024 for the following segments.

Market Segment by Deployment
  • Cloud-based
  • On-premises
  • Hybrid
Market Segment by End-user
  • Large enterprises
  • Small and medium enterprises
Market Segment by Application
  • Prompt lifecycle management
  • AI model orchestration and integration
  • Analytics and optimization
  • Security and compliance management
Market Segment by Geography
North America
US, Canada, Mexico
Europe
Germany, UK, France, The Netherlands, Italy, Spain
APAC
China, India, Japan, South Korea, Australia, Indonesia
Middle East and Africa
Saudi Arabia, UAE, South Africa, Israel, Turkey
South America
Brazil, Argentina, Colombia

Deployment Segment Analysis

The cloud-based segment is estimated to witness significant growth during the forecast period.

Cloud-based deployment models are the primary choice for enterprises, reflecting the need for scalable and flexible AI infrastructure. These platforms facilitate seamless updates and real-time collaborative prompt development, allowing globally distributed teams to work within a unified environment.

The cloud model simplifies the delegation of maintenance and security, enabling organizations to scale generative AI initiatives without significant upfront capital expenditure on hardware.

An AI model-agnostic platform architecture is crucial, providing LLM orchestration capabilities that are essential for avoiding vendor lock-in.

Essential features include robust role-based access control (RBAC) for prompts and a comprehensive AI gateway control plane for prompt performance monitoring, which are critical for managing large-scale, secure AI operations in a cloud-native context.

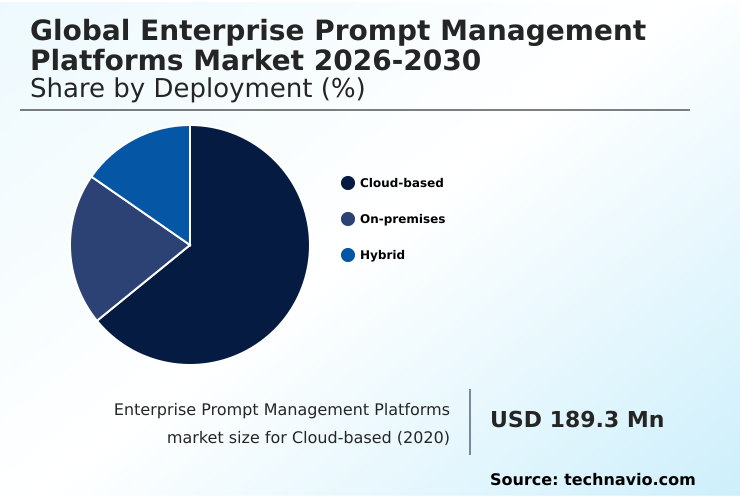
The Cloud-based segment was valued at USD 402.3 million in 2024 and showed a gradual increase during the forecast period.

Enterprise Prompt Management Platforms Market by Region: North America Leads with 36.1% Growth Share

North America is estimated to contribute 36.1% to the growth of the global market during the forecast period.

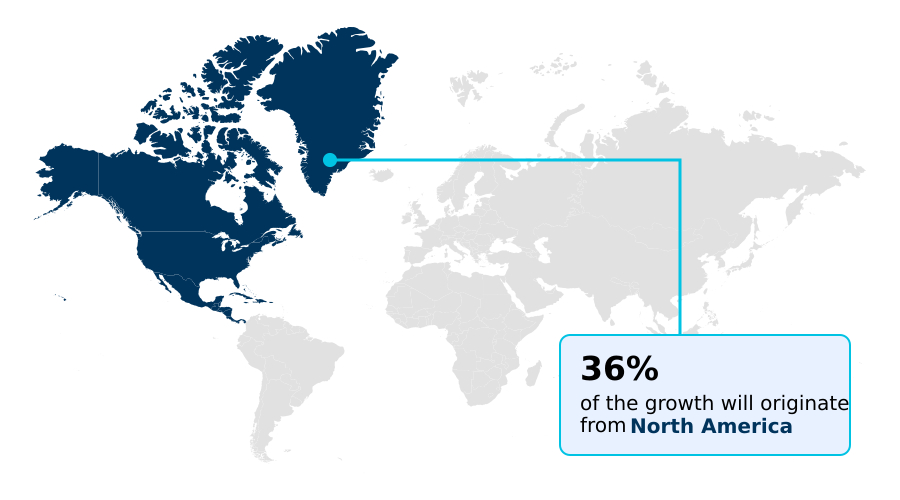
The geographic landscape of the enterprise prompt management platforms market is diverse, with North America holding a dominant share while APAC is set to grow at the fastest rate of 34.3%.

In Europe, the strict generative AI compliance demands of regulations like GDPR and the AI Act necessitate platforms with strong data anonymization in prompts and sovereign cloud capabilities.

North American adoption is driven by large enterprises seeking an AI model-agnostic platform to optimize workflows. In contrast, the APAC market, particularly in China, focuses on platforms compatible with local LLMs.

This regional fragmentation requires vendors to offer flexible solutions that support multimodal prompt support and sophisticated prompt-to-model routing to cater to varying regulatory and technological ecosystems.

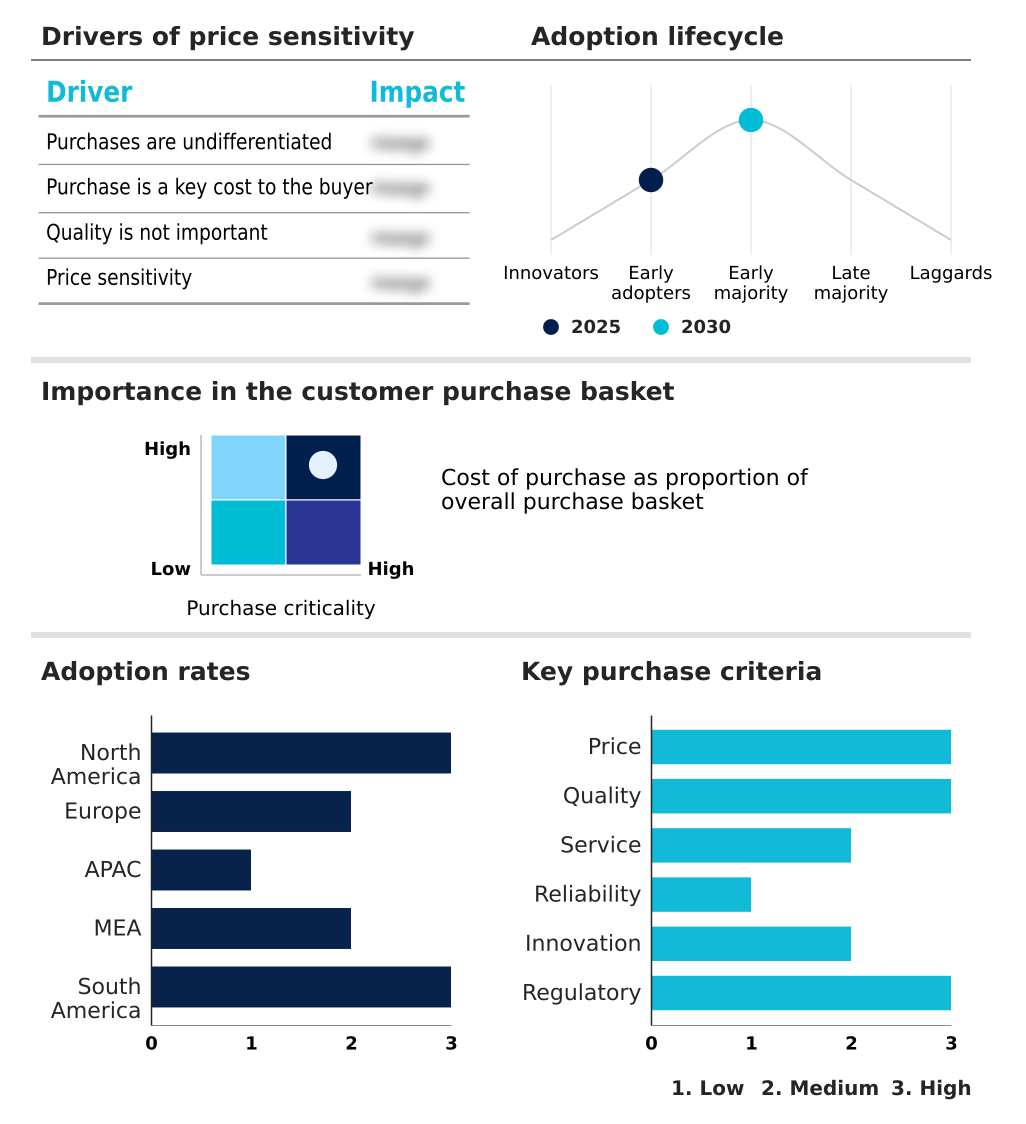
Customer Landscape Analysis for the Enterprise Prompt Management Platforms Market

The enterprise prompt management platforms market forecasting report includes the adoption lifecycle of the market, covering from the innovator’s stage to the laggard’s stage. It focuses on adoption rates in different regions based on penetration. Furthermore, the enterprise prompt management platforms market report also includes key purchase criteria and drivers of price sensitivity to help companies evaluate and develop their market growth analysis strategies.

Competitive Landscape of the Enterprise Prompt Management Platforms Market

Companies are implementing various strategies, such as strategic alliances, partnerships, mergers and acquisitions, geographical expansion, and product/service launches, to enhance their presence in the enterprise prompt management platforms market industry.

Agentatech UG - Offerings include an open-source LLM developer platform designed to streamline prompt engineering and model evaluation, enhancing AI application development and performance.

The industry research and growth report includes detailed analyses of the competitive landscape of the market and information about key companies, including:

  • Agentatech UG
  • Anthropic
  • Arize AI Inc.
  • Comet ML Inc.
  • Dataiku Inc.
  • Freeplay
  • Galileo
  • Helicone Inc.
  • HoneyHive
  • Humanloop Inc.
  • Klu Inc.
  • LangChain Inc.
  • OpenAI
  • Orq.ai
  • Portkey Inc.
  • PromptHub
  • PromptLayer Inc.
  • PromptlyDB
  • Vellum
  • Weights and Biases Inc.

Qualitative and quantitative analysis of companies has been conducted to help clients understand the wider business environment as well as the strengths and weaknesses of key industry players. Data is qualitatively analyzed to categorize companies as pure play, category-focused, industry-focused, and diversified; it is quantitatively analyzed to categorize companies as dominant, leading, strong, tentative, and weak.

Recent Developments in the Enterprise Prompt Management Platforms Market

  • In April 2025, Microsoft released an updated version of its Azure AI Studio, incorporating automated A/B testing functionalities to allow developers to compare prompt engineering iterations in real time.
  • In March 2025, JPMorgan Chase implemented a centralized prompt repository system across its global investment banking divisions to manage generative AI interactions and ensure uniform, secure instructions.
  • In February 2025, Salesforce launched its Prompt Builder Pro module, a significant update integrated directly with its CRM software to provide automated prompt versioning for sales teams.
  • In February 2025, Amazon Web Services launched an integrated prompt governance module within its Bedrock ecosystem to help corporate users manage and version their interactions with multiple proprietary models.

Research Analyst Overview: Enterprise Prompt Management Platforms Market

Boardroom decisions are increasingly centered on the build-versus-buy dilemma for AI infrastructure, with prompt lifecycle management at the core. The dominance of cloud-based deployments, accounting for a majority of the market, underscores a strategic shift toward scalable, managed solutions over bespoke internal systems.

Adherence to emerging standards, such as the ISO protocols for prompt management, is becoming a key vendor qualification criterion. Platforms offering robust generative AI governance, including AI audit trail logging and AI guardrails for prompts, are better positioned to meet enterprise needs.

Key technical capabilities like prompt drift detection and seamless LLM fine-tuning integration are no longer optional but essential for maintaining model performance and achieving LLM token cost optimization. This operational necessity makes a strong case for adopting specialized platforms that provide a clear framework for prompt version control and security.

Dive into Technavio’s robust research methodology, blending expert interviews, extensive data synthesis, and validated models for unparalleled Enterprise Prompt Management Platforms Market insights. See full methodology.

Request Free Sample

Market Scope
Page number 291
Base year 2025
Historic period 2020-2024
Forecast period 2026-2030
Growth momentum & CAGR Accelerate at a CAGR of 32.5%
Market growth 2026-2030 USD 2438.8 million
Market structure Fragmented
YoY growth 2025-2026(%) 29.6%
Key countries US, Canada, Mexico, Germany, UK, France, The Netherlands, Italy, Spain, China, India, Japan, South Korea, Australia, Indonesia, Saudi Arabia, UAE, South Africa, Israel, Turkey, Brazil, Argentina and Colombia
Competitive landscape Leading Companies, Market Positioning of Companies, Competitive Strategies, and Industry Risks

Enterprise Prompt Management Platforms Market: Key Questions Answered in This Report

  • What is the expected growth of the Enterprise Prompt Management Platforms Market between 2026 and 2030?

    • The Enterprise Prompt Management Platforms Market is expected to grow by USD 2.44 billion during 2026-2030, registering a CAGR of 32.5%. Year-over-year growth in 2026 is estimated at 29.6%%. This acceleration is shaped by accelerated adoption of generative ai within corporate workflows, which is intensifying demand across multiple end-use verticals covered in the report.

  • What segmentation does the market report cover?

    • The report is segmented by Deployment (Cloud-based, On-premises, and Hybrid), End-user (Large enterprises, and Small and medium enterprises), Application (Prompt lifecycle management, AI model orchestration and integration, Analytics and optimization, and Security and compliance management) and Geography (North America, Europe, APAC, Middle East and Africa, South America). Among these, the Cloud-based segment is estimated to witness significant growth during the forecast period, driven by rising adoption across key application areas. Each segment includes detailed qualitative and quantitative analysis, along with historical data from 2020-2024 and forecasts through 2030 with year-over-year growth rates.

  • Which regions are analyzed in the report?

    • The report covers North America, Europe, APAC, Middle East and Africa and South America. North America is estimated to contribute 36.1% to market growth during the forecast period. Country-level analysis includes US, Canada, Mexico, Germany, UK, France, The Netherlands, Italy, Spain, China, India, Japan, South Korea, Australia, Indonesia, Saudi Arabia, UAE, South Africa, Israel, Turkey, Brazil, Argentina and Colombia, with dedicated market size tables and year-over-year growth for each.

  • What are the key growth drivers and market challenges?

    • The primary driver is accelerated adoption of generative ai within corporate workflows, which is accelerating investment and industry demand. The main challenge is complexities in ensuring data privacy and regulatory compliance, creating operational barriers for key market participants. The report quantifies the impact of each driver and challenge across 2026 and 2030 with comparative analysis.

  • Who are the major players in the Enterprise Prompt Management Platforms Market?

    • Key vendors include Agentatech UG, Anthropic, Arize AI Inc., Comet ML Inc., Dataiku Inc., Freeplay, Galileo, Helicone Inc., HoneyHive, Humanloop Inc., Klu Inc., LangChain Inc., OpenAI, Orq.ai, Portkey Inc., PromptHub, PromptLayer Inc., PromptlyDB, Vellum and Weights and Biases Inc.. The report provides qualitative and quantitative analysis categorizing companies as dominant, leading, strong, tentative, and weak based on their market positioning. Company profiles include business segment analysis, SWOT assessment, key offerings, and recent strategic developments.

Enterprise Prompt Management Platforms Market Research Insights

The market dynamics are increasingly shaped by the operational need for verifiable generative AI compliance, particularly under frameworks like the GDPR. Large enterprises are adopting a PromptOps methodology to manage instructions within a centralized prompt library, ensuring consistency and enabling comprehensive AI audit trail logging.

This structured approach, which includes capabilities for production prompt debugging and cross-model prompt compatibility, allows organizations to scale AI use responsibly. The disparity in adoption between large enterprises and SMEs is notable, with larger firms leveraging these platforms to standardize outputs and mitigate risks, while smaller firms focus on more accessible, cost-effective solutions.

We can help! Our analysts can customize this enterprise prompt management platforms market research report to meet your requirements.

Get in touch

1. Executive Summary

1.1 Market overview

Executive Summary - Chart on Market Overview
Executive Summary - Data Table on Market Overview
Executive Summary - Chart on Global Market Characteristics
Executive Summary - Chart on Market by Geography
Executive Summary - Chart on Market Segmentation by Deployment
Executive Summary - Chart on Market Segmentation by End-user
Executive Summary - Chart on Market Segmentation by Application
Executive Summary - Chart on Incremental Growth
Executive Summary - Data Table on Incremental Growth
Executive Summary - Chart on Company Market Positioning

2. Technavio Analysis

2.1 Analysis of price sensitivity, lifecycle, customer purchase basket, adoption rates, and purchase criteria

2.2 Criticality of inputs and Factors of differentiation

Chart on Overview on criticality of inputs and factors of differentiation

2.3 Factors of disruption

Chart on Overview on factors of disruption

2.4 Impact of drivers and challenges

Chart on Impact of drivers and challenges in 2025 and 2030

3. Market Landscape

3.1 Market ecosystem

Chart on Parent Market
Data Table on - Parent Market

3.2 Market characteristics

Chart on Market characteristics analysis

3.3 Value chain analysis

Chart on Value chain analysis

4. Market Sizing

4.1 Market definition

Data Table on Offerings of companies included in the market definition

4.2 Market segment analysis

Market segments

4.3 Market size 2025

4.4 Market outlook: Forecast for 2025-2030

Chart on Global - Market size and forecast 2025-2030 ($ million)
Data Table on Global - Market size and forecast 2025-2030 ($ million)
Chart on Global Market: Year-over-year growth 2025-2030 (%)
Data Table on Global Market: Year-over-year growth 2025-2030 (%)

5. Historic Market Size

5.1 Global Enterprise Prompt Management Platforms Market 2020 - 2024

Historic Market Size - Data Table on Global Enterprise Prompt Management Platforms Market 2020 - 2024 ($ million)

5.2 Deployment segment analysis 2020 - 2024

Historic Market Size - Deployment Segment 2020 - 2024 ($ million)

5.3 End-user segment analysis 2020 - 2024

Historic Market Size - End-user Segment 2020 - 2024 ($ million)

5.4 Application segment analysis 2020 - 2024

Historic Market Size - Application Segment 2020 - 2024 ($ million)

5.5 Geography segment analysis 2020 - 2024

Historic Market Size - Geography Segment 2020 - 2024 ($ million)

5.6 Country segment analysis 2020 - 2024

Historic Market Size - Country Segment 2020 - 2024 ($ million)

6. Qualitative Analysis

6.1 Impact of AI on Global Enterprise Prompt Management Platforms Market

7. Five Forces Analysis

7.1 Five forces summary

Five forces analysis - Comparison between 2025 and 2030

7.2 Bargaining power of buyers

Bargaining power of buyers - Impact of key factors 2025 and 2030

7.3 Bargaining power of suppliers

Bargaining power of suppliers - Impact of key factors in 2025 and 2030

7.4 Threat of new entrants

Threat of new entrants - Impact of key factors in 2025 and 2030

7.5 Threat of substitutes

Threat of substitutes - Impact of key factors in 2025 and 2030

7.6 Threat of rivalry

Threat of rivalry - Impact of key factors in 2025 and 2030

7.7 Market condition

Chart on Market condition - Five forces 2025 and 2030

8. Market Segmentation by Deployment

8.1 Market segments

Chart on Deployment - Market share 2025-2030 (%)
Data Table on Deployment - Market share 2025-2030 (%)

8.2 Comparison by Deployment

Chart on Comparison by Deployment
Data Table on Comparison by Deployment

8.3 Cloud-based - Market size and forecast 2025-2030

Chart on Cloud-based - Market size and forecast 2025-2030 ($ million)
Data Table on Cloud-based - Market size and forecast 2025-2030 ($ million)
Chart on Cloud-based - Year-over-year growth 2025-2030 (%)
Data Table on Cloud-based - Year-over-year growth 2025-2030 (%)

8.4 On-premises - Market size and forecast 2025-2030

Chart on On-premises - Market size and forecast 2025-2030 ($ million)
Data Table on On-premises - Market size and forecast 2025-2030 ($ million)
Chart on On-premises - Year-over-year growth 2025-2030 (%)
Data Table on On-premises - Year-over-year growth 2025-2030 (%)

8.5 Hybrid - Market size and forecast 2025-2030

Chart on Hybrid - Market size and forecast 2025-2030 ($ million)
Data Table on Hybrid - Market size and forecast 2025-2030 ($ million)
Chart on Hybrid - Year-over-year growth 2025-2030 (%)
Data Table on Hybrid - Year-over-year growth 2025-2030 (%)

8.6 Market opportunity by Deployment

Market opportunity by Deployment ($ million)
Data Table on Market opportunity by Deployment ($ million)

9. Market Segmentation by End-user

9.1 Market segments

Chart on End-user - Market share 2025-2030 (%)
Data Table on End-user - Market share 2025-2030 (%)

9.2 Comparison by End-user

Chart on Comparison by End-user
Data Table on Comparison by End-user

9.3 Large enterprises - Market size and forecast 2025-2030

Chart on Large enterprises - Market size and forecast 2025-2030 ($ million)
Data Table on Large enterprises - Market size and forecast 2025-2030 ($ million)
Chart on Large enterprises - Year-over-year growth 2025-2030 (%)
Data Table on Large enterprises - Year-over-year growth 2025-2030 (%)

9.4 Small and medium enterprises - Market size and forecast 2025-2030

Chart on Small and medium enterprises - Market size and forecast 2025-2030 ($ million)
Data Table on Small and medium enterprises - Market size and forecast 2025-2030 ($ million)
Chart on Small and medium enterprises - Year-over-year growth 2025-2030 (%)
Data Table on Small and medium enterprises - Year-over-year growth 2025-2030 (%)

9.5 Market opportunity by End-user

Market opportunity by End-user ($ million)
Data Table on Market opportunity by End-user ($ million)

10. Market Segmentation by Application

10.1 Market segments

Chart on Application - Market share 2025-2030 (%)
Data Table on Application - Market share 2025-2030 (%)

10.2 Comparison by Application

Chart on Comparison by Application
Data Table on Comparison by Application

10.3 Prompt lifecycle management - Market size and forecast 2025-2030

Chart on Prompt lifecycle management - Market size and forecast 2025-2030 ($ million)
Data Table on Prompt lifecycle management - Market size and forecast 2025-2030 ($ million)
Chart on Prompt lifecycle management - Year-over-year growth 2025-2030 (%)
Data Table on Prompt lifecycle management - Year-over-year growth 2025-2030 (%)

10.4 AI model orchestration and integration - Market size and forecast 2025-2030

Chart on AI model orchestration and integration - Market size and forecast 2025-2030 ($ million)
Data Table on AI model orchestration and integration - Market size and forecast 2025-2030 ($ million)
Chart on AI model orchestration and integration - Year-over-year growth 2025-2030 (%)
Data Table on AI model orchestration and integration - Year-over-year growth 2025-2030 (%)

10.5 Analytics and optimization - Market size and forecast 2025-2030

Chart on Analytics and optimization - Market size and forecast 2025-2030 ($ million)
Data Table on Analytics and optimization - Market size and forecast 2025-2030 ($ million)
Chart on Analytics and optimization - Year-over-year growth 2025-2030 (%)
Data Table on Analytics and optimization - Year-over-year growth 2025-2030 (%)

10.6 Security and compliance management - Market size and forecast 2025-2030

Chart on Security and compliance management - Market size and forecast 2025-2030 ($ million)
Data Table on Security and compliance management - Market size and forecast 2025-2030 ($ million)
Chart on Security and compliance management - Year-over-year growth 2025-2030 (%)
Data Table on Security and compliance management - Year-over-year growth 2025-2030 (%)

10.7 Market opportunity by Application

Market opportunity by Application ($ million)
Data Table on Market opportunity by Application ($ million)

11. Customer Landscape

11.1 Customer landscape overview

Analysis of price sensitivity, lifecycle, customer purchase basket, adoption rates, and purchase criteria

12. Geographic Landscape

12.1 Geographic segmentation

Chart on Market share by geography 2025-2030 (%)
Data Table on Market share by geography 2025-2030 (%)

12.2 Geographic comparison

Chart on Geographic comparison
Data Table on Geographic comparison

12.3 North America - Market size and forecast 2025-2030

Chart on North America - Market size and forecast 2025-2030 ($ million)
Data Table on North America - Market size and forecast 2025-2030 ($ million)
Chart on North America - Year-over-year growth 2025-2030 (%)
Data Table on North America - Year-over-year growth 2025-2030 (%)
Chart on Regional Comparison - North America
Data Table on Regional Comparison - North America

12.3.1 US - Market size and forecast 2025-2030

Chart on US - Market size and forecast 2025-2030 ($ million)
Data Table on US - Market size and forecast 2025-2030 ($ million)
Chart on US - Year-over-year growth 2025-2030 (%)
Data Table on US - Year-over-year growth 2025-2030 (%)

12.3.2 Canada - Market size and forecast 2025-2030

Chart on Canada - Market size and forecast 2025-2030 ($ million)
Data Table on Canada - Market size and forecast 2025-2030 ($ million)
Chart on Canada - Year-over-year growth 2025-2030 (%)
Data Table on Canada - Year-over-year growth 2025-2030 (%)

12.3.3 Mexico - Market size and forecast 2025-2030

Chart on Mexico - Market size and forecast 2025-2030 ($ million)
Data Table on Mexico - Market size and forecast 2025-2030 ($ million)
Chart on Mexico - Year-over-year growth 2025-2030 (%)
Data Table on Mexico - Year-over-year growth 2025-2030 (%)

12.4 Europe - Market size and forecast 2025-2030

Chart on Europe - Market size and forecast 2025-2030 ($ million)
Data Table on Europe - Market size and forecast 2025-2030 ($ million)
Chart on Europe - Year-over-year growth 2025-2030 (%)
Data Table on Europe - Year-over-year growth 2025-2030 (%)
Chart on Regional Comparison - Europe
Data Table on Regional Comparison - Europe

12.4.1 Germany - Market size and forecast 2025-2030

Chart on Germany - Market size and forecast 2025-2030 ($ million)
Data Table on Germany - Market size and forecast 2025-2030 ($ million)
Chart on Germany - Year-over-year growth 2025-2030 (%)
Data Table on Germany - Year-over-year growth 2025-2030 (%)

12.4.2 UK - Market size and forecast 2025-2030

Chart on UK - Market size and forecast 2025-2030 ($ million)
Data Table on UK - Market size and forecast 2025-2030 ($ million)
Chart on UK - Year-over-year growth 2025-2030 (%)
Data Table on UK - Year-over-year growth 2025-2030 (%)

12.4.3 France - Market size and forecast 2025-2030

Chart on France - Market size and forecast 2025-2030 ($ million)
Data Table on France - Market size and forecast 2025-2030 ($ million)
Chart on France - Year-over-year growth 2025-2030 (%)
Data Table on France - Year-over-year growth 2025-2030 (%)

12.4.4 The Netherlands - Market size and forecast 2025-2030

Chart on The Netherlands - Market size and forecast 2025-2030 ($ million)
Data Table on The Netherlands - Market size and forecast 2025-2030 ($ million)
Chart on The Netherlands - Year-over-year growth 2025-2030 (%)
Data Table on The Netherlands - Year-over-year growth 2025-2030 (%)

12.4.5 Italy - Market size and forecast 2025-2030

Chart on Italy - Market size and forecast 2025-2030 ($ million)
Data Table on Italy - Market size and forecast 2025-2030 ($ million)
Chart on Italy - Year-over-year growth 2025-2030 (%)
Data Table on Italy - Year-over-year growth 2025-2030 (%)

12.4.6 Spain - Market size and forecast 2025-2030

Chart on Spain - Market size and forecast 2025-2030 ($ million)
Data Table on Spain - Market size and forecast 2025-2030 ($ million)
Chart on Spain - Year-over-year growth 2025-2030 (%)
Data Table on Spain - Year-over-year growth 2025-2030 (%)

12.5 APAC - Market size and forecast 2025-2030

Chart on APAC - Market size and forecast 2025-2030 ($ million)
Data Table on APAC - Market size and forecast 2025-2030 ($ million)
Chart on APAC - Year-over-year growth 2025-2030 (%)
Data Table on APAC - Year-over-year growth 2025-2030 (%)
Chart on Regional Comparison - APAC
Data Table on Regional Comparison - APAC

12.5.1 China - Market size and forecast 2025-2030

Chart on China - Market size and forecast 2025-2030 ($ million)
Data Table on China - Market size and forecast 2025-2030 ($ million)
Chart on China - Year-over-year growth 2025-2030 (%)
Data Table on China - Year-over-year growth 2025-2030 (%)

12.5.2 India - Market size and forecast 2025-2030

Chart on India - Market size and forecast 2025-2030 ($ million)
Data Table on India - Market size and forecast 2025-2030 ($ million)
Chart on India - Year-over-year growth 2025-2030 (%)
Data Table on India - Year-over-year growth 2025-2030 (%)

12.5.3 Japan - Market size and forecast 2025-2030

Chart on Japan - Market size and forecast 2025-2030 ($ million)
Data Table on Japan - Market size and forecast 2025-2030 ($ million)
Chart on Japan - Year-over-year growth 2025-2030 (%)
Data Table on Japan - Year-over-year growth 2025-2030 (%)

12.5.4 South Korea - Market size and forecast 2025-2030

Chart on South Korea - Market size and forecast 2025-2030 ($ million)
Data Table on South Korea - Market size and forecast 2025-2030 ($ million)
Chart on South Korea - Year-over-year growth 2025-2030 (%)
Data Table on South Korea - Year-over-year growth 2025-2030 (%)

12.5.5 Australia - Market size and forecast 2025-2030

Chart on Australia - Market size and forecast 2025-2030 ($ million)
Data Table on Australia - Market size and forecast 2025-2030 ($ million)
Chart on Australia - Year-over-year growth 2025-2030 (%)
Data Table on Australia - Year-over-year growth 2025-2030 (%)

12.5.6 Indonesia - Market size and forecast 2025-2030

Chart on Indonesia - Market size and forecast 2025-2030 ($ million)
Data Table on Indonesia - Market size and forecast 2025-2030 ($ million)
Chart on Indonesia - Year-over-year growth 2025-2030 (%)
Data Table on Indonesia - Year-over-year growth 2025-2030 (%)

12.6 Middle East and Africa - Market size and forecast 2025-2030

Chart on Middle East and Africa - Market size and forecast 2025-2030 ($ million)
Data Table on Middle East and Africa - Market size and forecast 2025-2030 ($ million)
Chart on Middle East and Africa - Year-over-year growth 2025-2030 (%)
Data Table on Middle East and Africa - Year-over-year growth 2025-2030 (%)
Chart on Regional Comparison - Middle East and Africa
Data Table on Regional Comparison - Middle East and Africa

12.6.1 Saudi Arabia - Market size and forecast 2025-2030

Chart on Saudi Arabia - Market size and forecast 2025-2030 ($ million)
Data Table on Saudi Arabia - Market size and forecast 2025-2030 ($ million)
Chart on Saudi Arabia - Year-over-year growth 2025-2030 (%)
Data Table on Saudi Arabia - Year-over-year growth 2025-2030 (%)

12.6.2 UAE - Market size and forecast 2025-2030

Chart on UAE - Market size and forecast 2025-2030 ($ million)
Data Table on UAE - Market size and forecast 2025-2030 ($ million)
Chart on UAE - Year-over-year growth 2025-2030 (%)
Data Table on UAE - Year-over-year growth 2025-2030 (%)

12.6.3 South Africa - Market size and forecast 2025-2030

Chart on South Africa - Market size and forecast 2025-2030 ($ million)
Data Table on South Africa - Market size and forecast 2025-2030 ($ million)
Chart on South Africa - Year-over-year growth 2025-2030 (%)
Data Table on South Africa - Year-over-year growth 2025-2030 (%)

12.6.4 Israel - Market size and forecast 2025-2030

Chart on Israel - Market size and forecast 2025-2030 ($ million)
Data Table on Israel - Market size and forecast 2025-2030 ($ million)
Chart on Israel - Year-over-year growth 2025-2030 (%)
Data Table on Israel - Year-over-year growth 2025-2030 (%)

12.6.5 Turkey - Market size and forecast 2025-2030

Chart on Turkey - Market size and forecast 2025-2030 ($ million)
Data Table on Turkey - Market size and forecast 2025-2030 ($ million)
Chart on Turkey - Year-over-year growth 2025-2030 (%)
Data Table on Turkey - Year-over-year growth 2025-2030 (%)

12.7 South America - Market size and forecast 2025-2030

Chart on South America - Market size and forecast 2025-2030 ($ million)
Data Table on South America - Market size and forecast 2025-2030 ($ million)
Chart on South America - Year-over-year growth 2025-2030 (%)
Data Table on South America - Year-over-year growth 2025-2030 (%)
Chart on Regional Comparison - South America
Data Table on Regional Comparison - South America

12.7.1 Brazil - Market size and forecast 2025-2030

Chart on Brazil - Market size and forecast 2025-2030 ($ million)
Data Table on Brazil - Market size and forecast 2025-2030 ($ million)
Chart on Brazil - Year-over-year growth 2025-2030 (%)
Data Table on Brazil - Year-over-year growth 2025-2030 (%)

12.7.2 Argentina - Market size and forecast 2025-2030

Chart on Argentina - Market size and forecast 2025-2030 ($ million)
Data Table on Argentina - Market size and forecast 2025-2030 ($ million)
Chart on Argentina - Year-over-year growth 2025-2030 (%)
Data Table on Argentina - Year-over-year growth 2025-2030 (%)

12.7.3 Colombia - Market size and forecast 2025-2030

Chart on Colombia - Market size and forecast 2025-2030 ($ million)
Data Table on Colombia - Market size and forecast 2025-2030 ($ million)
Chart on Colombia - Year-over-year growth 2025-2030 (%)
Data Table on Colombia - Year-over-year growth 2025-2030 (%)

12.8 Market opportunity by geography

Market opportunity by geography ($ million)
Data Tables on Market opportunity by geography ($ million)

13. Drivers, Challenges, and Opportunity

13.1 Market drivers

Accelerated adoption of generative AI within corporate workflows
Imperative for standardization and quality control in output generation
Strategic focus on cost optimization and resource efficiency

13.2 Market challenges

Complexities in ensuring data privacy and regulatory compliance
Shortage of specialized technical talent and high training costs
Interoperability issues and rapid technological fragmentation

13.3 Impact of drivers and challenges

Impact of drivers and challenges in 2025 and 2030

13.4 Market opportunities

Transition toward prompt governance and enterprise standardization
Emergence of PromptOps and collaborative lifecycle management
Integration of multimodal and cross-model compatibility layers

14. Competitive Landscape

14.1 Overview

14.2

Overview on criticality of inputs and factors of differentiation

14.3 Landscape disruption

Overview on factors of disruption

14.4 Industry risks

Impact of key risks on business

15. Competitive Analysis

15.1 Companies profiled

Companies covered

15.2 Company ranking index

15.3 Market positioning of companies

Matrix on companies position and classification

15.4 Agentatech UG

Agentatech UG - Overview
Agentatech UG - Product / Service
Agentatech UG - Key offerings
SWOT

15.5 Arize AI Inc.

Arize AI Inc. - Overview
Arize AI Inc. - Product / Service
Arize AI Inc. - Key offerings
SWOT

15.6 Dataiku Inc.

Dataiku Inc. - Overview
Dataiku Inc. - Product / Service
Dataiku Inc. - Key offerings
SWOT

15.7 Freeplay

Freeplay - Overview
Freeplay - Product / Service
Freeplay - Key offerings
SWOT

15.8 Galileo

Galileo - Overview
Galileo - Product / Service
Galileo - Key offerings
SWOT

15.9 Helicone Inc.

Helicone Inc. - Overview
Helicone Inc. - Product / Service
Helicone Inc. - Key offerings
SWOT

15.10 HoneyHive

HoneyHive - Overview
HoneyHive - Product / Service
HoneyHive - Key offerings
SWOT

15.11 Humanloop Inc.

Humanloop Inc. - Overview
Humanloop Inc. - Product / Service
Humanloop Inc. - Key offerings
SWOT

15.12 LangChain Inc.

LangChain Inc. - Overview
LangChain Inc. - Product / Service
LangChain Inc. - Key offerings
SWOT

15.13 OpenAI

OpenAI - Overview
OpenAI - Product / Service
OpenAI - Key offerings
SWOT

15.14 Orq.ai

Orq.ai - Overview
Orq.ai - Product / Service
Orq.ai - Key offerings
SWOT

15.15 Portkey Inc.

Portkey Inc. - Overview
Portkey Inc. - Product / Service
Portkey Inc. - Key offerings
SWOT

15.16 PromptLayer Inc.

PromptLayer Inc. - Overview
PromptLayer Inc. - Product / Service
PromptLayer Inc. - Key offerings
SWOT

15.17 Vellum

Vellum - Overview
Vellum - Product / Service
Vellum - Key offerings
SWOT

15.18 Weights and Biases Inc.

Weights and Biases Inc. - Overview
Weights and Biases Inc. - Product / Service
Weights and Biases Inc. - Key offerings
SWOT

16. Appendix

16.1 Scope of the report

Market definition
Objectives
Notes and caveats

16.2 Inclusions and exclusions checklist

Inclusions checklist
Exclusions checklist

16.3 Currency conversion rates for US$

16.4 Research methodology

16.5 Data procurement

Information sources

16.6 Data validation

16.7 Validation techniques employed for market sizing

16.8 Data synthesis

16.9 360 degree market analysis

16.10 List of abbreviations

Research Methodology

Technavio presents a detailed picture of the market by way of study, synthesis, and summation of data from multiple sources. The analysts have presented the various facets of the market with a particular focus on identifying the key industry influencers. The data thus presented is comprehensive, reliable, and the result of extensive research, both primary and secondary.

INFORMATION SOURCES

Primary sources

  • Manufacturers and suppliers
  • Channel partners
  • Industry experts
  • Strategic decision makers

Secondary sources

  • Industry journals and periodicals
  • Government data
  • Financial reports of key industry players
  • Historical data
  • Press releases

DATA ANALYSIS

Data Synthesis

  • Collation of data
  • Estimation of key figures
  • Analysis of derived insights

Data Validation

  • Triangulation with data models
  • Reference against proprietary databases
  • Corroboration with industry experts

REPORT WRITING

Qualitative

  • Market drivers
  • Market challenges
  • Market trends
  • Five forces analysis

Quantitative

  • Market size and forecast
  • Market segmentation
  • Geographical insights
  • Competitive landscape

Interested in this report?

Get your sample now to see our research methodology and insights!

Download Now

Frequently Asked Questions

Enterprise Prompt Management Platforms market growth will increase by USD 2438.8 million during 2026-2030.

The Enterprise Prompt Management Platforms market is expected to grow at a CAGR of 32.5% during 2026-2030.

Enterprise Prompt Management Platforms market is segmented by Deployment (Cloud-based, On-premises, Hybrid) End-user (Large enterprises, Small and medium enterprises) Application (Prompt lifecycle management, AI model orchestration and integration, Analytics and optimization, Security and compliance management)

Agentatech UG, Anthropic, Arize AI Inc., Comet ML Inc., Dataiku Inc., Freeplay, Galileo, Helicone Inc., HoneyHive, Humanloop Inc., Klu Inc., LangChain Inc., OpenAI, Orq.ai, Portkey Inc., PromptHub, PromptLayer Inc., PromptlyDB, Vellum, Weights and Biases Inc. are a few of the key vendors in the Enterprise Prompt Management Platforms market.

North America will register the highest growth rate of 36.1% among the other regions. Therefore, the Enterprise Prompt Management Platforms market in North America is expected to garner significant business opportunities for the vendors during the forecast period.

US, Canada, Mexico, Germany, UK, France, The Netherlands, Italy, Spain, China, India, Japan, South Korea, Australia, Indonesia, Saudi Arabia, UAE, South Africa, Israel, Turkey, Brazil, Argentina, Colombia

  • Accelerated adoption of generative AI within corporate workflows is the driving factor this market.

The Enterprise Prompt Management Platforms market vendors should focus on grabbing business opportunities from the Deployment segment as it accounted for the largest market share in the base year.
RIA - Research AI Assistant
Ask RIA