Experiential Retail Market Size and Growth Forecast 2026-2030
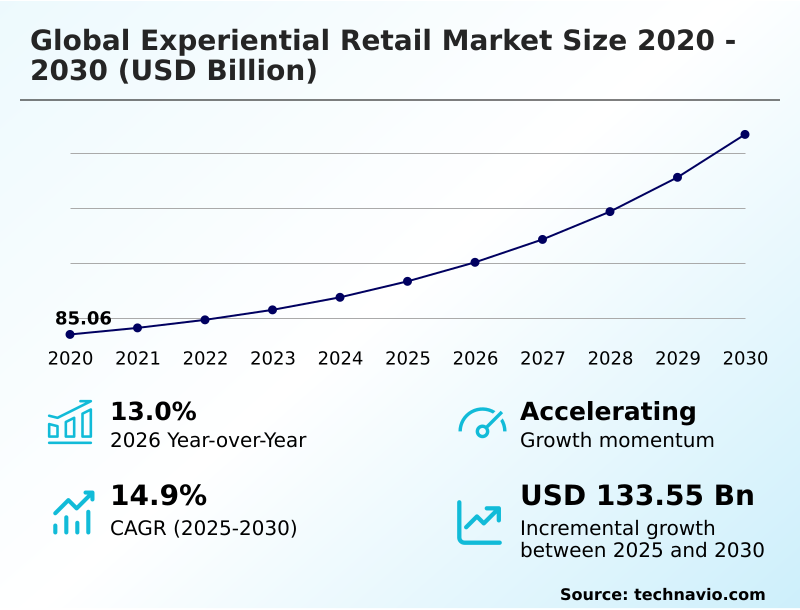
The Experiential Retail Market size was valued at USD 133.33 billion in 2025 growing at a CAGR of 14.9% during the forecast period 2026-2030.
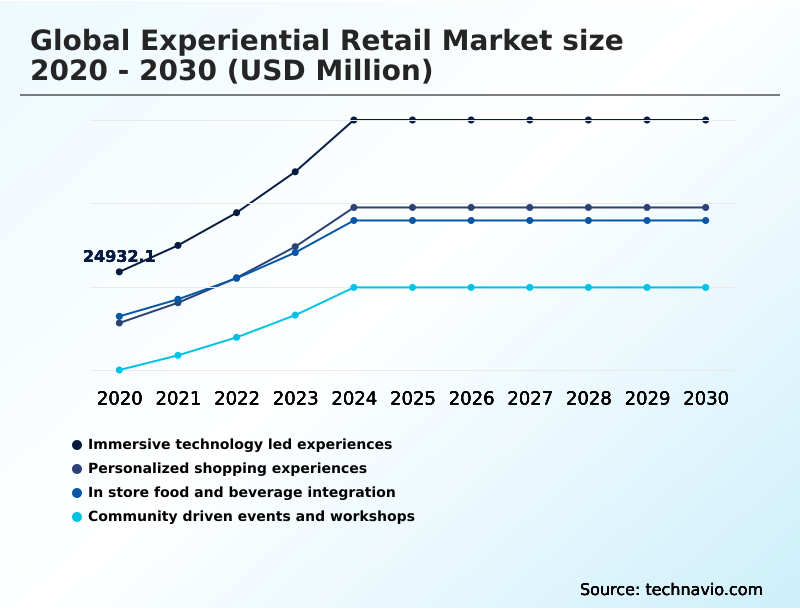
North America accounts for 31.1% of incremental growth during the forecast period. The Immersive technology led experiences segment by Type was valued at USD 36.43 billion in 2024, while the Fashion and apparel segment holds the largest revenue share by End-user.
The market is projected to grow by USD 181.82 billion from 2020 to 2030, with USD 133.55 billion of the growth expected during the forecast period of 2025 to 2030.
Get Key Insights on Market Forecast (PDF) Request Free Sample
Experiential Retail Market Overview
The experiential retail market is defined by a fundamental pivot from transactional selling to creating memorable brand interactions, reflecting a year-over-year growth of 13.0%. This evolution is driven by consumer demand for engaging, sensory-rich environments that digital-only platforms cannot replicate. Key industry verticals are leveraging this experiential retail strategy to transform physical stores into dynamic hubs for brand storytelling installations. North America continues to hold a significant share of this transformation, contributing over 31% to the incremental growth. A prime operational scenario involves a fashion retailer implementing smart fitting room technology integrated with an in-store personalization engine. This system uses computer vision for analytics to recognize garments, suggests complementary items on an interactive digital display, and allows shoppers to request different sizes without leaving the room. The result is a frictionless checkout system that not only elevates the customer journey mapping but also provides valuable predictive customer analytics to inform inventory and design decisions, directly impacting customer lifetime value modeling.
Drivers, Trends, and Challenges in the Experiential Retail Market
Successfully executing an experiential retail strategy hinges on addressing several complex operational challenges. The foremost is measuring the ROI of experiential retail, as traditional metrics like sales-per-square-foot fail to capture the value of brand engagement and social media amplification. This necessitates sophisticated customer lifetime value modeling.
Consequently, capital expenditure planning for retail tech upgrades requires a long-term view that factors in these intangible benefits. A critical operational scenario involves integrating digital twins for store operations optimization.
A large-format retailer can use a digital twin to simulate customer flow, test new layouts with an augmented reality storefront, and train staff in a virtual reality showroom before committing to costly physical changes. This process, however, is complicated by the need to overcome data privacy challenges in personalized retail.
Compliance with frameworks like the GDPR in Europe is non-negotiable, requiring investment in privacy-preserving analytics and transparent customer data platform governance. The cost of non-compliance, with potential fines reaching a significant percentage of global turnover, makes this a boardroom-level concern, directly impacting technology adoption decisions.
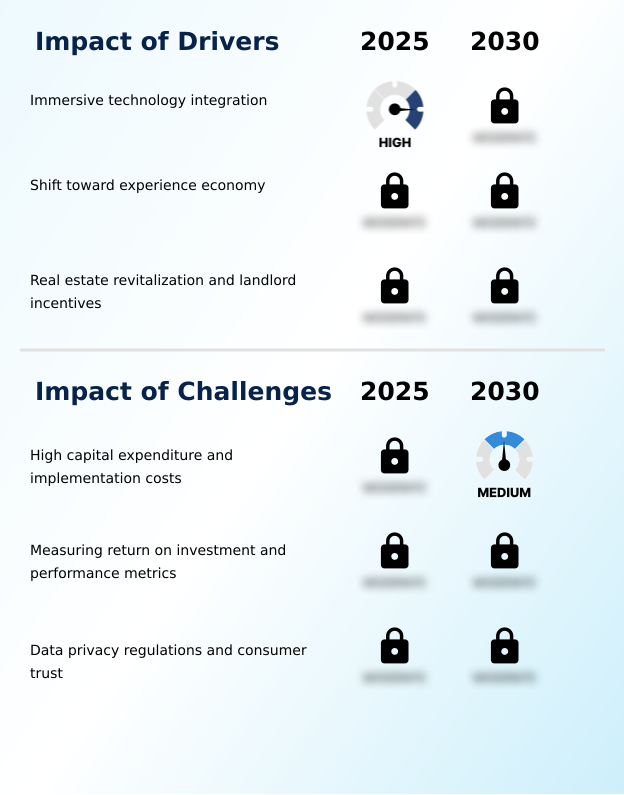
Primary Growth Driver: The integration of immersive technologies, such as augmented reality and virtual reality, serves as a key driver for market growth by creating engaging and interactive customer experiences.
The primary driver for the market is the imperative to create memorable, shareable moments that online-only retail cannot replicate. This is achieved through immersive technology integration, particularly with augmented reality try-on and spatial computing in retail.
These technologies allow for dynamic, interactive product demonstrations that captivate consumers and increase dwell time. The convergence of physical and digital realms is further enabled by seamless omnichannel retail integration, which ensures a consistent brand experience across all touchpoints.
Brands are heavily investing in retailtainment concepts and elaborate brand storytelling installations to transform their stores into destinations.
This strategy not only drives foot traffic but also encourages user-generated content, providing powerful organic marketing and solidifying brand loyalty in a competitive landscape.
Emerging Market Trend: Hyper-personalization, driven by advanced data analytics and artificial intelligence, is a primary trend influencing the market. It signals a shift from static retail layouts to dynamic, responsive environments tailored to individual consumers.
The trend toward hyper-personalization is redefining physical retail, transforming stores from static transaction points into intelligent ecosystems. By leveraging predictive customer analytics and hyper-personalization engines, retailers create phygital retail experiences that adapt in real time to shopper behavior. This approach is often integrated within a community hub retail model, where stores host localized events.
For instance, a brand might use geofencing marketing to invite nearby loyalty members to an exclusive in-store workshop. The move toward sustainable experiential store design also gains traction, appealing to ethically-minded consumers.
Adherence to data privacy standards like the CCPA is critical, as these personalized experiences rely on collecting consumer data, making transparent consent and robust data governance paramount for maintaining customer trust.
Key Industry Challenge: High capital expenditure and significant implementation costs associated with advanced retail technologies present a primary challenge to market expansion and broad adoption.
The most significant market challenge is justifying the high capital expenditure for retail tech against uncertain returns. The difficulty in measuring the ROI of experiential retail activations, which often build long-term brand equity rather than immediate sales, makes securing budgets a constant battle. This is compounded by technology integration complexity when attempting to merge new platforms with legacy systems.
Furthermore, the reliance on data for personalization introduces severe regulatory hurdles. Navigating the complex web of global data privacy regulations, such as the GDPR in Europe, requires significant investment in customer data platform governance and cybersecurity.
Failure to comply can result in devastating financial penalties and loss of consumer trust, creating a major obstacle to the full realization of hyper-personalized retail experiences.
Explore Full Market Dynamics Analysis Request Free Sample
Experiential Retail Market Segmentation
The experiential retail industry research report provides comprehensive data including region-wise segment analysis, with forecasts and analysis for the period 2026-2030, as well as historical data from 2020-2024 for the following segments.
Type Segment Analysis
The immersive technology led experiences segment is estimated to witness significant growth during the forecast period.
The market segment defined by immersive technology-led experiences is fundamentally altering retail environments. This segment, contributing to over 32% of the market, moves beyond transactional sales to create sensory-rich destinations.
Retailers are deploying advanced visual and auditory systems, using interactive digital signage and spatial computing in retail to transport shoppers.
The integration of spatial computing and mixed reality allows consumers to engage with products in unprecedented ways, driving the experiential retail strategy.
The primary objective is to enhance dwell time and forge deep emotional connections, transforming a standard showroom into an interactive playground.
By leveraging brand storytelling installations, companies differentiate themselves, ensuring the physical store operates not just as a distribution point but as a powerful marketing channel.
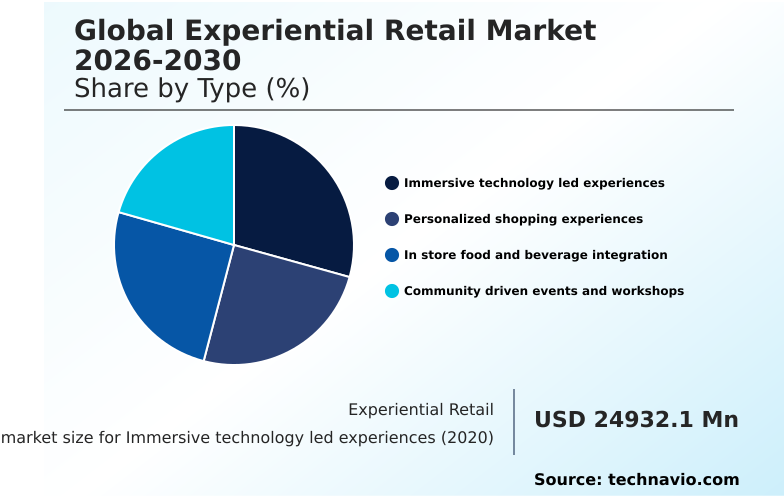
The Immersive technology led experiences segment was valued at USD 36.43 billion in 2024 and showed a gradual increase during the forecast period.
Experiential Retail Market by Region: North America Leads with 31.1% Growth Share
North America is estimated to contribute 31.1% to the growth of the global market during the forecast period.
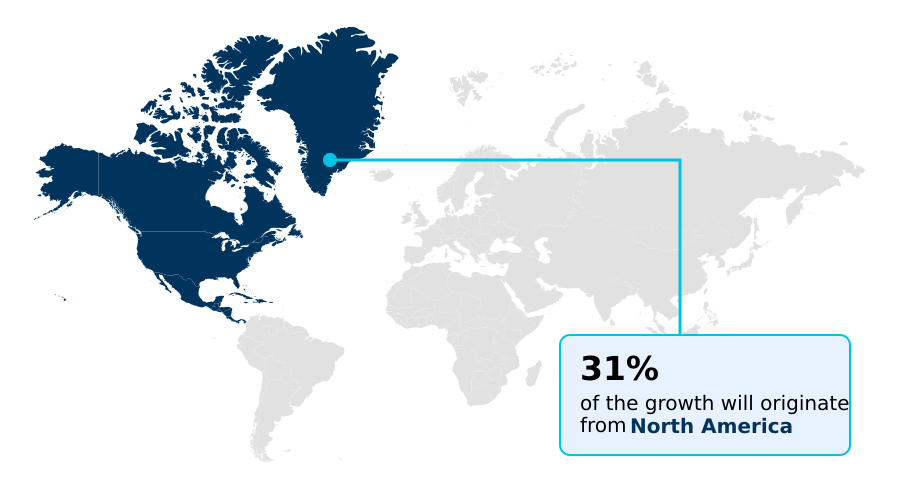
The geographic landscape of the market is diverse, with North America leading, accounting for approximately 31% of the growth.
This maturity is contrasted by the rapid acceleration in APAC, which shows the highest regional CAGR at 16.6%, driven by hyper-urbanization and high digital adoption in countries like China and South Korea.
In these regions, a hyper-local retail strategy is crucial, with brands deploying flagship store designs and pop-up shop activations to create buzz. European markets focus on urban retail revitalization, blending heritage with modern retailtainment concepts.
Meanwhile, emerging markets in South America and the Middle East are developing their own unique approaches, focusing on community-centric models and luxury experiences.
This global variance requires a nuanced approach to cross-border retail localization to successfully implement a cohesive yet adaptable experiential retail strategy.
Customer Landscape Analysis for the Experiential Retail Market
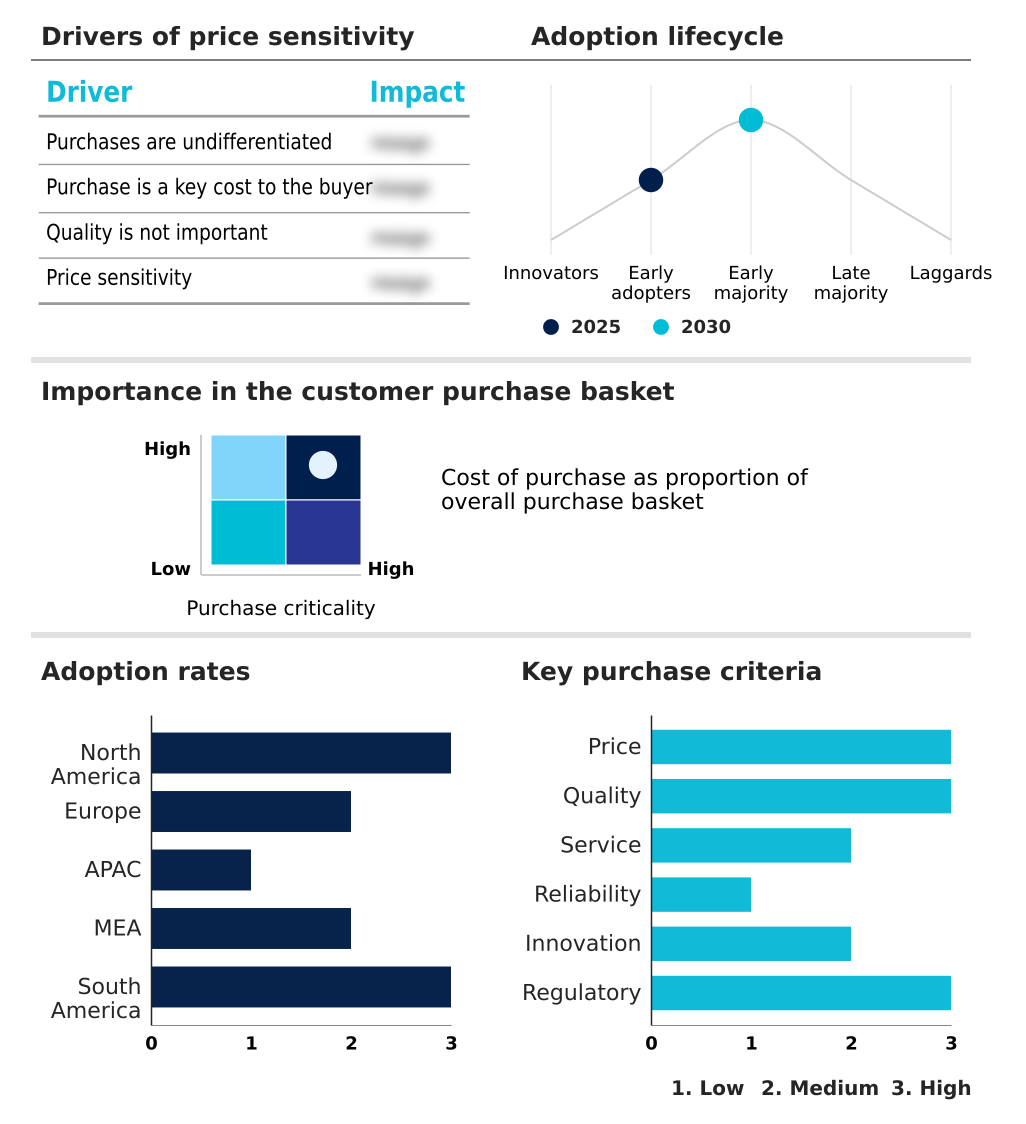
The experiential retail market forecasting report includes the adoption lifecycle of the market, covering from the innovator’s stage to the laggard’s stage. It focuses on adoption rates in different regions based on penetration. Furthermore, the experiential retail market report also includes key purchase criteria and drivers of price sensitivity to help companies evaluate and develop their market growth analysis strategies.
Competitive Landscape of the Experiential Retail Market
Companies are implementing various strategies, such as strategic alliances, partnerships, mergers and acquisitions, geographical expansion, and product/service launches, to enhance their presence in the experiential retail market industry.
Adobe Inc. - Key offerings orchestrate AI-driven personalization and immersive digital commerce experiences, leveraging real-time content management to enhance customer journey mapping and engagement across channels.
The industry research and growth report includes detailed analyses of the competitive landscape of the market and information about key companies, including:
- Adobe Inc.
- Amazon.com Inc.
- Apple Inc.
- Dyson Ltd.
- Farfetch Ltd.
- HOL Group
- Inter IKEA Holding BV
- Matterport Inc.
- Meta Platforms Inc.
- Microsoft Corp.
- Nike Inc.
- PTC Inc.
- Renascence
- Salesforce Inc.
- Samsung Electronics Co. Ltd.
- SAP SE
- Shopify Inc.
- Snap Inc.
- Zebra Technologies Corp.
- Zendesk Inc.
Qualitative and quantitative analysis of companies has been conducted to help clients understand the wider business environment as well as the strengths and weaknesses of key industry players. Data is qualitatively analyzed to categorize companies as pure play, category-focused, industry-focused, and diversified; it is quantitatively analyzed to categorize companies as dominant, leading, strong, tentative, and weak.
Recent Developments in the Experiential Retail Market
- In April 2025, SHEIN launched its largest experiential pop-up event in Sydney, Australia, featuring product showcases, cafes, and interactive zones to translate its online brand into a physical experience.
- In December 2024, Target launched its reimagined design-led immersive store concept in New York, US, blending fashion, beauty, and lifestyle elements into a curated space to heighten consumer engagement and brand storytelling.
- In October 2024, Samsung Electronics America launched three additional Samsung Experience Stores across the United States, expanding its commitment to offering customers interactive, hands-on product engagement and expert guidance in a redefined retail setting.
- In January 2025, Hettich inaugurated its first experiential-focused HeX store in Chennai, India, featuring walkthrough lifestyle displays and hands-on product interaction, centered on providing immersive inspiration and complimentary design consultation services.
Research Analyst Overview: Experiential Retail Market
The experiential retail market's current trajectory, showing a 13.0% year-over-year growth, is less about selling products and more about monetizing engagement through a sophisticated experiential retail strategy. At the core of this is the omnichannel retail integration, where customer journey mapping is tracked across digital and physical touchpoints.
Boardroom decisions now center on the high capital expenditure for retail tech, specifically for deploying an in-store personalization engine and smart fitting room technology. These investments are justified by their potential to capture granular data for predictive customer analytics.
However, this data collection is constrained by stringent customer data platform governance requirements, such as those outlined in the ISO/IEC 27701 standard for privacy information management. A key challenge is the technology integration complexity associated with merging legacy systems with new platforms for augmented reality try-on and frictionless checkout systems, making total cost of ownership a critical consideration.
Dive into Technavio’s robust research methodology, blending expert interviews, extensive data synthesis, and validated models for unparalleled Experiential Retail Market insights. See full methodology.
| Market Scope | |
|---|---|
| Page number | 314 |
| Base year | 2025 |
| Historic period | 2020-2024 |
| Forecast period | 2026-2030 |
| Growth momentum & CAGR | Accelerate at a CAGR of 14.9% |
| Market growth 2026-2030 | USD 133553.1 million |
| Market structure | Fragmented |
| YoY growth 2025-2026(%) | 13.0% |
| Key countries | US, Canada, Mexico, Germany, UK, France, Italy, Spain, The Netherlands, China, Japan, India, South Korea, Australia, Indonesia, Saudi Arabia, UAE, South Africa, Israel, Turkey, Brazil, Argentina and Colombia |
| Competitive landscape | Leading Companies, Market Positioning of Companies, Competitive Strategies, and Industry Risks |
Experiential Retail Market: Key Questions Answered in This Report
-
What is the expected growth of the Experiential Retail Market between 2026 and 2030?
-
The Experiential Retail Market is expected to grow by USD 133.55 billion during 2026-2030, registering a CAGR of 14.9%. Year-over-year growth in 2026 is estimated at 13.0%%. This acceleration is shaped by immersive technology integration, which is intensifying demand across multiple end-use verticals covered in the report.
-
-
What segmentation does the market report cover?
-
The report is segmented by Type (Immersive technology led experiences, Personalized shopping experiences, In store food and beverage integration, and Community driven events and workshops), End-user (Fashion and apparel, Sports and lifestyle, Consumer electronics, and Beauty and cosmetics), Technology (Augmented reality and virtual reality, Interactive digital displays, Smart fitting rooms, and Mobile app-based engagement) and Geography (North America, Europe, APAC, Middle East and Africa, South America). Among these, the Immersive technology led experiences segment is estimated to witness significant growth during the forecast period, driven by rising adoption across key application areas. Each segment includes detailed qualitative and quantitative analysis, along with historical data from 2020-2024 and forecasts through 2030 with year-over-year growth rates.
-
-
Which regions are analyzed in the report?
-
The report covers North America, Europe, APAC, Middle East and Africa and South America. North America is estimated to contribute 31.1% to market growth during the forecast period. Country-level analysis includes US, Canada, Mexico, Germany, UK, France, Italy, Spain, The Netherlands, China, Japan, India, South Korea, Australia, Indonesia, Saudi Arabia, UAE, South Africa, Israel, Turkey, Brazil, Argentina and Colombia, with dedicated market size tables and year-over-year growth for each.
-
-
What are the key growth drivers and market challenges?
-
The primary driver is immersive technology integration, which is accelerating investment and industry demand. The main challenge is high capital expenditure and implementation costs, creating operational barriers for key market participants. The report quantifies the impact of each driver and challenge across 2026 and 2030 with comparative analysis.
-
-
Who are the major players in the Experiential Retail Market?
-
Key vendors include Adobe Inc., Amazon.com Inc., Apple Inc., Dyson Ltd., Farfetch Ltd., HOL Group, Inter IKEA Holding BV, Matterport Inc., Meta Platforms Inc., Microsoft Corp., Nike Inc., PTC Inc., Renascence, Salesforce Inc., Samsung Electronics Co. Ltd., SAP SE, Shopify Inc., Snap Inc., Zebra Technologies Corp. and Zendesk Inc.. The report provides qualitative and quantitative analysis categorizing companies as dominant, leading, strong, tentative, and weak based on their market positioning. Company profiles include business segment analysis, SWOT assessment, key offerings, and recent strategic developments.
-
Experiential Retail Market Research Insights
Market dynamics are shaped by the strategic necessity of transforming physical stores into destination hubs. This involves a hyper-local retail strategy and the creation of a community hub retail model, where brands host events to foster loyalty. A critical aspect is the implementation of a hyper-personalization engine, which leverages in-store customer tracking through technologies compliant with regulations like the GDPR.
For example, a luxury boutique uses location-based marketing to greet returning clients via a mobile app, offering AI-powered styling recommendations based on past purchases. However, this level of personalization requires robust customer data platform governance and transparent consent mechanisms to maintain trust.
The focus on sensory branding elements and sustainable experiential store design further differentiates brands, turning retail spaces into powerful marketing assets.
We can help! Our analysts can customize this experiential retail market research report to meet your requirements.
 RIA -
RIA - 
