Feed Phosphate Market Analysis, Size, and Forecast 2026-2030: APAC (China, India, and Japan), North America (US, Canada, and Mexico), Europe (Germany, UK, and France), Middle East and Africa (Saudi Arabia, UAE, and South Africa), South America (Brazil, Argentina, and Colombia), and Rest of World (ROW)

Feed Phosphate Market Analysis, Size, and Forecast 2026-2030:
APAC (China, India, and Japan), North America (US, Canada, and Mexico), Europe (Germany, UK, and France), Middle East and Africa (Saudi Arabia, UAE, and South Africa), South America (Brazil, Argentina, and Colombia), and Rest of World (ROW)

Published: Dec 2025 312 Pages SKU: IRTNTR81198

Market Overview at a Glance

$902.1 Mn
Market Opportunity
6.1%
CAGR 2025 - 2030
43.7%
APAC Growth
$920.8 Mn
Dicalcium phosphate segment 2024

Feed Phosphate Market Size 2026-2030

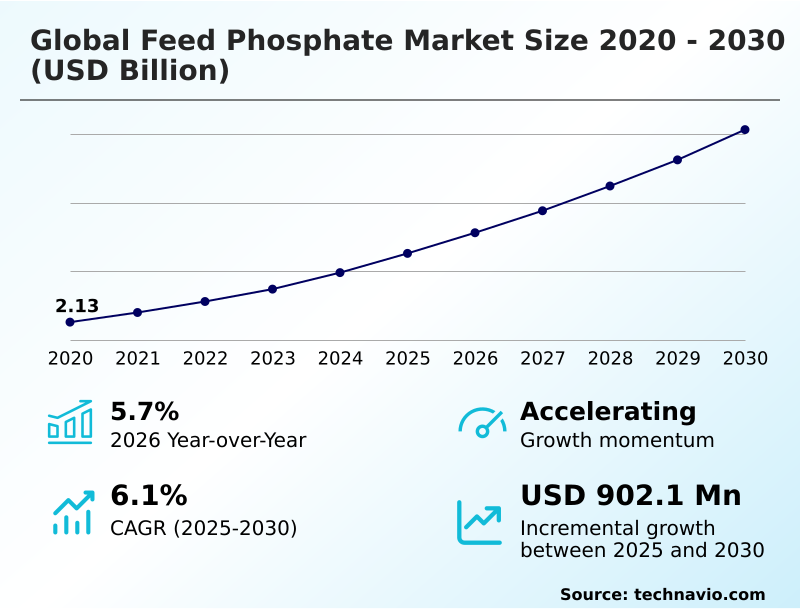
The feed phosphate market size is valued to increase by USD 902.1 million, at a CAGR of 6.1% from 2025 to 2030. Escalating global demand for animal-derived protein will drive the feed phosphate market.

Major Market Trends & Insights

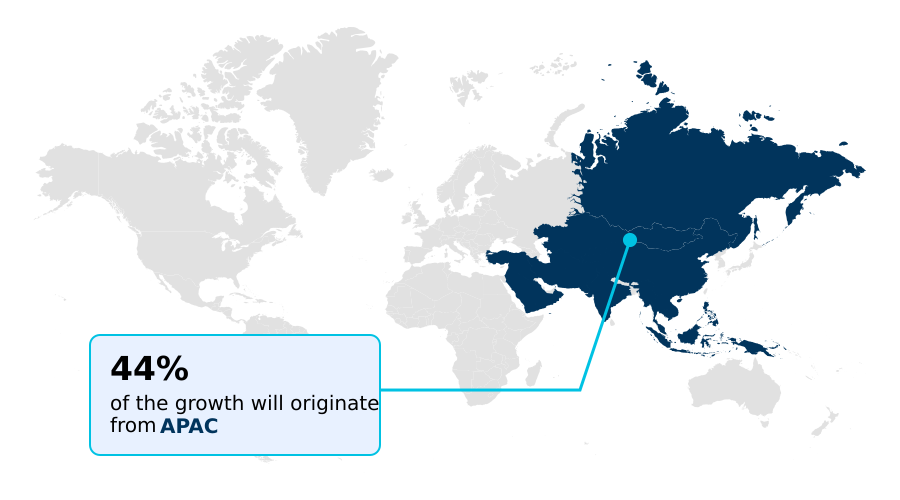
  • APAC dominated the market and accounted for a 43.7% growth during the forecast period.
  • By Product - Dicalcium phosphate segment was valued at USD 920.8 million in 2024
  • By Application - Poultry segment accounted for the largest market revenue share in 2024

Market Size & Forecast

  • Market Opportunities: USD 1.40 billion
  • Market Future Opportunities: USD 902.1 million
  • CAGR from 2025 to 2030 : 6.1%

Market Summary

What will be the Size of the Feed Phosphate Market during the forecast period?

Get Key Insights on Market Forecast (PDF) Request Free Sample

How is the Feed Phosphate Market Segmented?

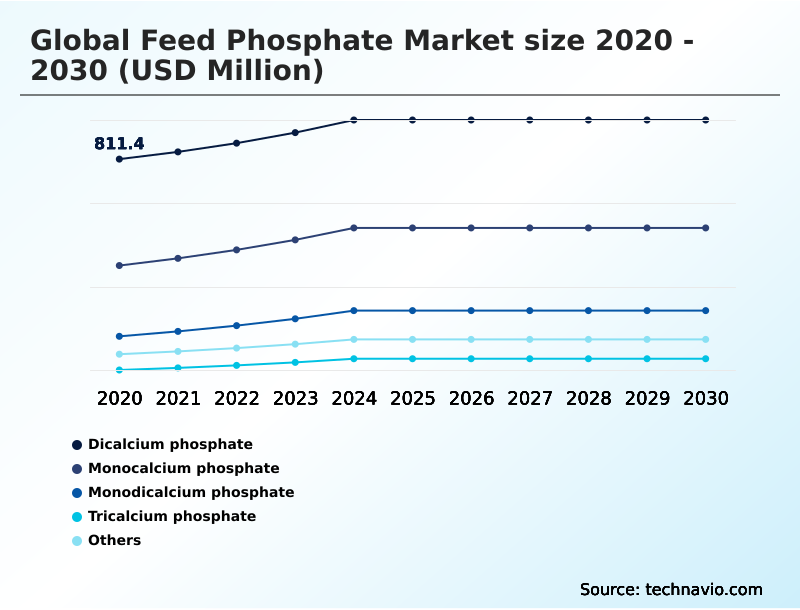
The feed phosphate industry research report provides comprehensive data (region-wise segment analysis), with forecasts and estimates in "USD million" for the period 2026-2030, as well as historical data from 2020-2024 for the following segments.

  • Product
    • Dicalcium phosphate
    • Monocalcium phosphate
    • Monodicalcium phosphate
    • Tricalcium phosphate
    • Others
  • Application
    • Poultry
    • Swine
    • Ruminants
    • Aquatic
    • Others
  • Formulation
    • Powdered
    • Granular
  • Geography
    • APAC
      • China
      • India
      • Japan
    • North America
      • US
      • Canada
      • Mexico
    • Europe
      • Germany
      • UK
      • France
    • Middle East and Africa
      • Saudi Arabia
      • UAE
      • South Africa
    • South America
      • Brazil
      • Argentina
      • Colombia
    • Rest of World (ROW)

By Product Insights

The dicalcium phosphate segment is estimated to witness significant growth during the forecast period.

Request Free Sample

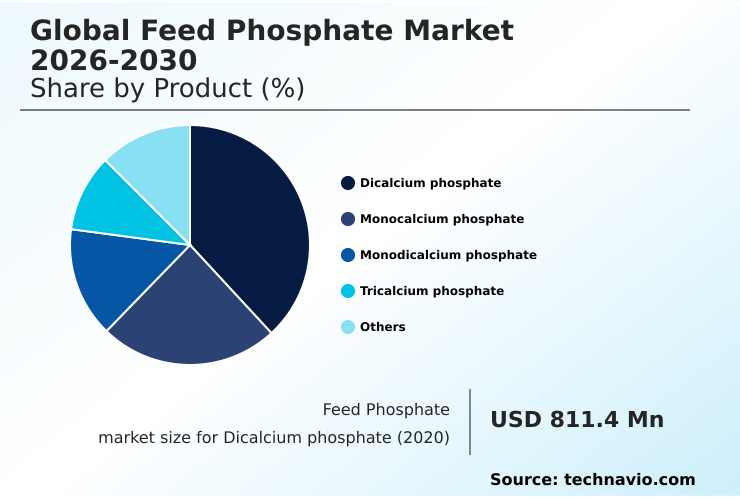
The Dicalcium phosphate segment was valued at USD 920.8 million in 2024 and showed a gradual increase during the forecast period.

Request Free Sample

Regional Analysis

APAC is estimated to contribute 43.7% to the growth of the global market during the forecast period.Technavio’s analysts have elaborately explained the regional trends and drivers that shape the market during the forecast period.

See How Feed Phosphate Market Demand is Rising in APAC Request Free Sample

Market Dynamics

Our researchers analyzed the data with 2025 as the base year, along with the key drivers, trends, and challenges. A holistic analysis of drivers will help companies refine their marketing strategies to gain a competitive advantage.

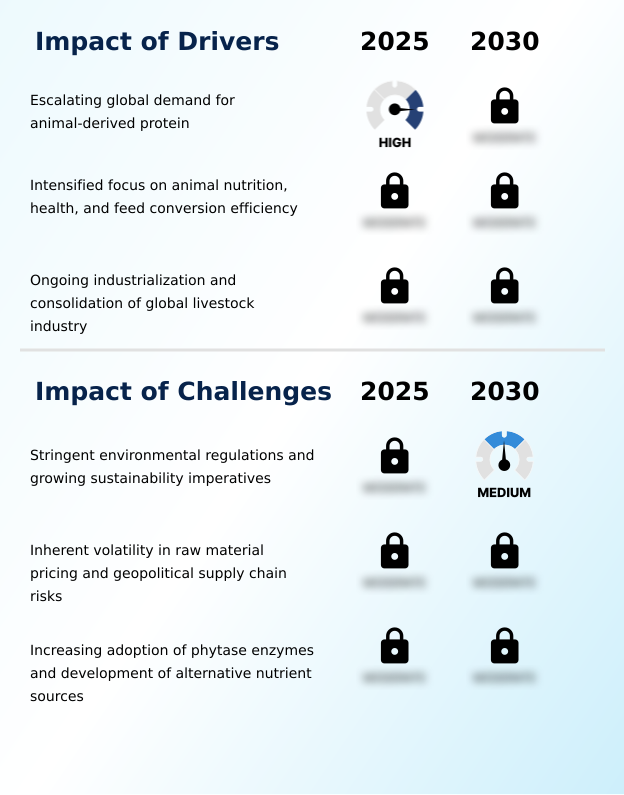
What are the key market drivers leading to the rise in the adoption of Feed Phosphate Industry?

What are the market trends shaping the Feed Phosphate Industry?

What challenges does the Feed Phosphate Industry face during its growth?

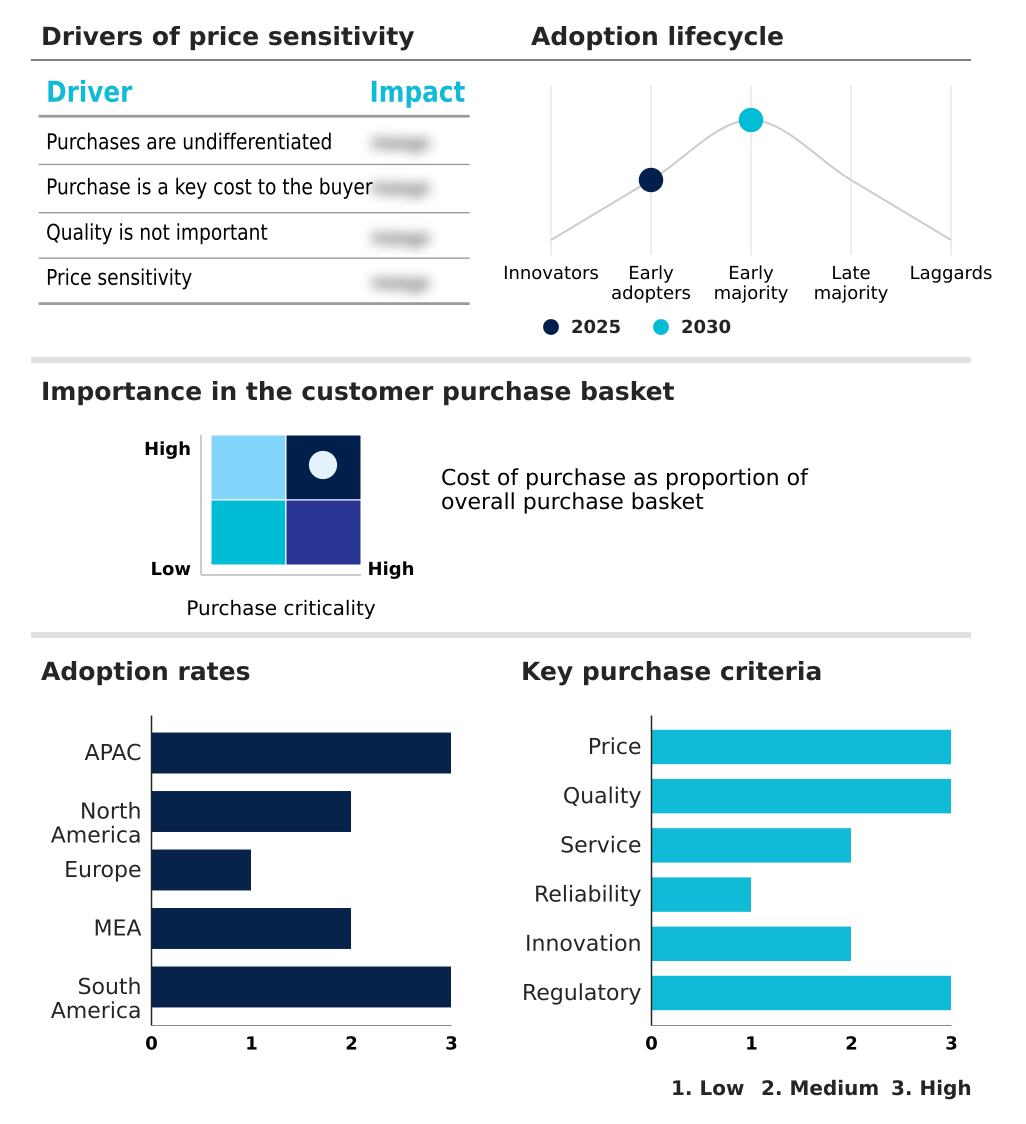
Exclusive Technavio Analysis on Customer Landscape

The feed phosphate market forecasting report includes the adoption lifecycle of the market, covering from the innovator’s stage to the laggard’s stage. It focuses on adoption rates in different regions based on penetration. Furthermore, the feed phosphate market report also includes key purchase criteria and drivers of price sensitivity to help companies evaluate and develop their market growth analysis strategies.

Customer Landscape of Feed Phosphate Industry

Competitive Landscape

Companies are implementing various strategies, such as strategic alliances, feed phosphate market forecast, partnerships, mergers and acquisitions, geographical expansion, and product/service launches, to enhance their presence in the industry.

Archer Daniels Midland Co. -

The industry research and growth report includes detailed analyses of the competitive landscape of the market and information about key companies, including:

  • Archer Daniels Midland Co.
  • Cargill Inc.
  • Coromandel International Ltd.
  • Elixir Group
  • EuroChem Group AG
  • ForFarmers NV
  • Fosfitalia S.p.A
  • Groupe Roullier
  • Hubei Xingfa Chemicals Group Co. Ltd.
  • Israel Chemicals Ltd.
  • JR Simplot Co
  • Land O Lakes Inc.
  • Nutrien Ltd.
  • Paradeep Phosphates Limited
  • Phibro Animal Health Corp.
  • PhosAgro Group of Companies
  • Prayon SA
  • The Mosaic Co.
  • Yara International ASA

Qualitative and quantitative analysis of companies has been conducted to help clients understand the wider business environment as well as the strengths and weaknesses of key industry players. Data is qualitatively analyzed to categorize companies as pure play, category-focused, industry-focused, and diversified; it is quantitatively analyzed to categorize companies as dominant, leading, strong, tentative, and weak.

Recent Development and News in Feed phosphate market

Dive into Technavio’s robust research methodology, blending expert interviews, extensive data synthesis, and validated models for unparalleled Feed Phosphate Market insights. See full methodology.

Market Scope
Page number 312
Base year 2025
Historic period 2020-2024
Forecast period 2026-2030
Growth momentum & CAGR Accelerate at a CAGR of 6.1%
Market growth 2026-2030 USD 902.1 million
Market structure Fragmented
YoY growth 2025-2026(%) 5.7%
Key countries China, India, Japan, South Korea, Australia, Indonesia, US, Canada, Mexico, Germany, UK, France, Italy, The Netherlands, Spain, Saudi Arabia, UAE, South Africa, Israel, Turkey, Brazil, Argentina and Colombia
Competitive landscape Leading Companies, Market Positioning of Companies, Competitive Strategies, and Industry Risks

Request Free Sample

Research Analyst Overview

What are the Key Data Covered in this Feed Phosphate Market Research and Growth Report?

  • What is the expected growth of the Feed Phosphate Market between 2026 and 2030?

    • USD 902.1 million, at a CAGR of 6.1%

  • What segmentation does the market report cover?

    • The report is segmented by Product (Dicalcium phosphate, Monocalcium phosphate, Monodicalcium phosphate, Tricalcium phosphate, and Others), Application (Poultry, Swine, Ruminants, Aquatic, and Others), Formulation (Powdered, and Granular) and Geography (APAC, North America, Europe, Middle East and Africa, South America)

  • Which regions are analyzed in the report?

    • APAC, North America, Europe, Middle East and Africa and South America

  • What are the key growth drivers and market challenges?

    • Escalating global demand for animal-derived protein, Stringent environmental regulations and growing sustainability imperatives

  • Who are the major players in the Feed Phosphate Market?

    • Archer Daniels Midland Co., Cargill Inc., Coromandel International Ltd., Elixir Group, EuroChem Group AG, ForFarmers NV, Fosfitalia S.p.A, Groupe Roullier, Hubei Xingfa Chemicals Group Co. Ltd., Israel Chemicals Ltd., JR Simplot Co, Land O Lakes Inc., Nutrien Ltd., Paradeep Phosphates Limited, Phibro Animal Health Corp., PhosAgro Group of Companies, Prayon SA, The Mosaic Co. and Yara International ASA

Market Research Insights

We can help! Our analysts can customize this feed phosphate market research report to meet your requirements.

Get in touch

1. Executive Summary

1.1 Market overview

Executive Summary - Chart on Market Overview
Executive Summary - Data Table on Market Overview
Executive Summary - Chart on Global Market Characteristics
Executive Summary - Chart on Market by Geography
Executive Summary - Chart on Market Segmentation by Product
Executive Summary - Chart on Market Segmentation by Application
Executive Summary - Chart on Market Segmentation by Formulation
Executive Summary - Chart on Incremental Growth
Executive Summary - Data Table on Incremental Growth
Executive Summary - Chart on Company Market Positioning

2. Technavio Analysis

2.1 Analysis of price sensitivity, lifecycle, customer purchase basket, adoption rates, and purchase criteria

2.2 Criticality of inputs and Factors of differentiation

Chart on Overview on criticality of inputs and factors of differentiation

2.3 Factors of disruption

Chart on Overview on factors of disruption

2.4 Impact of drivers and challenges

Chart on Impact of drivers and challenges in 2025 and 2030

3. Market Landscape

3.1 Market ecosystem

Chart on Parent Market
Data Table on - Parent Market

3.2 Market characteristics

Chart on Market characteristics analysis

3.3 Value chain analysis

Chart on Value chain analysis

4. Market Sizing

4.1 Market definition

Data Table on Offerings of companies included in the market definition

4.2 Market segment analysis

Market segments

4.3 Market size 2025

4.4 Market outlook: Forecast for 2025-2030

Chart on Global - Market size and forecast 2025-2030 ($ million)
Data Table on Global - Market size and forecast 2025-2030 ($ million)
Chart on Global Market: Year-over-year growth 2025-2030 (%)
Data Table on Global Market: Year-over-year growth 2025-2030 (%)

5. Historic Market Size

5.1 Global Feed Phosphate Market 2020 - 2024

Historic Market Size - Data Table on Global Feed Phosphate Market 2020 - 2024 ($ million)

5.2 Product segment analysis 2020 - 2024

Historic Market Size - Product Segment 2020 - 2024 ($ million)

5.3 Application segment analysis 2020 - 2024

Historic Market Size - Application Segment 2020 - 2024 ($ million)

5.4 Formulation segment analysis 2020 - 2024

Historic Market Size - Formulation Segment 2020 - 2024 ($ million)

5.5 Geography segment analysis 2020 - 2024

Historic Market Size - Geography Segment 2020 - 2024 ($ million)

5.6 Country segment analysis 2020 - 2024

Historic Market Size - Country Segment 2020 - 2024 ($ million)

6. Qualitative Analysis

6.1 Impact of AI on the Global Feed Phosphate Market

7. Five Forces Analysis

7.1 Five forces summary

Five forces analysis - Comparison between 2025 and 2030

7.2 Bargaining power of buyers

Bargaining power of buyers - Impact of key factors 2025 and 2030

7.3 Bargaining power of suppliers

Bargaining power of suppliers - Impact of key factors in 2025 and 2030

7.4 Threat of new entrants

Threat of new entrants - Impact of key factors in 2025 and 2030

7.5 Threat of substitutes

Threat of substitutes - Impact of key factors in 2025 and 2030

7.6 Threat of rivalry

Threat of rivalry - Impact of key factors in 2025 and 2030

7.7 Market condition

Chart on Market condition - Five forces 2025 and 2030

8. Market Segmentation by Product

8.1 Market segments

Chart on Product - Market share 2025-2030 (%)
Data Table on Product - Market share 2025-2030 (%)

8.2 Comparison by Product

Chart on Comparison by Product
Data Table on Comparison by Product

8.3 Dicalcium phosphate - Market size and forecast 2025-2030

Chart on Dicalcium phosphate - Market size and forecast 2025-2030 ($ million)
Data Table on Dicalcium phosphate - Market size and forecast 2025-2030 ($ million)
Chart on Dicalcium phosphate - Year-over-year growth 2025-2030 (%)
Data Table on Dicalcium phosphate - Year-over-year growth 2025-2030 (%)

8.4 Monocalcium phosphate - Market size and forecast 2025-2030

Chart on Monocalcium phosphate - Market size and forecast 2025-2030 ($ million)
Data Table on Monocalcium phosphate - Market size and forecast 2025-2030 ($ million)
Chart on Monocalcium phosphate - Year-over-year growth 2025-2030 (%)
Data Table on Monocalcium phosphate - Year-over-year growth 2025-2030 (%)

8.5 Monodicalcium phosphate - Market size and forecast 2025-2030

Chart on Monodicalcium phosphate - Market size and forecast 2025-2030 ($ million)
Data Table on Monodicalcium phosphate - Market size and forecast 2025-2030 ($ million)
Chart on Monodicalcium phosphate - Year-over-year growth 2025-2030 (%)
Data Table on Monodicalcium phosphate - Year-over-year growth 2025-2030 (%)

8.6 Tricalcium phosphate - Market size and forecast 2025-2030

Chart on Tricalcium phosphate - Market size and forecast 2025-2030 ($ million)
Data Table on Tricalcium phosphate - Market size and forecast 2025-2030 ($ million)
Chart on Tricalcium phosphate - Year-over-year growth 2025-2030 (%)
Data Table on Tricalcium phosphate - Year-over-year growth 2025-2030 (%)

8.7 Others - Market size and forecast 2025-2030

Chart on Others - Market size and forecast 2025-2030 ($ million)
Data Table on Others - Market size and forecast 2025-2030 ($ million)
Chart on Others - Year-over-year growth 2025-2030 (%)
Data Table on Others - Year-over-year growth 2025-2030 (%)

8.8 Market opportunity by Product

Market opportunity by Product ($ million)
Data Table on Market opportunity by Product ($ million)

9. Market Segmentation by Application

9.1 Market segments

Chart on Application - Market share 2025-2030 (%)
Data Table on Application - Market share 2025-2030 (%)

9.2 Comparison by Application

Chart on Comparison by Application
Data Table on Comparison by Application

9.3 Poultry - Market size and forecast 2025-2030

Chart on Poultry - Market size and forecast 2025-2030 ($ million)
Data Table on Poultry - Market size and forecast 2025-2030 ($ million)
Chart on Poultry - Year-over-year growth 2025-2030 (%)
Data Table on Poultry - Year-over-year growth 2025-2030 (%)

9.4 Swine - Market size and forecast 2025-2030

Chart on Swine - Market size and forecast 2025-2030 ($ million)
Data Table on Swine - Market size and forecast 2025-2030 ($ million)
Chart on Swine - Year-over-year growth 2025-2030 (%)
Data Table on Swine - Year-over-year growth 2025-2030 (%)

9.5 Ruminants - Market size and forecast 2025-2030

Chart on Ruminants - Market size and forecast 2025-2030 ($ million)
Data Table on Ruminants - Market size and forecast 2025-2030 ($ million)
Chart on Ruminants - Year-over-year growth 2025-2030 (%)
Data Table on Ruminants - Year-over-year growth 2025-2030 (%)

9.6 Aquatic - Market size and forecast 2025-2030

Chart on Aquatic - Market size and forecast 2025-2030 ($ million)
Data Table on Aquatic - Market size and forecast 2025-2030 ($ million)
Chart on Aquatic - Year-over-year growth 2025-2030 (%)
Data Table on Aquatic - Year-over-year growth 2025-2030 (%)

9.7 Others - Market size and forecast 2025-2030

Chart on Others - Market size and forecast 2025-2030 ($ million)
Data Table on Others - Market size and forecast 2025-2030 ($ million)
Chart on Others - Year-over-year growth 2025-2030 (%)
Data Table on Others - Year-over-year growth 2025-2030 (%)

9.8 Market opportunity by Application

Market opportunity by Application ($ million)
Data Table on Market opportunity by Application ($ million)

10. Market Segmentation by Formulation

10.1 Market segments

Chart on Formulation - Market share 2025-2030 (%)
Data Table on Formulation - Market share 2025-2030 (%)

10.2 Comparison by Formulation

Chart on Comparison by Formulation
Data Table on Comparison by Formulation

10.3 Powdered - Market size and forecast 2025-2030

Chart on Powdered - Market size and forecast 2025-2030 ($ million)
Data Table on Powdered - Market size and forecast 2025-2030 ($ million)
Chart on Powdered - Year-over-year growth 2025-2030 (%)
Data Table on Powdered - Year-over-year growth 2025-2030 (%)

10.4 Granular - Market size and forecast 2025-2030

Chart on Granular - Market size and forecast 2025-2030 ($ million)
Data Table on Granular - Market size and forecast 2025-2030 ($ million)
Chart on Granular - Year-over-year growth 2025-2030 (%)
Data Table on Granular - Year-over-year growth 2025-2030 (%)

10.5 Market opportunity by Formulation

Market opportunity by Formulation ($ million)
Data Table on Market opportunity by Formulation ($ million)

11. Customer Landscape

11.1 Customer landscape overview

Analysis of price sensitivity, lifecycle, customer purchase basket, adoption rates, and purchase criteria

12. Geographic Landscape

12.1 Geographic segmentation

Chart on Market share by geography 2025-2030 (%)
Data Table on Market share by geography 2025-2030 (%)

12.2 Geographic comparison

Chart on Geographic comparison
Data Table on Geographic comparison

12.3 APAC - Market size and forecast 2025-2030

Chart on APAC - Market size and forecast 2025-2030 ($ million)
Data Table on APAC - Market size and forecast 2025-2030 ($ million)
Chart on APAC - Year-over-year growth 2025-2030 (%)
Data Table on APAC - Year-over-year growth 2025-2030 (%)
Chart on Regional Comparison - APAC
Data Table on Regional Comparison - APAC

12.3.1 China - Market size and forecast 2025-2030

Chart on China - Market size and forecast 2025-2030 ($ million)
Data Table on China - Market size and forecast 2025-2030 ($ million)
Chart on China - Year-over-year growth 2025-2030 (%)
Data Table on China - Year-over-year growth 2025-2030 (%)

12.3.2 India - Market size and forecast 2025-2030

Chart on India - Market size and forecast 2025-2030 ($ million)
Data Table on India - Market size and forecast 2025-2030 ($ million)
Chart on India - Year-over-year growth 2025-2030 (%)
Data Table on India - Year-over-year growth 2025-2030 (%)

12.3.3 Japan - Market size and forecast 2025-2030

Chart on Japan - Market size and forecast 2025-2030 ($ million)
Data Table on Japan - Market size and forecast 2025-2030 ($ million)
Chart on Japan - Year-over-year growth 2025-2030 (%)
Data Table on Japan - Year-over-year growth 2025-2030 (%)

12.3.4 South Korea - Market size and forecast 2025-2030

Chart on South Korea - Market size and forecast 2025-2030 ($ million)
Data Table on South Korea - Market size and forecast 2025-2030 ($ million)
Chart on South Korea - Year-over-year growth 2025-2030 (%)
Data Table on South Korea - Year-over-year growth 2025-2030 (%)

12.3.5 Australia - Market size and forecast 2025-2030

Chart on Australia - Market size and forecast 2025-2030 ($ million)
Data Table on Australia - Market size and forecast 2025-2030 ($ million)
Chart on Australia - Year-over-year growth 2025-2030 (%)
Data Table on Australia - Year-over-year growth 2025-2030 (%)

12.3.6 Indonesia - Market size and forecast 2025-2030

Chart on Indonesia - Market size and forecast 2025-2030 ($ million)
Data Table on Indonesia - Market size and forecast 2025-2030 ($ million)
Chart on Indonesia - Year-over-year growth 2025-2030 (%)
Data Table on Indonesia - Year-over-year growth 2025-2030 (%)

12.4 North America - Market size and forecast 2025-2030

Chart on North America - Market size and forecast 2025-2030 ($ million)
Data Table on North America - Market size and forecast 2025-2030 ($ million)
Chart on North America - Year-over-year growth 2025-2030 (%)
Data Table on North America - Year-over-year growth 2025-2030 (%)
Chart on Regional Comparison - North America
Data Table on Regional Comparison - North America

12.4.1 US - Market size and forecast 2025-2030

Chart on US - Market size and forecast 2025-2030 ($ million)
Data Table on US - Market size and forecast 2025-2030 ($ million)
Chart on US - Year-over-year growth 2025-2030 (%)
Data Table on US - Year-over-year growth 2025-2030 (%)

12.4.2 Canada - Market size and forecast 2025-2030

Chart on Canada - Market size and forecast 2025-2030 ($ million)
Data Table on Canada - Market size and forecast 2025-2030 ($ million)
Chart on Canada - Year-over-year growth 2025-2030 (%)
Data Table on Canada - Year-over-year growth 2025-2030 (%)

12.4.3 Mexico - Market size and forecast 2025-2030

Chart on Mexico - Market size and forecast 2025-2030 ($ million)
Data Table on Mexico - Market size and forecast 2025-2030 ($ million)
Chart on Mexico - Year-over-year growth 2025-2030 (%)
Data Table on Mexico - Year-over-year growth 2025-2030 (%)

12.5 Europe - Market size and forecast 2025-2030

Chart on Europe - Market size and forecast 2025-2030 ($ million)
Data Table on Europe - Market size and forecast 2025-2030 ($ million)
Chart on Europe - Year-over-year growth 2025-2030 (%)
Data Table on Europe - Year-over-year growth 2025-2030 (%)
Chart on Regional Comparison - Europe
Data Table on Regional Comparison - Europe

12.5.1 Germany - Market size and forecast 2025-2030

Chart on Germany - Market size and forecast 2025-2030 ($ million)
Data Table on Germany - Market size and forecast 2025-2030 ($ million)
Chart on Germany - Year-over-year growth 2025-2030 (%)
Data Table on Germany - Year-over-year growth 2025-2030 (%)

12.5.2 UK - Market size and forecast 2025-2030

Chart on UK - Market size and forecast 2025-2030 ($ million)
Data Table on UK - Market size and forecast 2025-2030 ($ million)
Chart on UK - Year-over-year growth 2025-2030 (%)
Data Table on UK - Year-over-year growth 2025-2030 (%)

12.5.3 France - Market size and forecast 2025-2030

Chart on France - Market size and forecast 2025-2030 ($ million)
Data Table on France - Market size and forecast 2025-2030 ($ million)
Chart on France - Year-over-year growth 2025-2030 (%)
Data Table on France - Year-over-year growth 2025-2030 (%)

12.5.4 Italy - Market size and forecast 2025-2030

Chart on Italy - Market size and forecast 2025-2030 ($ million)
Data Table on Italy - Market size and forecast 2025-2030 ($ million)
Chart on Italy - Year-over-year growth 2025-2030 (%)
Data Table on Italy - Year-over-year growth 2025-2030 (%)

12.5.5 The Netherlands - Market size and forecast 2025-2030

Chart on The Netherlands - Market size and forecast 2025-2030 ($ million)
Data Table on The Netherlands - Market size and forecast 2025-2030 ($ million)
Chart on The Netherlands - Year-over-year growth 2025-2030 (%)
Data Table on The Netherlands - Year-over-year growth 2025-2030 (%)

12.5.6 Spain - Market size and forecast 2025-2030

Chart on Spain - Market size and forecast 2025-2030 ($ million)
Data Table on Spain - Market size and forecast 2025-2030 ($ million)
Chart on Spain - Year-over-year growth 2025-2030 (%)
Data Table on Spain - Year-over-year growth 2025-2030 (%)

12.6 Middle East and Africa - Market size and forecast 2025-2030

Chart on Middle East and Africa - Market size and forecast 2025-2030 ($ million)
Data Table on Middle East and Africa - Market size and forecast 2025-2030 ($ million)
Chart on Middle East and Africa - Year-over-year growth 2025-2030 (%)
Data Table on Middle East and Africa - Year-over-year growth 2025-2030 (%)
Chart on Regional Comparison - Middle East and Africa
Data Table on Regional Comparison - Middle East and Africa

12.6.1 Saudi Arabia - Market size and forecast 2025-2030

Chart on Saudi Arabia - Market size and forecast 2025-2030 ($ million)
Data Table on Saudi Arabia - Market size and forecast 2025-2030 ($ million)
Chart on Saudi Arabia - Year-over-year growth 2025-2030 (%)
Data Table on Saudi Arabia - Year-over-year growth 2025-2030 (%)

12.6.2 UAE - Market size and forecast 2025-2030

Chart on UAE - Market size and forecast 2025-2030 ($ million)
Data Table on UAE - Market size and forecast 2025-2030 ($ million)
Chart on UAE - Year-over-year growth 2025-2030 (%)
Data Table on UAE - Year-over-year growth 2025-2030 (%)

12.6.3 South Africa - Market size and forecast 2025-2030

Chart on South Africa - Market size and forecast 2025-2030 ($ million)
Data Table on South Africa - Market size and forecast 2025-2030 ($ million)
Chart on South Africa - Year-over-year growth 2025-2030 (%)
Data Table on South Africa - Year-over-year growth 2025-2030 (%)

12.6.4 Israel - Market size and forecast 2025-2030

Chart on Israel - Market size and forecast 2025-2030 ($ million)
Data Table on Israel - Market size and forecast 2025-2030 ($ million)
Chart on Israel - Year-over-year growth 2025-2030 (%)
Data Table on Israel - Year-over-year growth 2025-2030 (%)

12.6.5 Turkey - Market size and forecast 2025-2030

Chart on Turkey - Market size and forecast 2025-2030 ($ million)
Data Table on Turkey - Market size and forecast 2025-2030 ($ million)
Chart on Turkey - Year-over-year growth 2025-2030 (%)
Data Table on Turkey - Year-over-year growth 2025-2030 (%)

12.7 South America - Market size and forecast 2025-2030

Chart on South America - Market size and forecast 2025-2030 ($ million)
Data Table on South America - Market size and forecast 2025-2030 ($ million)
Chart on South America - Year-over-year growth 2025-2030 (%)
Data Table on South America - Year-over-year growth 2025-2030 (%)
Chart on Regional Comparison - South America
Data Table on Regional Comparison - South America

12.7.1 Brazil - Market size and forecast 2025-2030

Chart on Brazil - Market size and forecast 2025-2030 ($ million)
Data Table on Brazil - Market size and forecast 2025-2030 ($ million)
Chart on Brazil - Year-over-year growth 2025-2030 (%)
Data Table on Brazil - Year-over-year growth 2025-2030 (%)

12.7.2 Argentina - Market size and forecast 2025-2030

Chart on Argentina - Market size and forecast 2025-2030 ($ million)
Data Table on Argentina - Market size and forecast 2025-2030 ($ million)
Chart on Argentina - Year-over-year growth 2025-2030 (%)
Data Table on Argentina - Year-over-year growth 2025-2030 (%)

12.7.3 Colombia - Market size and forecast 2025-2030

Chart on Colombia - Market size and forecast 2025-2030 ($ million)
Data Table on Colombia - Market size and forecast 2025-2030 ($ million)
Chart on Colombia - Year-over-year growth 2025-2030 (%)
Data Table on Colombia - Year-over-year growth 2025-2030 (%)

12.8 Market opportunity by geography

Market opportunity by geography ($ million)
Data Tables on Market opportunity by geography ($ million)

13. Drivers, Challenges, and Opportunity

13.1 Market drivers

Escalating global demand for animal-derived protein
Intensified focus on animal nutrition, health, and feed conversion efficiency
Ongoing industrialization and consolidation of global livestock industry

13.2 Market challenges

Stringent environmental regulations and growing sustainability imperatives
Inherent volatility in raw material pricing and geopolitical supply chain risks
Increasing adoption of phytase enzymes and development of alternative nutrient sources

13.3 Impact of drivers and challenges

Impact of drivers and challenges in 2025 and 2030

13.4 Market opportunities

Ascendancy of sustainability and circular economy in phosphate sourcing
Product innovation focused on enhanced bioavailability and functional benefits
Intensified geopolitical influence and supply chain volatility

14. Competitive Landscape

14.1 Overview

14.2

Overview on criticality of inputs and factors of differentiation

14.3 Landscape disruption

Overview on factors of disruption

14.4 Industry risks

Impact of key risks on business

15. Competitive Analysis

15.1 Companies profiled

Companies covered

15.2 Company ranking index

15.3 Market positioning of companies

Matrix on companies position and classification

15.4 Archer Daniels Midland Co.

Archer Daniels Midland Co. - Overview
Archer Daniels Midland Co. - Business segments
Archer Daniels Midland Co. - Key news
Archer Daniels Midland Co. - Key offerings
Archer Daniels Midland Co. - Segment focus
SWOT

15.5 Cargill Inc.

Cargill Inc. - Overview
Cargill Inc. - Product / Service
Cargill Inc. - Key offerings
SWOT

15.6 Coromandel International Ltd.

Coromandel International Ltd. - Overview
Coromandel International Ltd. - Business segments
Coromandel International Ltd. - Key news
Coromandel International Ltd. - Key offerings
Coromandel International Ltd. - Segment focus
SWOT

15.7 EuroChem Group AG

EuroChem Group AG - Overview
EuroChem Group AG - Product / Service
EuroChem Group AG - Key offerings
SWOT

15.8 Groupe Roullier

Groupe Roullier - Overview
Groupe Roullier - Product / Service
Groupe Roullier - Key news
Groupe Roullier - Key offerings
SWOT

15.9 Hubei Xingfa Chemicals Group Co. Ltd.

Hubei Xingfa Chemicals Group Co. Ltd. - Overview
Hubei Xingfa Chemicals Group Co. Ltd. - Product / Service
Hubei Xingfa Chemicals Group Co. Ltd. - Key offerings
SWOT

15.10 Israel Chemicals Ltd.

Israel Chemicals Ltd. - Overview
Israel Chemicals Ltd. - Business segments
Israel Chemicals Ltd. - Key offerings
Israel Chemicals Ltd. - Segment focus
SWOT

15.11 JR Simplot Co

JR Simplot Co - Overview
JR Simplot Co - Product / Service
JR Simplot Co - Key offerings
SWOT

15.12 Nutrien Ltd.

Nutrien Ltd. - Overview
Nutrien Ltd. - Business segments
Nutrien Ltd. - Key offerings
Nutrien Ltd. - Segment focus
SWOT

15.13 Paradeep Phosphates Limited

Paradeep Phosphates Limited - Overview
Paradeep Phosphates Limited - Product / Service
Paradeep Phosphates Limited - Key offerings
SWOT

15.14 Phibro Animal Health Corp.

Phibro Animal Health Corp. - Overview
Phibro Animal Health Corp. - Business segments
Phibro Animal Health Corp. - Key offerings
Phibro Animal Health Corp. - Segment focus
SWOT

15.15 PhosAgro Group of Companies

PhosAgro Group of Companies - Overview
PhosAgro Group of Companies - Product / Service
PhosAgro Group of Companies - Key offerings
SWOT

15.16 Prayon SA

Prayon SA - Overview
Prayon SA - Product / Service
Prayon SA - Key offerings
SWOT

15.17 The Mosaic Co.

The Mosaic Co. - Overview
The Mosaic Co. - Business segments
The Mosaic Co. - Key offerings
The Mosaic Co. - Segment focus
SWOT

15.18 Yara International ASA

Yara International ASA - Overview
Yara International ASA - Business segments
Yara International ASA - Key offerings
Yara International ASA - Segment focus
SWOT

16. Appendix

16.1 Scope of the report

Market definition
Objectives
Notes and caveats

16.2 Inclusions and exclusions checklist

Inclusions checklist
Exclusions checklist

16.3 Currency conversion rates for US$

16.4 Research methodology

16.5 Data procurement

Information sources

16.6 Data validation

16.7 Validation techniques employed for market sizing

16.8 Data synthesis

16.9 360 degree market analysis

16.10 List of abbreviations

Research Methodology

Technavio presents a detailed picture of the market by way of study, synthesis, and summation of data from multiple sources. The analysts have presented the various facets of the market with a particular focus on identifying the key industry influencers. The data thus presented is comprehensive, reliable, and the result of extensive research, both primary and secondary.

INFORMATION SOURCES

Primary sources

  • Manufacturers and suppliers
  • Channel partners
  • Industry experts
  • Strategic decision makers

Secondary sources

  • Industry journals and periodicals
  • Government data
  • Financial reports of key industry players
  • Historical data
  • Press releases

DATA ANALYSIS

Data Synthesis

  • Collation of data
  • Estimation of key figures
  • Analysis of derived insights

Data Validation

  • Triangulation with data models
  • Reference against proprietary databases
  • Corroboration with industry experts

REPORT WRITING

Qualitative

  • Market drivers
  • Market challenges
  • Market trends
  • Five forces analysis

Quantitative

  • Market size and forecast
  • Market segmentation
  • Geographical insights
  • Competitive landscape

Interested in this report?

Get your sample now to see our research methodology and insights!

Download Now

Frequently Asked Questions

Feed Phosphate market growth will increase by USD 902.1 million during 2026-2030 .

The Feed Phosphate market is expected to grow at a CAGR of 6.1% during 2026-2030 .

Feed Phosphate market is segmented by Product (Dicalcium phosphate, Monocalcium phosphate, Monodicalcium phosphate, Tricalcium phosphate, Others) Application (Poultry, Swine, Ruminants, Aquatic, Others) Formulation (Powdered, Granular)

Archer Daniels Midland Co., Cargill Inc., Coromandel International Ltd., Elixir Group, EuroChem Group AG, ForFarmers NV, Fosfitalia S.p.A, Groupe Roullier, Hubei Xingfa Chemicals Group Co. Ltd., Israel Chemicals Ltd., JR Simplot Co, Land O Lakes Inc., Nutrien Ltd., Paradeep Phosphates Limited, Phibro Animal Health Corp., PhosAgro Group of Companies, Prayon SA, The Mosaic Co., Yara International ASA are a few of the key vendors in the Feed Phosphate market.

APAC will register the highest growth rate of 43.7% among the other regions. Therefore, the Feed Phosphate market in APAC is expected to garner significant business opportunities for the vendors during the forecast period.

China, India, Japan, South Korea, Australia, Indonesia, US, Canada, Mexico, Germany, UK, France, Italy, The Netherlands, Spain, Saudi Arabia, UAE, South Africa, Israel, Turkey, Brazil, Argentina, Colombia

  • Escalating global demand for animal-derived protein is the driving factor this market.

The Feed Phosphate market vendors should focus on grabbing business opportunities from the Product segment as it accounted for the largest market share in the base year.