Fuel Flexible Boiler Market Analysis APAC, Europe, North America, Middle East and Africa, South America - China, US, India, Germany, Japan - Size and Forecast 2024-2028

Fuel Flexible Boiler Market Analysis APAC, Europe, North America, Middle East and Africa, South America - China, US, India, Germany, Japan - Size and Forecast 2024-2028

Published: Jul 2024 145 Pages SKU: IRTNTR72897

Market Overview at a Glance

$1.27 B
Market Opportunity
4.5%
CAGR
4.23
YoY growth 2023-2024(%)

Fuel Flexible Boiler Market Size 2024-2028 

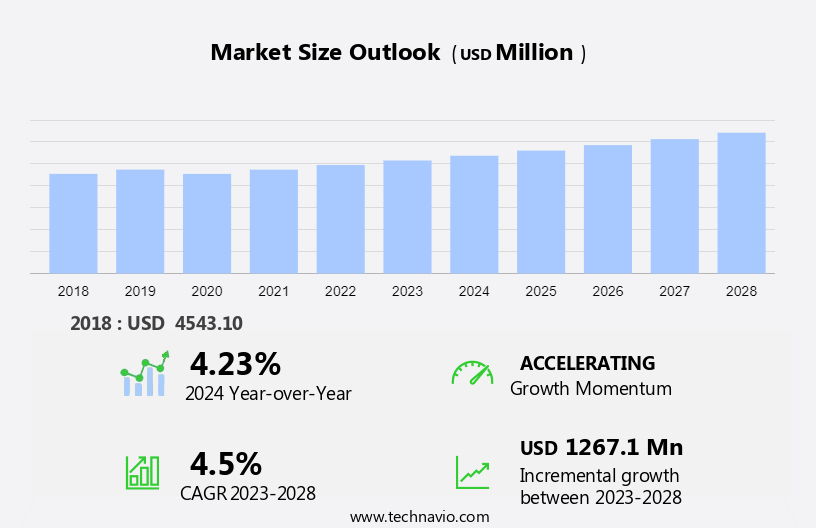
The fuel flexible boiler market size is forecast to increase by USD 1.26 billion, at a CAGR of 4.5% between 2023 and 2028. There is a rising demand for natural gas thermal power generation driven by global population growth and urbanization trends. As cities expand, there is an increasing need for reliable energy sources like natural gas to meet electricity demands efficiently. Regulatory frameworks are increasingly focused on reducing carbon footprints, prompting industries and utilities to adopt cleaner energy technologies. Natural gas, known for its lower carbon emissions compared to other fossil fuels, plays a pivotal role in these efforts. Governments worldwide are implementing stringent regulations to encourage the transition towards cleaner energy sources, promoting sustainable development and environmental stewardship. This shift underscores a concerted global effort to balance economic growth with environmental responsibility, ensuring energy security while mitigating the impact of greenhouse gas emissions on climate change.

What will be the Size of the Market During the Forecast Period?

Fuel Flexible Boiler Market Size

For More Highlights About this Report, Request Free Sample

Market Dynamic and Customer Landscape

In the realm of energy production, black coal remains a significant fuel feed system for thermal power generation, particularly in industries such as textile manufacturing. The evolution towards low-emission boilers underscores efforts to achieve decent combustion while minimizing environmental impact. These boilers are designed to handle various solid, liquid, and gaseous fuels, including biomass, promoting flexible fuel energy options to meet diverse energy needs. The evaluation of such systems involves ensuring coherent allocation of resources and adherence to stringent operational procedures to optimize efficiency. Ultimately, thermal power plants utilize turbines to convert heat energy into electricity, supporting industrial operations and urban infrastructure. As the global demand for sustainable energy solutions grows, innovations in coal-fired technologies continue to drive advancements in power generation, balancing economic feasibility with environmental stewardship in the pursuit of cleaner energy futures. In textile industries, the adoption of lowemission boiler is crucial for reducing environmental impact while meeting energy demands efficiently. These boilers adhere to stringent operational procedure to optimize combustion and minimize emissions. The steam generated by these boilers powers turbine, which convert thermal energy into mechanical energy to drive machinery in textile manufacturing processes. 

Key Market Driver

One of the key factors driving the global market growth is the increasing need for natural gas thermal power generation. To produce electricity, natural gas is used as fuel to run gas turbines. With the growing crisis of natural resource depletion, natural gas is an affordable option that generates electricity. Furthermore, natural gas plants are quick to build overbuilding nuclear or coal power generation plants.

Furthermore, the air quality tends to improve as smog emission reduces when switching to natural gas plants from coal plants. These factors will increase the usage of fuel flexible boilers in the natural gas thermal power plant. Between 2020 and 2050, in the AEO2021 reference model, the demand for geothermal power generation will significantly increase from coal industries. Thus, such contributing factors will drive the global market during the forecast period.

Significant Market Trend

Shifting trends toward low-emission natural gas is one of the key market trends that is expected to impact the industry positively in the forecast period. According to the US Environmental Protection Agency, methane emissions, from natural gas and petroleum systems, as well as abandoned oil and natural gas wells, accounted for around 29% of total US methane emissions and 30% of the total greenhouse gas emissions in 2019. Natural gas emits about 117 pounds of carbon dioxide per million British thermal units (MMBtu), compared to more than 200 pounds per MMBtu from coal and more than 160 pounds per MMBtu from distillate fuel oil. Thus, the governments are now taking positive steps in the right direction. More than 110 countries, including the European Union, Japan, and South Korea, have committed to carbon neutrality by 2050; China has stated that it will do it before 2060. Such factors will further support the market in the coming years.

Major Market Challenge

One of the key challenges to global market growth is resistance to slagging, fouling, and corrosion. Slagging accidents are projected to cost the worldwide utility business several billion dollars per year in lost power generation and equipment repair. Corrosion in boiler furnaces mainly occurs due to two reasons, mostly when dissolved oxygen enters the system through the feed water. Low pH within the boiler furnace is another prominent cause of corrosion in boiler systems. Carbon dioxide infiltration or contamination by other substances could cause the pH to drop. The oxygen creates pitting, which is usually localized. Pits are small but deep pinpoint holes that can eventually puncture tube walls, causing them to fall. Therefore, it is a major restraining factor for the global market during the forecast period.

Market Customer Landscape

The market forecasting report includes the adoption lifecycle of the market, covering from the innovator’s stage to the laggard’s stage. It focuses on adoption rates in different regions based on penetration. Furthermore, the report also includes key purchase criteria and drivers of price sensitivity to help companies evaluate and develop their market growth analysis strategies.
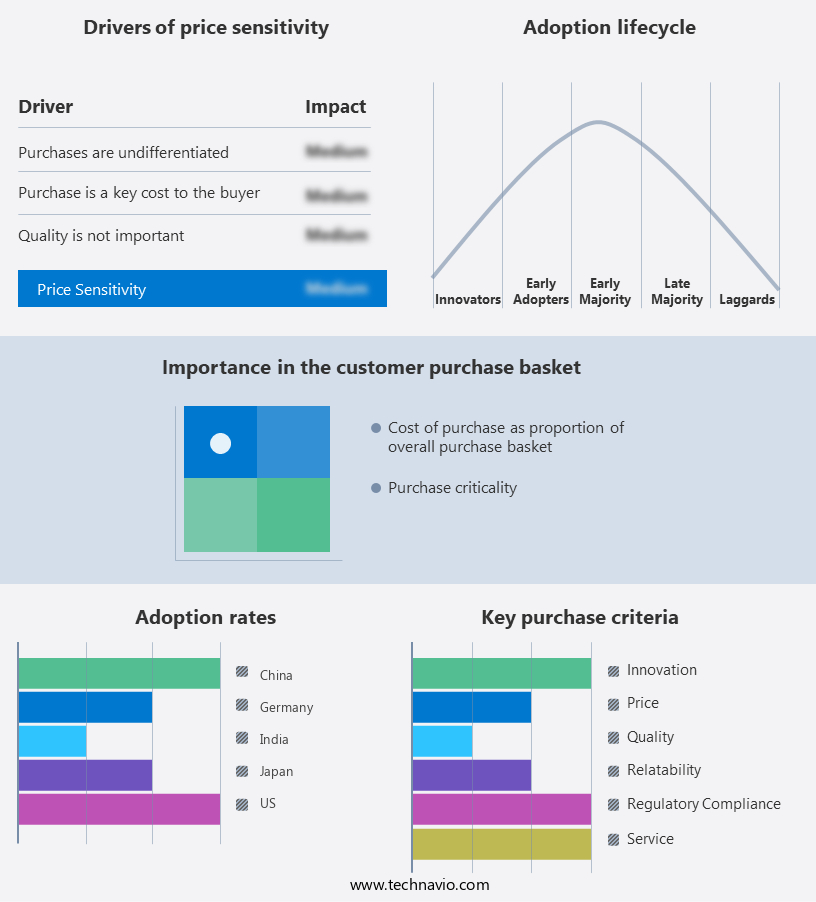
Fuel Flexible Boiler Market Share by Geography

 Customer Landscape

Key Companies & Market Insights

Companies are implementing various strategies, such as strategic alliances, partnerships, mergers and acquisitions, geographical expansion, and product/service launches, to enhance their presence in the market.

AE and E Nanjing Boiler Co. Ltd. - The company manufactures heat recovery steam generators, special boilers, power plant boilers, industry boilers, environment new energy equipment, and pressure vessels. 

The market research and growth report also includes detailed analyses of the competitive landscape of the market and information about key companies, including:

  • Alfa Laval AB
  • ALSTOM SA
  • Andritz AG
  • Babcock and Wilcox Enterprises Inc.
  • Bharat Heavy Electricals Ltd.
  • Cheema Boilers Ltd.
  • Doosan Heavy Industries and Construction Co. Ltd.
  • Fluor Corp.
  • General Electric Co.
  • Larsen and Toubro Ltd.
  • Mitsubishi Heavy Industries Ltd.
  • Parker Boiler Co.
  • RAJDEEP BOILER PVT. LTD.
  • Shanghai Electric Group Co.
  • Siemens AG
  • Thermax Ltd.
  • thyssenkrupp Industries India Pvt. Ltd.
  • Walchandnagar Industries Ltd.
  • Zhengzhou Boiler (Group) Co. Ltd.

Qualitative and quantitative analysis of companies has been conducted to help clients understand the wider business environment as well as the strengths and weaknesses of key market players. Data is qualitatively analyzed to categorize companies as pure play, category-focused, industry-focused, and diversified; it is quantitatively analyzed to categorize companies as dominant, leading, strong, tentative, and weak.

Market Segmentation

By End-user 

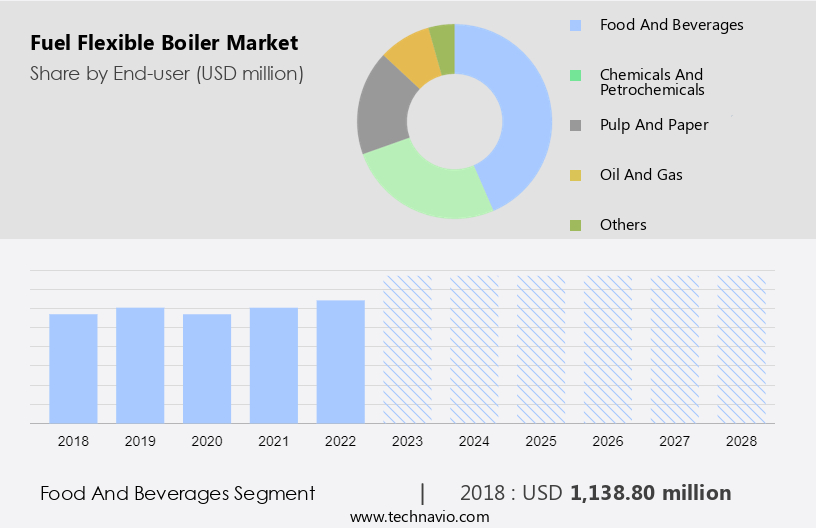
The food and beverages segment is estimated to witness significant growth during the forecast period.  The food and beverage industry is highly dependent on heat for food processing such as sterilization, blanching, and packaging. Every step of the food production process necessitates the use of heat. The use of direct heat or heat from hot water is critical in the food processing sector. Steam is utilized in the beverage industry for distillation, disinfecting, cooking, drying, and warming, as well as general cleaning processes. It is widely required in beverage processing, meat processing, food processing and packaging, poultry processing, and vegetable processing.

Fuel Flexible Boiler Market Size

Get a glance at the market share of various regions Download the PDF Sample

The food and beverages segment accounted for USD 1.13 billion in 2018.  Steam can also be used to kill microorganisms in the food processing industry. The boilers in the food sector typically use fossil fuels to produce heat for hot water for cleaning and cooking. Coal, natural gas, fuel, oil, and biomass are generally used in the food and beverage end-user segment. Fuel flexible boilers help in ensuring enhanced combustion and advanced heating with excellent fuel flexibility. For instance, the circulating fluidized bed (CFB) boiler is an advanced boiler produced by Velmet and has high fuel flexibility with high steam parameters suitable for food and beverage end-users.

Moreover, fuel flexible boiler includes steam boilers, hot water boilers, and thermal boilers. The flexible fuel boiler, such as gas fuel boilers, have advantages over regular boilers as they are of low pollution, have fuel channels, do not require storage room, save land usage, and have low infrastructure costs. Thus, the growing food and beverage industry will continue to drive the growth of the market in focus during the forecast period.

By Region

Fuel Flexible Boiler Market Share by Geography

For more insights on the market share of various regions Download PDF Sample now!

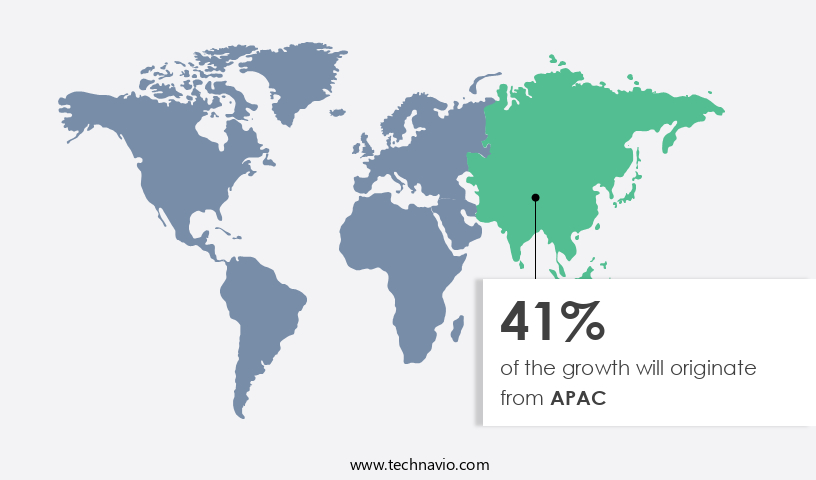
APAC is estimated to contribute 41% to the growth of the global market during the forecast period. Technavio’s analysts have elaborately explained the regional trends and drivers that shape the market during the forecast period.  APAC has dominated the fuel flexible boiler market and is expected to continue its dominance in the forecast period. The increasing urbanization and industrial development, particularly in emerging economies such as China, India, Malaysia, Thailand, and Vietnam, are the major contributing factors for the growth of the global fuel flexible boiler market. 

Moreover, the need for thermal power has been fueled by a rising population, rapid urbanization, and industrialization. As a result, there is a huge demand for technologies that can deliver larger output at cheaper costs while emitting fewer pollutants. In addition, governments across the APAC countries are looking for improved technical solutions in this area. This market is predicted to increase at a rapid rate in the future due to the need to replace aging inefficient boilers and the scarcity of black coal. India is the third-largest producer of electricity in the world. As of 31 December 2021, the national electric grid has an installed thermal power capacity of 93.389 GW in India.

Segment Overview

The market research report provides comprehensive data (region-wise segment analysis), with forecasts and estimates in "USD billion " for the period 2024-2028, as well as historical data from 2018 - 2022 for the following segments.

  • End User Outlook
    • Food and beverages
    • Chemicals and petrochemicals
    • Pulp and paper
    • Oil and gas
    • Others
  • Region Outlook
    • North America
      • The U.S.
      • Canada
    • Europe
      • U.K.
      • Germany
      • France
      • Rest of Europe
    • APAC
      • China
      • India
    • South America
      • Chile
      • Argentina
      • Brazil
    • Middle East & Africa
      • Saudi Arabia
      • South Africa
      • Rest of the Middle East & Africa

You may also interested in below market reports:

  • Boilers Market: Analysis APAC, North America, Europe, Middle East and Africa, South America - China, US, Germany, Japan, South Korea - Size and Forecast 

  • Flexible Epoxy Resin Market: by Application, End-user and Geography - Forecast and Analysis 

  • HVAC Market:  Analysis APAC, Europe, North America, Middle East and Africa, South America - US, China, Japan, Germany, UK - Size and Forecast

Market Analyst Overview

In the industrial landscape, low-emission boilers are pivotal in sectors like the textile, chemical, and sugar industries, where fuel flexible energy sources such as waste-derived fuels and brown coal are utilized. These flexible fuel boilers are capable of accommodating various types of fuel, optimizing carbon output while ensuring high energy and lower cost outputs. Modern technological advancements in thermal plants, including CFBC and AFBC technologies, enable efficient electricity generation by harnessing high-pressure steam for enhanced performance. Hydraulic systems with hydraulic motors and pumps facilitate fluid motion for powering external loads, adhering to stringent air pollution regulations by reducing emissions like carbon monoxide, heavy metals, and mitigating environmental impacts such as mercury and sulfur dioxide emissions, which contribute to acid rain. Automatic controls and precise designs ensure reliable operation and maintenance, supporting emerging and developing nations in achieving sustainable energy solutions for economic growth and environmental preservation.

Market Scope

Report Coverage

Details

Page number

145

Base year

2023

Historic period

2018 - 2022

Forecast period

2024-2028

Growth momentum & CAGR

Accelerate at a CAGR of 4.5%

Market growth 2024-2028

USD 1.26 billion

Market structure

Fragmented

YoY growth 2023-2024(%)

4.23

Regional analysis

APAC, Europe, North America, Middle East and Africa, and South America

Performing market contribution

APAC at 41%

Key countries

China, US, India, Germany, and Japan

Competitive landscape

Leading Companies, Market Positioning of Companies, Competitive Strategies, and Industry Risks

Key companies profiled

AE and E Nanjing Boiler Co. Ltd., Alfa Laval AB, ALSTOM SA, Andritz AG, Babcock and Wilcox Enterprises Inc., Bharat Heavy Electricals Ltd., Cheema Boilers Ltd., Doosan Heavy Industries and Construction Co. Ltd., Fluor Corp., General Electric Co., Larsen and Toubro Ltd., Mitsubishi Heavy Industries Ltd., Parker Boiler Co., RAJDEEP BOILER PVT. LTD., Shanghai Electric Group Co., Siemens AG, Thermax Ltd., thyssenkrupp Industries India Pvt. Ltd., Walchandnagar Industries Ltd., and Zhengzhou Boiler (Group) Co. Ltd.

Market dynamics

Parent market analysis, Market forecasting growth inducers and obstacles, Fast-growing and slow-growing segment analysis, COVID-19 impact and recovery analysis and future consumer dynamics, Market condition analysis for forecast period

Customization purview

If our market report has not included the data that you are looking for, you can reach out to our analysts and get segments customized.

Download PDF Sample

What are the Key Data Covered in this Market Forecast Report?

  • CAGR of the market during the forecast period
  • Detailed information on factors that will drive the market growth and forecasting of the market between 2024 and 2028
  • Precise estimation of the market size and its contribution to the parent market
  • Accurate predictions about upcoming market trends and analysis and changes in consumer behavior
  • Growth of the market across Europe, North America, APAC, South America, and Middle East and Africa
  • Thorough market growth analysis of the market’s competitive landscape and detailed information about companies
  • Comprehensive market analysis and report on the factors that will challenge the market research and growth of market companies

1 Executive Summary

  • 1.1 Market overview
    • Executive Summary - Chart on Market Overview
    • Executive Summary - Data Table on Market Overview
    • Executive Summary - Chart on Global Market Characteristics
    • Executive Summary - Chart on Market by Geography
    • Executive Summary - Chart on Market Segmentation by End-user
    • Executive Summary - Chart on Incremental Growth
    • Executive Summary - Data Table on Incremental Growth
    • Executive Summary - Chart on Company Market Positioning

2 Market Landscape

  • 2.1 Market ecosystem
    • Parent Market
    • Data Table on - Parent Market
  • 2.2 Market characteristics
    • Market characteristics analysis
  • 2.3 Value chain analysis
    • Value Chain Analysis

3 Market Sizing

  • 3.1 Market definition
    • Offerings of companies included in the market definition
  • 3.2 Market segment analysis
    • Market segments
  • 3.3 Market size 2023
    • 3.4 Market outlook: Forecast for 2023-2028
      • Chart on Global - Market size and forecast 2023-2028 ($ million)
      • Data Table on Global - Market size and forecast 2023-2028 ($ million)
      • Chart on Global Market: Year-over-year growth 2023-2028 (%)
      • Data Table on Global Market: Year-over-year growth 2023-2028 (%)

    4 Historic Market Size

    • 4.1 Global Fuel Flexible Boiler Market 2018 - 2022
      • Historic Market Size - Data Table on Global Fuel Flexible Boiler Market 2018 - 2022 ($ million)
    • 4.2 End-user segment analysis 2018 - 2022
      • Historic Market Size - End-user Segment 2018 - 2022 ($ million)
    • 4.3 Geography segment analysis 2018 - 2022
      • Historic Market Size - Geography Segment 2018 - 2022 ($ million)
    • 4.4 Country segment analysis 2018 - 2022
      • Historic Market Size - Country Segment 2018 - 2022 ($ million)

    5 Five Forces Analysis

    • 5.1 Five forces summary
      • Five forces analysis - Comparison between 2023 and 2028
    • 5.2 Bargaining power of buyers
      • Bargaining power of buyers - Impact of key factors 2023 and 2028
    • 5.3 Bargaining power of suppliers
      • Bargaining power of suppliers - Impact of key factors in 2023 and 2028
    • 5.4 Threat of new entrants
      • Threat of new entrants - Impact of key factors in 2023 and 2028
    • 5.5 Threat of substitutes
      • Threat of substitutes - Impact of key factors in 2023 and 2028
    • 5.6 Threat of rivalry
      • Threat of rivalry - Impact of key factors in 2023 and 2028
    • 5.7 Market condition
      • Chart on Market condition - Five forces 2023 and 2028

    6 Market Segmentation by End-user

    • 6.1 Market segments
      • Chart on End-user - Market share 2023-2028 (%)
      • Data Table on End-user - Market share 2023-2028 (%)
    • 6.2 Comparison by End-user
      • Chart on Comparison by End-user
      • Data Table on Comparison by End-user
    • 6.3 Food and beverages - Market size and forecast 2023-2028
      • Chart on Food and beverages - Market size and forecast 2023-2028 ($ million)
      • Data Table on Food and beverages - Market size and forecast 2023-2028 ($ million)
      • Chart on Food and beverages - Year-over-year growth 2023-2028 (%)
      • Data Table on Food and beverages - Year-over-year growth 2023-2028 (%)
    • 6.4 Chemicals and petrochemicals - Market size and forecast 2023-2028
      • Chart on Chemicals and petrochemicals - Market size and forecast 2023-2028 ($ million)
      • Data Table on Chemicals and petrochemicals - Market size and forecast 2023-2028 ($ million)
      • Chart on Chemicals and petrochemicals - Year-over-year growth 2023-2028 (%)
      • Data Table on Chemicals and petrochemicals - Year-over-year growth 2023-2028 (%)
    • 6.5 Pulp and paper - Market size and forecast 2023-2028
      • Chart on Pulp and paper - Market size and forecast 2023-2028 ($ million)
      • Data Table on Pulp and paper - Market size and forecast 2023-2028 ($ million)
      • Chart on Pulp and paper - Year-over-year growth 2023-2028 (%)
      • Data Table on Pulp and paper - Year-over-year growth 2023-2028 (%)
    • 6.6 Oil and gas - Market size and forecast 2023-2028
      • Chart on Oil and gas - Market size and forecast 2023-2028 ($ million)
      • Data Table on Oil and gas - Market size and forecast 2023-2028 ($ million)
      • Chart on Oil and gas - Year-over-year growth 2023-2028 (%)
      • Data Table on Oil and gas - Year-over-year growth 2023-2028 (%)
    • 6.7 Others - Market size and forecast 2023-2028
      • Chart on Others - Market size and forecast 2023-2028 ($ million)
      • Data Table on Others - Market size and forecast 2023-2028 ($ million)
      • Chart on Others - Year-over-year growth 2023-2028 (%)
      • Data Table on Others - Year-over-year growth 2023-2028 (%)
    • 6.8 Market opportunity by End-user
      • Market opportunity by End-user ($ million)
      • Data Table on Market opportunity by End-user ($ million)

    7 Customer Landscape

    • 7.1 Customer landscape overview
      • Analysis of price sensitivity, lifecycle, customer purchase basket, adoption rates, and purchase criteria

    8 Geographic Landscape

    • 8.1 Geographic segmentation
      • Chart on Market share by geography 2023-2028 (%)
      • Data Table on Market share by geography 2023-2028 (%)
    • 8.2 Geographic comparison
      • Chart on Geographic comparison
      • Data Table on Geographic comparison
    • 8.3 APAC - Market size and forecast 2023-2028
      • Chart on APAC - Market size and forecast 2023-2028 ($ million)
      • Data Table on APAC - Market size and forecast 2023-2028 ($ million)
      • Chart on APAC - Year-over-year growth 2023-2028 (%)
      • Data Table on APAC - Year-over-year growth 2023-2028 (%)
    • 8.4 Europe - Market size and forecast 2023-2028
      • Chart on Europe - Market size and forecast 2023-2028 ($ million)
      • Data Table on Europe - Market size and forecast 2023-2028 ($ million)
      • Chart on Europe - Year-over-year growth 2023-2028 (%)
      • Data Table on Europe - Year-over-year growth 2023-2028 (%)
    • 8.5 North America - Market size and forecast 2023-2028
      • Chart on North America - Market size and forecast 2023-2028 ($ million)
      • Data Table on North America - Market size and forecast 2023-2028 ($ million)
      • Chart on North America - Year-over-year growth 2023-2028 (%)
      • Data Table on North America - Year-over-year growth 2023-2028 (%)
    • 8.6 Middle East and Africa - Market size and forecast 2023-2028
      • Chart on Middle East and Africa - Market size and forecast 2023-2028 ($ million)
      • Data Table on Middle East and Africa - Market size and forecast 2023-2028 ($ million)
      • Chart on Middle East and Africa - Year-over-year growth 2023-2028 (%)
      • Data Table on Middle East and Africa - Year-over-year growth 2023-2028 (%)
    • 8.7 South America - Market size and forecast 2023-2028
      • Chart on South America - Market size and forecast 2023-2028 ($ million)
      • Data Table on South America - Market size and forecast 2023-2028 ($ million)
      • Chart on South America - Year-over-year growth 2023-2028 (%)
      • Data Table on South America - Year-over-year growth 2023-2028 (%)
    • 8.8 China - Market size and forecast 2023-2028
      • Chart on China - Market size and forecast 2023-2028 ($ million)
      • Data Table on China - Market size and forecast 2023-2028 ($ million)
      • Chart on China - Year-over-year growth 2023-2028 (%)
      • Data Table on China - Year-over-year growth 2023-2028 (%)
    • 8.9 US - Market size and forecast 2023-2028
      • Chart on US - Market size and forecast 2023-2028 ($ million)
      • Data Table on US - Market size and forecast 2023-2028 ($ million)
      • Chart on US - Year-over-year growth 2023-2028 (%)
      • Data Table on US - Year-over-year growth 2023-2028 (%)
    • 8.10 India - Market size and forecast 2023-2028
      • Chart on India - Market size and forecast 2023-2028 ($ million)
      • Data Table on India - Market size and forecast 2023-2028 ($ million)
      • Chart on India - Year-over-year growth 2023-2028 (%)
      • Data Table on India - Year-over-year growth 2023-2028 (%)
    • 8.11 Germany - Market size and forecast 2023-2028
      • Chart on Germany - Market size and forecast 2023-2028 ($ million)
      • Data Table on Germany - Market size and forecast 2023-2028 ($ million)
      • Chart on Germany - Year-over-year growth 2023-2028 (%)
      • Data Table on Germany - Year-over-year growth 2023-2028 (%)
    • 8.12 Japan - Market size and forecast 2023-2028
      • Chart on Japan - Market size and forecast 2023-2028 ($ million)
      • Data Table on Japan - Market size and forecast 2023-2028 ($ million)
      • Chart on Japan - Year-over-year growth 2023-2028 (%)
      • Data Table on Japan - Year-over-year growth 2023-2028 (%)
    • 8.13 Market opportunity by geography
      • Market opportunity by geography ($ million)
      • Data Tables on Market opportunity by geography ($ million)

    9 Drivers, Challenges, and Opportunity/Restraints

    • 9.1 Market drivers
      • 9.2 Market challenges
        • 9.3 Impact of drivers and challenges
          • Impact of drivers and challenges in 2023 and 2028
        • 9.4 Market opportunities/restraints

          10 Competitive Landscape

          • 10.1 Overview
            • 10.2 Competitive Landscape
              • Overview on criticality of inputs and factors of differentiation
            • 10.3 Landscape disruption
              • Overview on factors of disruption
            • 10.4 Industry risks
              • Impact of key risks on business

            11 Competitive Analysis

            • 11.1 Companies profiled
              • Companies covered
            • 11.2 Market positioning of companies
              • Matrix on companies position and classification
            • 11.3 AE and E Nanjing Boiler Co. Ltd.
              • AE and E Nanjing Boiler Co. Ltd. - Overview
              • AE and E Nanjing Boiler Co. Ltd. - Product / Service
              • AE and E Nanjing Boiler Co. Ltd. - Key offerings
            • 11.4 Alfa Laval AB
              • Alfa Laval AB - Overview
              • Alfa Laval AB - Business segments
              • Alfa Laval AB - Key news
              • Alfa Laval AB - Key offerings
              • Alfa Laval AB - Segment focus
            • 11.5 ALSTOM SA
              • ALSTOM SA - Overview
              • ALSTOM SA - Business segments
              • ALSTOM SA - Key news
              • ALSTOM SA - Key offerings
              • ALSTOM SA - Segment focus
            • 11.6 Bharat Heavy Electricals Ltd.
              • Bharat Heavy Electricals Ltd. - Overview
              • Bharat Heavy Electricals Ltd. - Business segments
              • Bharat Heavy Electricals Ltd. - Key news
              • Bharat Heavy Electricals Ltd. - Key offerings
              • Bharat Heavy Electricals Ltd. - Segment focus
            • 11.7 Doosan Heavy Industries and Construction Co. Ltd.
              • Doosan Heavy Industries and Construction Co. Ltd. - Overview
              • Doosan Heavy Industries and Construction Co. Ltd. - Business segments
              • Doosan Heavy Industries and Construction Co. Ltd. - Key offerings
              • Doosan Heavy Industries and Construction Co. Ltd. - Segment focus
            • 11.8 Larsen and Toubro Ltd.
              • Larsen and Toubro Ltd. - Overview
              • Larsen and Toubro Ltd. - Business segments
              • Larsen and Toubro Ltd. - Key news
              • Larsen and Toubro Ltd. - Key offerings
              • Larsen and Toubro Ltd. - Segment focus
            • 11.9 Mitsubishi Heavy Industries Ltd.
              • Mitsubishi Heavy Industries Ltd. - Overview
              • Mitsubishi Heavy Industries Ltd. - Business segments
              • Mitsubishi Heavy Industries Ltd. - Key news
              • Mitsubishi Heavy Industries Ltd. - Key offerings
              • Mitsubishi Heavy Industries Ltd. - Segment focus
            • 11.10 Shanghai Electric Group Co.
              • Shanghai Electric Group Co. - Overview
              • Shanghai Electric Group Co. - Product / Service
              • Shanghai Electric Group Co. - Key offerings
            • 11.11 Siemens AG
              • Siemens AG - Overview
              • Siemens AG - Business segments
              • Siemens AG - Key news
              • Siemens AG - Key offerings
              • Siemens AG - Segment focus
            • 11.12 thyssenkrupp Industries India Pvt. Ltd.
              • thyssenkrupp Industries India Pvt. Ltd. - Overview
              • thyssenkrupp Industries India Pvt. Ltd. - Product / Service
              • thyssenkrupp Industries India Pvt. Ltd. - Key offerings

            12 Appendix

            • 12.1 Scope of the report
              • 12.2 Inclusions and exclusions checklist
                • Inclusions checklist
                • Exclusions checklist
              • 12.3 Currency conversion rates for US$
                • Currency conversion rates for US$
              • 12.4 Research methodology
                • Research methodology
              • 12.5 Data procurement
                • Information sources
              • 12.6 Data validation
                • Data validation
              • 12.7 Validation techniques employed for market sizing
                • Validation techniques employed for market sizing
              • 12.8 Data synthesis
                • Data synthesis
              • 12.9 360 degree market analysis
                • 360 degree market analysis
              • 12.10 List of abbreviations
                • List of abbreviations

              Research Methodology

              Technavio presents a detailed picture of the market by way of study, synthesis, and summation of data from multiple sources. The analysts have presented the various facets of the market with a particular focus on identifying the key industry influencers. The data thus presented is comprehensive, reliable, and the result of extensive research, both primary and secondary.

              INFORMATION SOURCES

              Primary sources

              • Manufacturers and suppliers
              • Channel partners
              • Industry experts
              • Strategic decision makers

              Secondary sources

              • Industry journals and periodicals
              • Government data
              • Financial reports of key industry players
              • Historical data
              • Press releases

              DATA ANALYSIS

              Data Synthesis

              • Collation of data
              • Estimation of key figures
              • Analysis of derived insights

              Data Validation

              • Triangulation with data models
              • Reference against proprietary databases
              • Corroboration with industry experts

              REPORT WRITING

              Qualitative

              • Market drivers
              • Market challenges
              • Market trends
              • Five forces analysis

              Quantitative

              • Market size and forecast
              • Market segmentation
              • Geographical insights
              • Competitive landscape

              Interested in this report?

              Get your sample now to see our research methodology and insights!

              Download Now

              Frequently Asked Questions

              Fuel Flexible Boiler market growth will increase by $ 1267.1 mn during 2024-2028.

              The Fuel Flexible Boiler market is expected to grow at a CAGR of 4.5% during 2024-2028.

              Fuel Flexible Boiler market is segmented by End-user( Food and beverages, Chemicals and petrochemicals, Pulp and paper, Oil and gas, Others)

              AE and E Nanjing Boiler Co. Ltd., Alfa Laval AB, ALSTOM SA, Andritz AG, Babcock and Wilcox Enterprises Inc., Bharat Heavy Electricals Ltd., Cheema Boilers Ltd., Doosan Heavy Industries and Construction Co. Ltd., Fluor Corp., General Electric Co., Larsen and Toubro Ltd., Mitsubishi Heavy Industries Ltd., Parker Boiler Co., RAJDEEP BOILER PVT. LTD., Shanghai Electric Group Co., Siemens AG, Thermax Ltd., thyssenkrupp Industries India Pvt. Ltd., Walchandnagar Industries Ltd., Zhengzhou Boiler (Group) Co. Ltd. are a few of the key vendors in the Fuel Flexible Boiler market.

              APAC will register the highest growth rate of 41% among the other regions. Therefore, the Fuel Flexible Boiler market in APAC is expected to garner significant business opportunities for the vendors during the forecast period.

              China, US, India, Germany, Japan

              • Increasing need for natural gas thermal power generationThe worldwide thermal power plant is primarily driven by rising energy demand is the driving factor this market.
              • which is predicted to boost coal-fired power production industry growth. This can be due to the growing population is the driving factor this market.
              • which is increasing the demand for housing. The market for thermal power plants is expected to grow due to rapid industrialization and the high requirement for energy in heavy industries. As a result is the driving factor this market.
              • the market is expected to develop to meet the growing need for thermal power from several different industries such as machine tools is the driving factor this market.
              • heavy electrical is the driving factor this market.
              • industrial machinery is the driving factor this market.
              • and auto industry. To produce electricity is the driving factor this market.
              • natural gas is used as fuel to run gas turbines. As growing crisis of natural resources depletion is the driving factor this market.
              • natural gas is an affordable option which generates electricity. Natural gas is used for heating and generating electricity is the driving factor this market.
              • therefore is the driving factor this market.
              • fuel flexible boilers usage to maintain furnace temperature is extremely crucial. Furthermore is the driving factor this market.
              • the natural gas plants are quick to build over building nuclear or coal power generation plant. Also is the driving factor this market.
              • the air quality tends to improve as smog emission reduces when switching to natural gas plants from coal plants. These factors will increase the usage of fuel flexible boiler in the natural gas thermal power plant. Natural gas enables the transition away from highly polluting coal in industries is the driving factor this market.
              • transportation is the driving factor this market.
              • and resistance. Between 2020 and 2050 is the driving factor this market.
              • in the AEO2021 reference model is the driving factor this market.
              • the demand for natural gas for the thermal power generation will significantly increase from coal industries. Thus is the driving factor this market.
              • such contributing factors will drive the global fuel flexible boiler market during the forecast period. is the driving factor this market.

              The Fuel Flexible Boiler market vendors should focus on grabbing business opportunities from the Food and beverages segment as it accounted for the largest market share in the base year.
              RIA - Research AI Assistant
              Ask RIA