Gas Sensors Market in North America by Type and Geography - Forecast and Analysis 2022-2026

Gas Sensors Market in North America by Type and Geography - Forecast and Analysis 2022-2026

Published: Mar 2022 120 Pages SKU: IRTNTR72738

Market Overview at a Glance

$173.76 Mn
Market Opportunity
9.38%
CAGR
YoY growth 2020-2021(%)

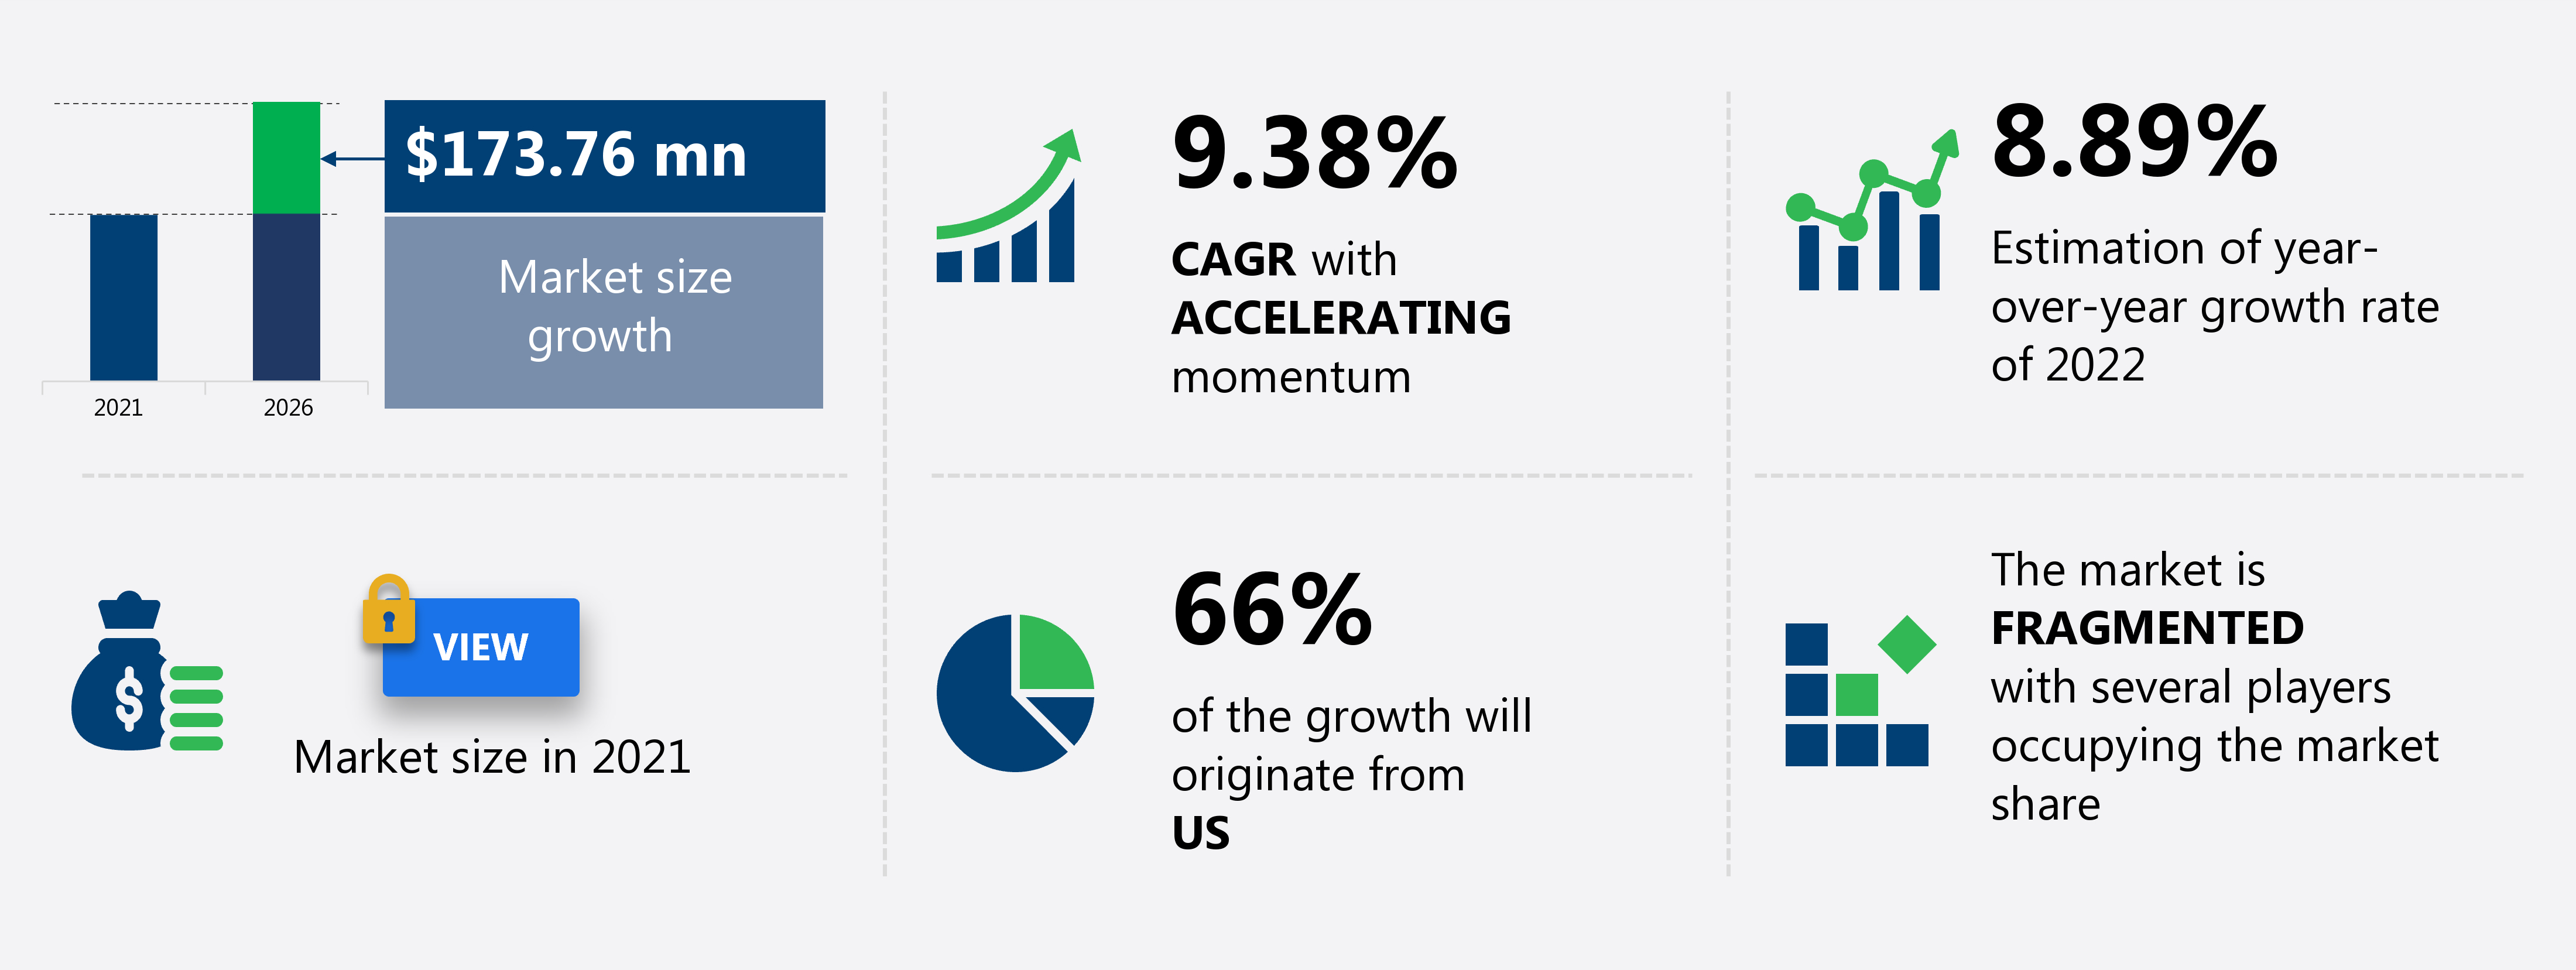
The gas sensors market share in North America is expected to increase by USD 173.76 million from 2021 to 2026, and the market’s growth momentum will accelerate at a CAGR of 9.38%.

This gas sensors market in North America research report provides valuable insights on the post COVID-19 impact on the market, which will help companies evaluate their business approaches. Furthermore, this report extensively covers gas sensors market in North America segmentations by type (wired and wireless) and geography (US, Canada, and Mexico). The gas sensors market in North America report also offers information on several market vendors, including Control Instruments Corp., DOD Technologies Inc., Dragerwerk AG and Co. KGaA, Edinburgh Instruments Ltd., Figaro Engineering Inc., Gas-Sensing.com, Mettler Toledo International Inc., SIARGO Ltd., SPEC Sensors, LLC, and Zhengzhou Winsen Electronics Technology Co Ltd. among others.

What will the Gas Sensors Market Size in North America be During the Forecast Period?

Download the Free Report Sample to Unlock the Gas Sensors Market Size in North America for the Forecast Period and Other Important Statistics


Gas Sensors Market in North America: Key Drivers, Trends, and Challenges

The increase in LNG trade is notably driving the gas sensors market growth in North America, although factors such as price volatility in the oil and gas industry may impede the market growth. Our research analysts have studied the historical data and deduced the key market drivers and the COVID-19 pandemic impact on the gas sensors industry in North America. The holistic analysis of the drivers will help in deducing end goals and refining marketing strategies to gain a competitive edge.

Key Gas Sensors Market Driver in North America

The increase in LNG trade is one of the key drivers supporting the gas sensors market growth in North America. In 2021, the US was the largest producer of natural gas globally. Natural gas supplies about one-third of the US primary energy consumption, with its primary uses being heating and generating electricity. While the majority of it is delivered in its gaseous form via pipeline in the US, the growth in the international market for natural gas has led to the use of it in a liquefied form, or LNG. For instance, according to the US Energy Information Administration (EIA), natural gas marketed production will increase to an average of 104.4 billion cubic feet per day (Bcf/d) in 2022 and then further increase to a record-high of 106.6 Bcf/d in 2023. Thus, rising LNG production and use in the region would further bolster the demand for gas sensors in North America during the forecast period.

Key Gas Sensors Market Trend in North America

Increasing adoption of IoT products is one of the key gas sensors market trends in North America that is contributing to the market growth. Sensors used in the gas industry are IoT enabled, which provide a high level of accuracy, reliability, and flexibility for a variety of applications in the industry, which further includes remote monitoring, condition monitoring, and analysis. Furthermore, gas sensors are primarily used to measure the pressure, level, flow, and temperature of the gas. Meanwhile, governments across the region are approving rules to encourage the adoption of IoT technology to increase efficiency, downtime, and operational costs. According to Oxford Economics, the use of IoT in the gas industry could boost the global GDP by $816 billion between 2018 and 2028. As a result, it will further drive the adoption of gas sensors in North America during the forecast period.

Key Gas Sensors Market Challenge in North America

Price volatility in the oil and gas industry is one of the factors hindering the gas sensors market growth in North America. The oil and gas industry is a major consumer of gas sensors. The need for continuous monitoring of high-value assets throughout the upstream, midstream, and downstream industries makes the oil and gas industry highly dependable on sensors. Therefore, the slowdown in the oil and gas industry due to price volatility can adversely affect the growth of the market. For instance, crude oil prices have fallen significantly since the beginning of 2020, which was attributed to the economic contraction caused by the COVID-19 and, in a span of a month, a sudden increase in crude oil supply following the suspension of agreed production cuts among the Organization of the Petroleum Exporting Countries (OPEC) and partner countries. Moreover, with the declined demand and increasing supply, daily price changes for the US crude oil have become extremely volatile. Such factors are limiting the market growth.

This gas sensors market in North America analysis report also provides detailed information on other upcoming trends and challenges that will have a far-reaching effect on the market growth. The actionable insights on the trends and challenges will help companies evaluate and develop growth strategies for 2022-2026.

Parent Market Analysis

Technavio categorizes the gas sensors market in North America as a part of the global electronic equipment and instruments market. Our research report has extensively covered external factors influencing the parent market growth potential in the coming years, which will determine the levels of growth of the gas sensors market in North America during the forecast period.

Who are the Major Gas Sensors Market Vendors in North America?

The report analyzes the market’s competitive landscape and offers information on several market vendors, including:


  • Control Instruments Corp.
  • DOD Technologies Inc.
  • Dragerwerk AG and Co. KGaA
  • Edinburgh Instruments Ltd.
  • Figaro Engineering Inc.
  • Gas-Sensing.com
  • Mettler Toledo International Inc.
  • SIARGO Ltd.
  • SPEC Sensors, LLC
  • Zhengzhou Winsen Electronics Technology Co Ltd.


This statistical study of the gas sensors market in North America encompasses successful business strategies deployed by the key vendors. The gas sensors market in North America is fragmented and the vendors are deploying organic and inorganic growth strategies to compete in the market.

Product Insights and News

  • Control Instruments Corp. - The company offers gas sensors that is designed for indoor and outdoor area monitoring installations and report the readings from up to four sensors including catalytic sensors for lfl monitoring and electrochemical sensors for oxygen and toxic gas monitoring.
  • DOD Technologies Inc. - The company offers gas sensors that include fixed gas detectors detector, portable gas detectors, specialty monitors, controllers, chemotic detectors, toxic gas handhelds.
  • Dragerwerk AG and Co. KGaA - The company offers gas sensors that includes portable gas detection, fixed gas detection, single gas detectors, multi gas detectors, tubes, connected solutions.

To make the most of the opportunities and recover from post COVID-19 impact, market vendors should focus more on the growth prospects in the fast-growing segments, while maintaining their positions in the slow-growing segments.

The gas sensors market in North America forecast report offers in-depth insights into key vendor profiles. The profiles include information on the production, sustainability, and prospects of the leading companies.

Gas Sensors Market In North America Value Chain Analysis

Our report provides extensive information on the value chain analysis for the gas sensors market in North America, which vendors can leverage to gain a competitive advantage during the forecast period. The end-to-end understanding of the value chain is essential in profit margin optimization and evaluation of business strategies. The data available in our value chain analysis segment can help vendors drive costs and enhance customer services during the forecast period.

The value chain of the electronic equipment and instruments market includes the following core components:

  • Inputs
  • Inbound logistics
  • Operations
  • Outbound logistics
  • Marketing and sales
  • After-sales service
  • Support activities
  • Innovation

The report has further elucidated on other innovative approaches being followed by service providers to ensure a sustainable market presence.


Which are the Key Regions for Gas Sensors Market in North America?

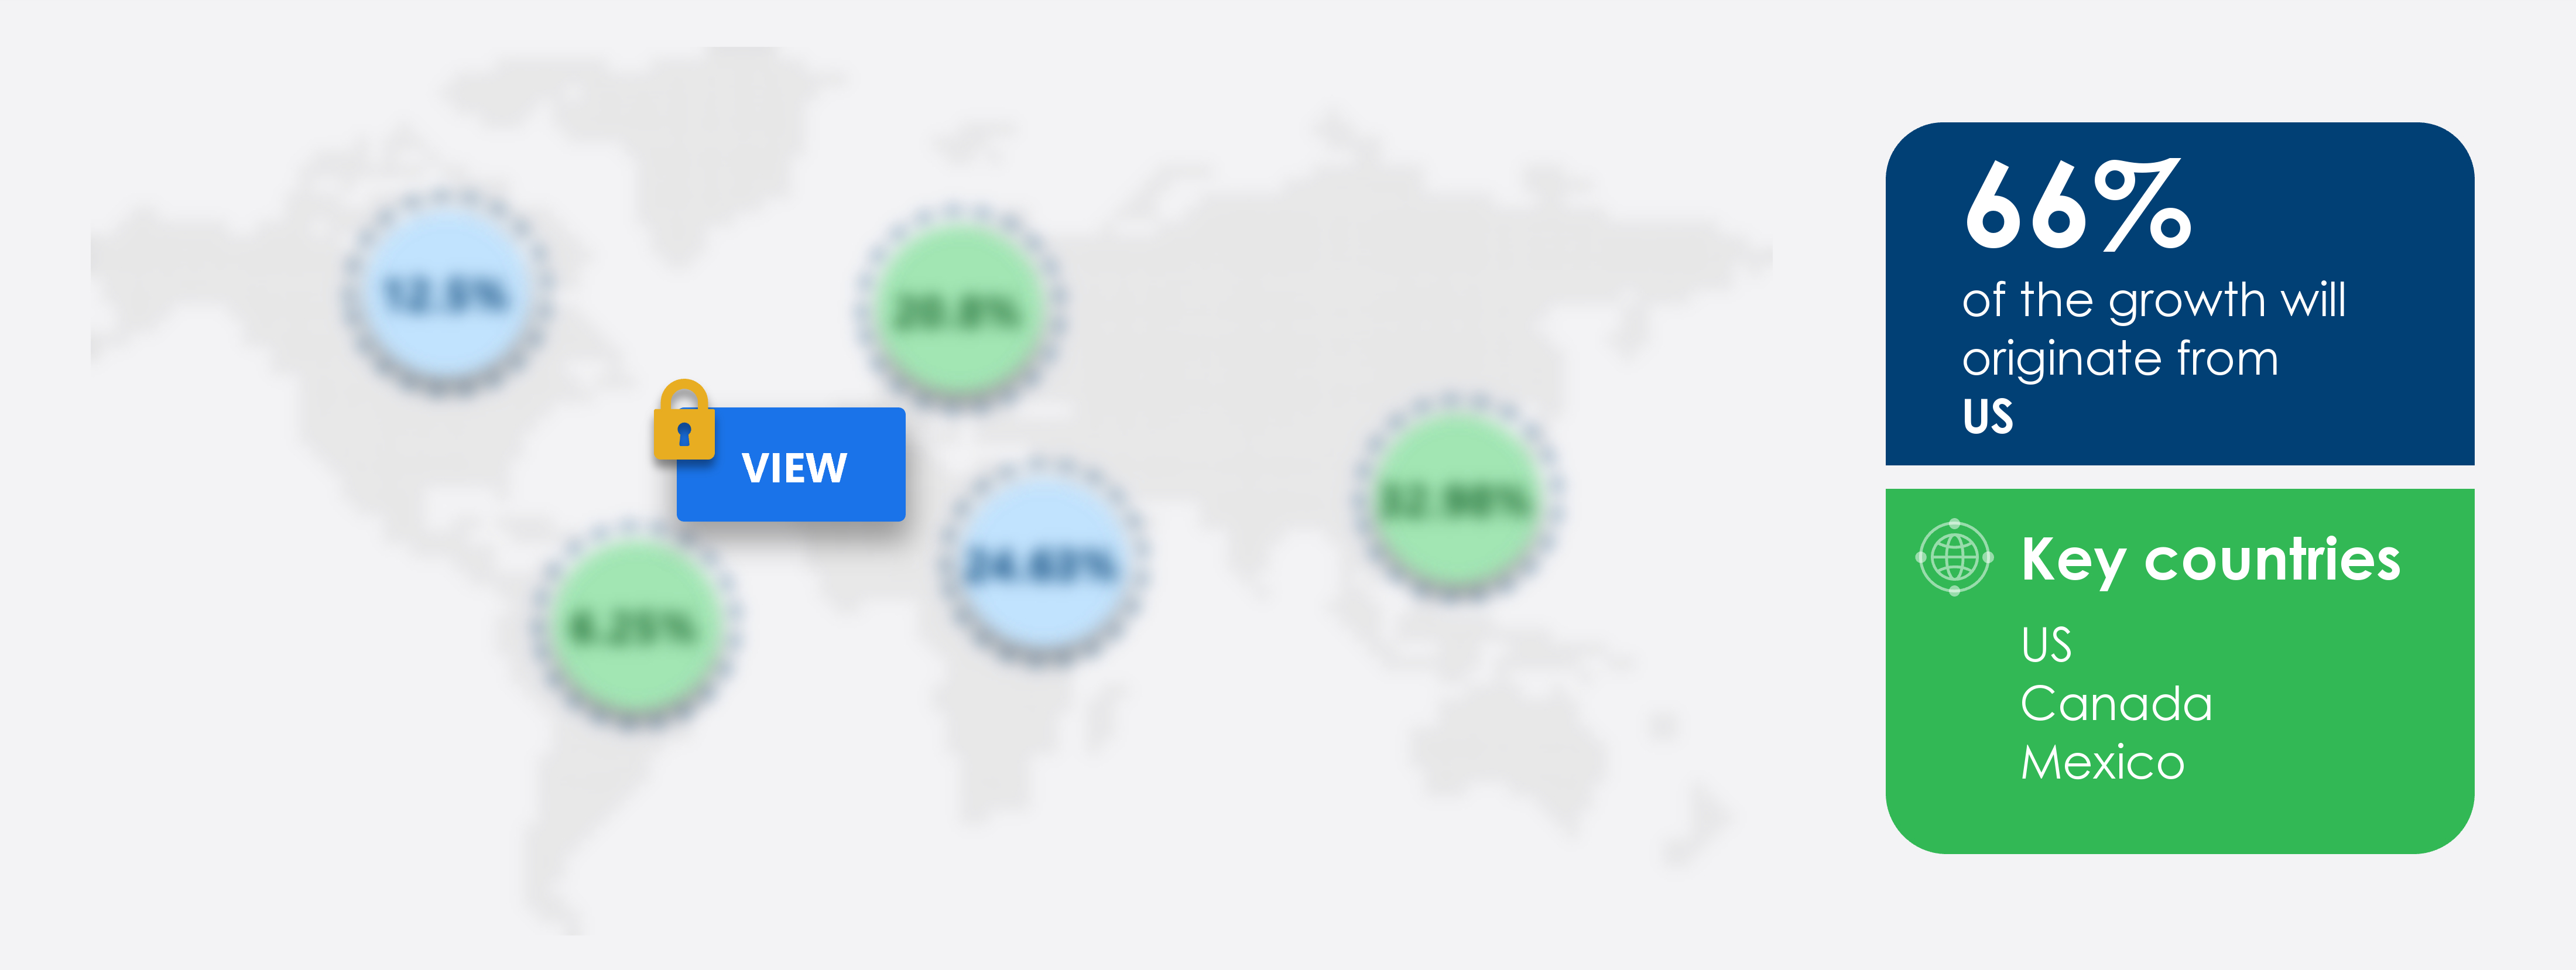
For more insights on the market share of various regions Request for a FREE sample now!

66% of the market’s growth will originate from the US during the forecast period. The US is the key market for gas sensors market in North America. Market growth in this region will be slower than the growth of the market in other regions.

The growing gas industry will facilitate the gas sensors market growth in the US over the forecast period. This market research report entails detailed information on the competitive intelligence, marketing gaps, and regional opportunities in store for vendors, which will assist in creating efficient business plans.

COVID Impact and Recovery Analysis

The country was among the severely affected by the COVID-19 pandemic in the region. Moreover, the pandemic has caused heavy losses to various industries in the region, which can delay the ongoing construction of LNG plants. Such factors can hinder the market growth during the forecast period.

What are the Revenue-generating Type Segments in the Gas Sensors Market in North America?

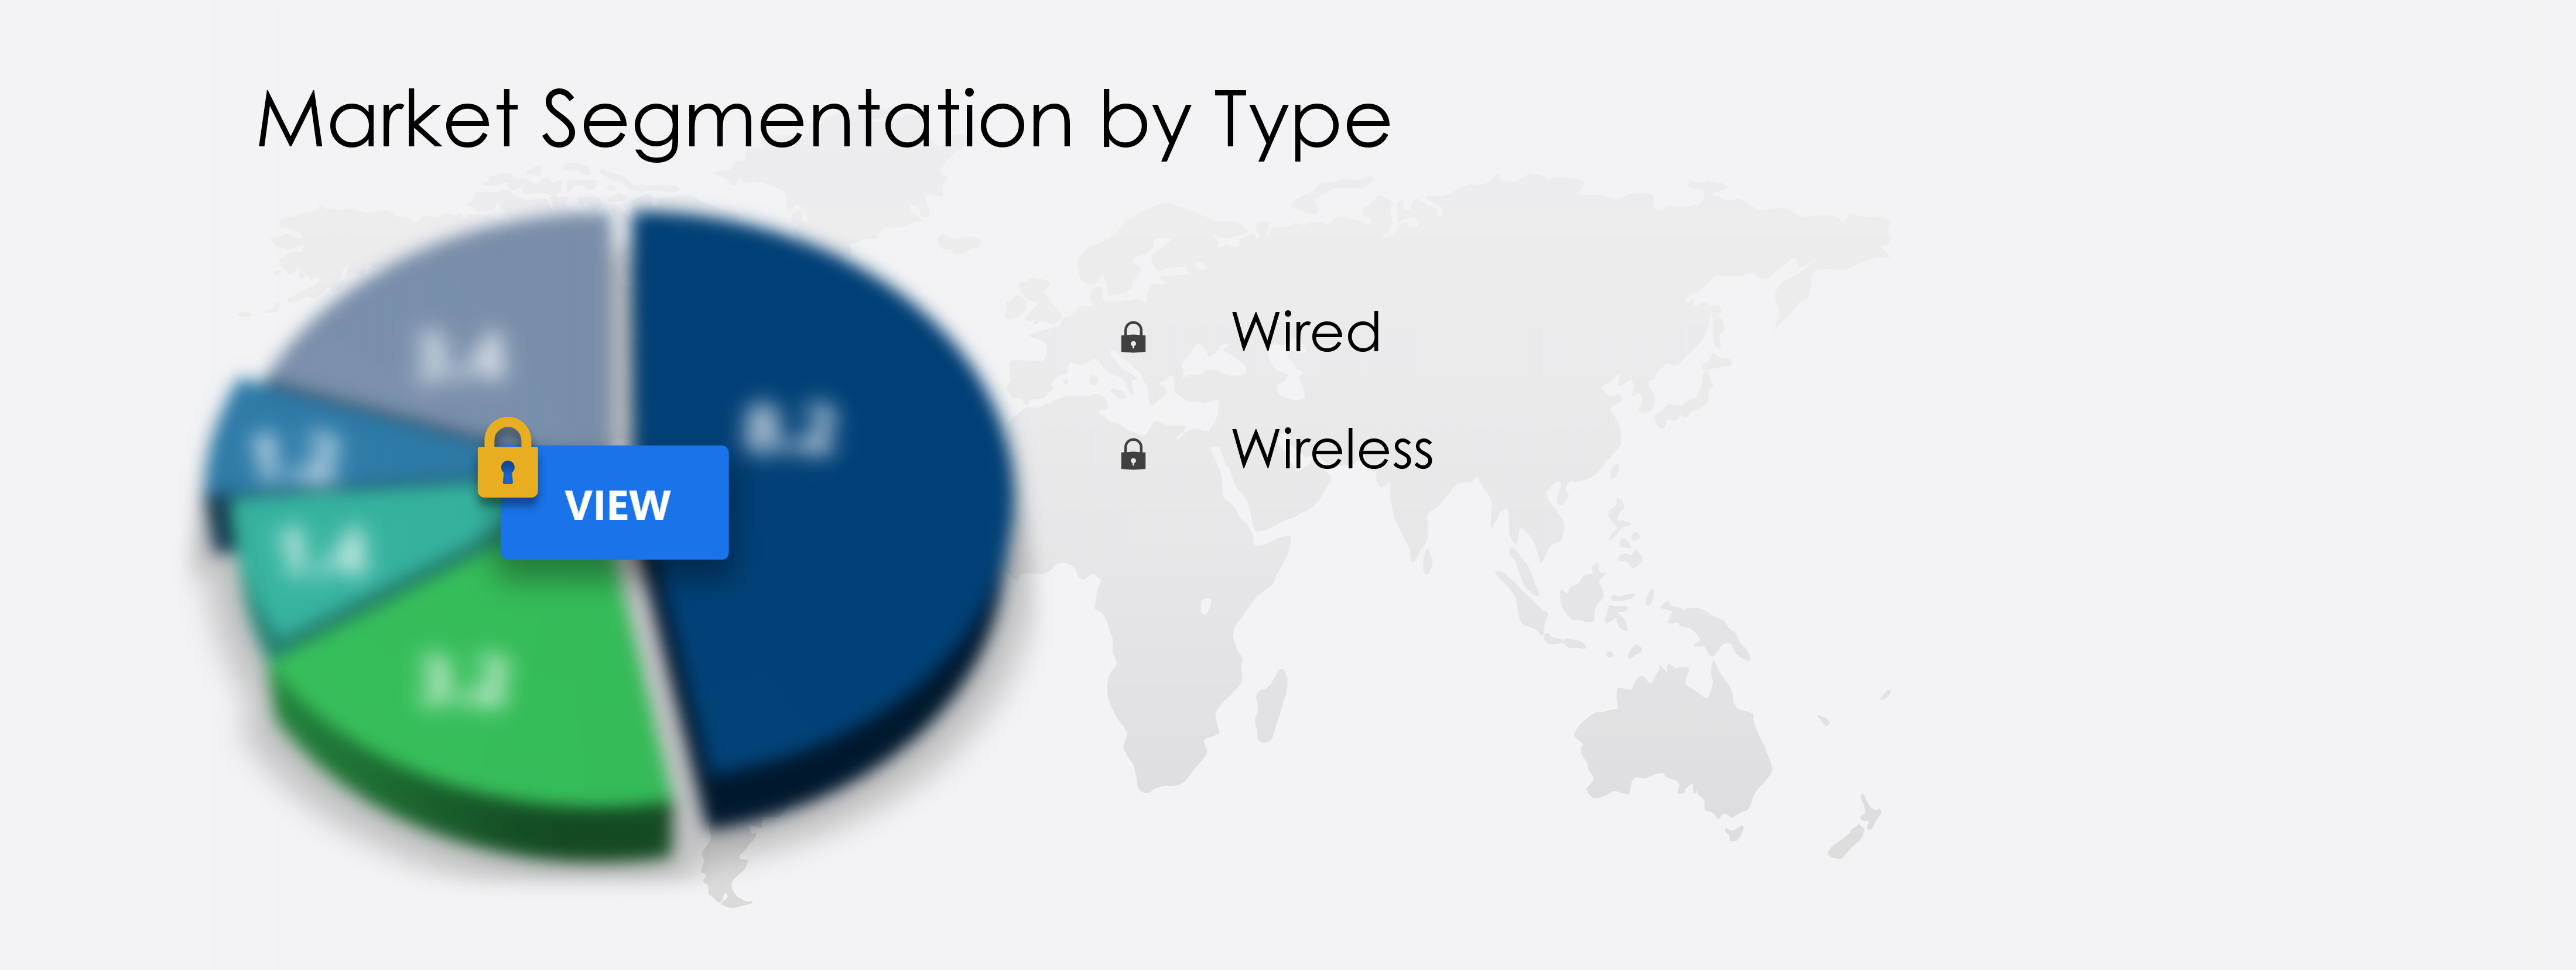
To gain further insights on the market contribution of various segments Request for a FREE sample

The gas sensors market share growth in North America by the wired segment will be significant during the forecast period. The wired segment has captured the highest market share in the gas sensors market in North America in 2021. This is attributed to the increasing exploration and production activities in the industry, which would further surge the installation of sensors for accurate monitoring of overall operations.  Furthermore, wired sensors have high reliability, as they are directly linked to the devices that receive the input through wires. This will, in turn, drive the market for wired sensors in the forecast period.

This report provides an accurate prediction of the contribution of all the segments to the growth of the gas sensors market size in North America and actionable market insights on post COVID-19 impact on each segment.


Gas Sensors Market Scope in North America

Report Coverage

Details

Page number

120

Base year

2021

Forecast period

2022-2026

Growth momentum & CAGR

Accelerate at a CAGR of 9.38%

Market growth 2022-2026

$ 173.76 million

Market structure

Fragmented

YoY growth (%)

8.89

Regional analysis

US, Canada, and Mexico

Performing market contribution

US at 66%

Key consumer countries

US, Canada, and Mexico

Competitive landscape

Leading companies, Competitive strategies, Consumer engagement scope

Key companies profiled

Control Instruments Corp., DOD Technologies Inc., Dragerwerk AG and Co. KGaA, Edinburgh Instruments Ltd., Figaro Engineering Inc., Gas-Sensing.com, Mettler Toledo International Inc., SIARGO Ltd., SPEC Sensors, LLC, and Zhengzhou Winsen Electronics Technology Co Ltd.

Market dynamics

Parent market analysis, Market growth inducers and obstacles, Fast-growing and slow-growing segment analysis, COVID 19 impact and recovery analysis and future consumer dynamics, Market condition analysis for forecast period

Customization purview

If our report has not included the data that you are looking for, you can reach out to our analysts and get segments customized.

Request for a FREE sample

What are the Key Data Covered in this Gas Sensors Market in North America Report?

  • CAGR of the market during the forecast period 2022-2026
  • Detailed information on factors that will drive gas sensors market growth in North America during the next five years
  • Precise estimation of the gas sensors market size in North America and its contribution to the parent market
  • Accurate predictions on upcoming trends and changes in consumer behavior
  • The growth of the gas sensors industry in North America across the US, Canada, and Mexico
  • A thorough analysis of the market’s competitive landscape and detailed information on vendors
  • Comprehensive details of factors that will challenge the growth of gas sensors market vendors in North America 

We can help! Our analysts can customize this report to meet your requirements. Get in touch

***1. Executive Summary                           

                **1.1     Market Overview            

                                *Exhibit 01:  Key Finding 1

                                *Exhibit 02:  Key Finding 2

                                *Exhibit 03:  Key Finding 3

                                *Exhibit 04:  Key Finding 5

                                *Exhibit 05:  Key Finding 6

                                *Exhibit 06:  Key Finding 7

***2. Market Landscape

                **2.1 Market ecosystem             

                                *2.1.1 Parent Market

                                *Exhibit 07  Parent market

                                *Exhibit 08:  Market characteristics

                **2.2 Value Chain Analysis          

                                *Exhibit 09:  Value Chain analysis : Electronic Equipment and instruments

                                *2.2.1    Inputs

                                *2.2.2    Inbound logistics

                                *2.2.3    Operations

                                *2.2.4    Outbound logistics

                                *2.2.5    Marketing and sales

                                *2.2.6    After-sales service

                                *2.2.7    Support activities

                                *2.2.8    Innovations

***3. Market Sizing                       

                **3.1 Market definition

                                *Exhibit 10:  Offerings of vendors included in the market definition

                **3.2     Market segment analysis             

                                *Exhibit 11:  Market segments

                **3.3     Market size 2021             

                **3.4 Market outlook: Forecast for 2021 - 2026 

                                *Exhibit 12:  Global - Market size and forecast 2021 - 2026 ($ million)

                                *Exhibit 13:  Global market: Year-over-year growth 2021 - 2026 (%)

***4. Five Forces Analysis                          

                **4.1 Five Forces Summary        

                                *Exhibit 14:  Five forces analysis 2021 - 2026

                **4.2 Bargaining power of buyers           

                                *Exhibit 15: Bargaining power of the buyer

                **4.3 Bargaining power of suppliers       

                                *Exhibit 16: Bargaining power of the supplier

                **4.4 Threat of new entrants    

                                *Exhibit 17: Threat of new entrants

                **4.5 Threat of substitutes         

                                *Exhibit 18: Threat of substitutes

                **4.6 Threat of rivalry   

                                *Exhibit 19: Threat of rivalry

                **4.7 Market condition

                                *Exhibit 20: Market condition - Five forces 2021

***5. Market Segmentation by Type

                **5.1 Market segments

                                *Exhibit 21:  Type - Market share 2021-2026 (%)

                **5.2     Comparison by Type      

                                *Exhibit 22:  Comparison by Type

                **5.3     Wired - Market size and forecast 2021-2026         

                                *Exhibit 23:  Wired - Market size and forecast 2021-2026 ($ million)

                                *Exhibit 24:  Wired - Year-over-year growth 2021-2026 (%)

                **5.4     Wireless - Market size and forecast 2021-2026    

                                *Exhibit 25:  Wireless - Market size and forecast 2021-2026 ($ million)

                                *Exhibit 26:  Wireless - Year-over-year growth 2021-2026 (%)

                **5.5     Market opportunity by Type       

                                *Exhibit 27:  Market opportunity by Type

***6. Customer landscape                         

                                *Technavio’s customer landscape matrix comparing Drivers or price sensitivity, Adoption lifecycle, importance in customer price basket, Adoption rate and Key purchase criteria

                **6.1 Overview

                                *Exhibit 28:  Customer landscape

***7. Geographic Landscape                     

                **7.1 Geographic segmentation

                                *Exhibit 29:  Market share by geography 2021-2026 (%)

                **7.2 Geographic comparison   

                                *Exhibit 30:  Geographic comparison

                **7.3     US - Market size and forecast 2021-2026               

                                *Exhibit 31:   US - Market size and forecast 2021-2026 ($ million)

                                *Exhibit 32:  US - Year-over-year growth 2021-2026 (%)

                **7.4     Canada - Market size and forecast 2021-2026      

                                *Exhibit 33: Canada - Market size and forecast 2021-2026 ($ million)

                                *Exhibit 34:  Canada - Year-over-year growth 2021-2026 (%)

                **7.5     Mexico - Market size and forecast 2021-2026      

                                *Exhibit 35:  Mexico - Market size and forecast 2021-2026 ($ million)

                                *Exhibit 36:  Mexico - Year-over-year growth 2021-2026 (%)

                **7.6     Market opportunity by geography           

                                *Exhibit 37:  Market opportunity by geography ($ million)

***8. Drivers, Challenges, and Trends                   

                **8.1 Market drivers     

                                *8.1.1    Increase in LNG trade

                                *8.1.2    Rising need for modernization of oil and gas industry

                                *8.1.3    Rising downstream activities

                **8.2 Market challenges              

                                *8.2.1    Price volatility in the oil and gas industry

                                *8.2.2    Shortage of skilled labor

                                *8.2.3    Increasing investments in the renewable sector

                                *Exhibit 38:  Impact of drivers and challenges

                **8.3 Market trends      

                                *8.3.1    Increasing adoption of IoT products

                                *8.3.2    Growing wireless and miniaturization trends

                                *8.3.3    Growing adoption of ultrasonic sensors

***9. Vendor Landscape                             

                **9.1 Overview

                                *Exhibit 39:  Vendor landscape

                **9.2 Landscape disruption        

                                *Exhibit 40:  Landscape disruption

                                *Exhibit 41: Industry Risk

                **9.3 Competitive Scenario        

***10. Vendor Analysis               

                **10.1 Vendors covered              

                                *Exhibit 42: Vendors covered

                **10.2 Market positioning of vendors    

                                *Exhibit 43: ?Market positioning of vendors?

                **10.3  Control Instruments Corp.          

                                *Exhibit 44:  Control Instruments Corp. - Overview

                                *Exhibit 45:  Control Instruments Corp. - Product and service

                                *Exhibit 46:  Control Instruments Corp. - Key offerings

                **10.4  DOD Technologies Inc.  

                                *Exhibit 47:  DOD Technologies Inc. - Overview

                                *Exhibit 48:  DOD Technologies Inc. - Product and service

                                *Exhibit 49:  DOD Technologies Inc. - Key offerings

                **10.5  Dragerwerk AG and Co. KGaA    

                                *Exhibit 50:  Dragerwerk AG and Co. KGaA - Overview

                                *Exhibit 51:  Dragerwerk AG and Co. KGaA - Business segments

                                *Exhibit 52:  Dragerwerk AG and Co. KGaA - Key offerings

                                *Exhibit 53:  Dragerwerk AG and Co. KGaA - Segment focus

                **10.6  Edinburgh Instruments Ltd.        

                                *Exhibit 54:  Edinburgh Instruments Ltd.  - Overview

                                *Exhibit 55:  Edinburgh Instruments Ltd.  - Product and service

                                *Exhibit 56:  Edinburgh Instruments Ltd.  - Key offerings

                **10.7  Figaro Engineering Inc.  

                                *Exhibit 57:  Figaro Engineering Inc. - Overview

                                *Exhibit 58:  Figaro Engineering Inc. - Product and service

                                *Exhibit 59:  Figaro Engineering Inc. - Key offerings

                **10.8  Gas-Sensing.com            

                                *Exhibit 60:  Gas-Sensing.com - Overview

                                *Exhibit 61:  Gas-Sensing.com - Product and service

                                *Exhibit 62:  Gas-Sensing.com - Key offerings

                **10.9  Mettler Toledo International Inc.              

                                *Exhibit 63:  Mettler Toledo International Inc. - Overview

                                *Exhibit 64:  Mettler Toledo International Inc. - Business segments

                                *Exhibit 65:  Mettler Toledo International Inc. - Key offerings

                                *Exhibit 66:  Mettler Toledo International Inc. - Segment focus

                **10.10                SIARGO Ltd.       

                                *Exhibit 67:  SIARGO Ltd. - Overview

                                *Exhibit 68:  SIARGO Ltd. - Product and service

                                *Exhibit 69:  SIARGO Ltd. - Key offerings

                **10.11                SPEC Sensors, LLC           

                                *Exhibit 70:  SPEC Sensors, LLC - Overview

                                *Exhibit 71:  SPEC Sensors, LLC - Product and service

                                *Exhibit 72:  SPEC Sensors, LLC - Key offerings

                **10.12                Zhengzhou Winsen Electronics Technology Co Ltd.           

                                *Exhibit 73:  Zhengzhou Winsen Electronics Technology Co Ltd. - Overview

                                *Exhibit 74:  Zhengzhou Winsen Electronics Technology Co Ltd. - Product and service

                                *Exhibit 75:  Zhengzhou Winsen Electronics Technology Co Ltd. - Key offerings

***11. Appendix                            

                **11.1 Scope of the report         

                                *11.1.1 ????Market definition

                                *11.1.2 ????Objectives

                                *11.1.3 ????Notes and caveats

                **11.2 Currency conversion rates for US$            

                                *Exhibit 76: ?Currency conversion rates for US$?

                **11.3 Research Methodology 

                                *Exhibit 77: ?Research Methodology

                                *Exhibit 78: ??Validation techniques employed for market sizing?

                                *Exhibit 79: ??Information sources

                **11.4 List of abbreviations        

                                *Exhibit 80: List of abbreviations

Research Methodology

Technavio presents a detailed picture of the market by way of study, synthesis, and summation of data from multiple sources. The analysts have presented the various facets of the market with a particular focus on identifying the key industry influencers. The data thus presented is comprehensive, reliable, and the result of extensive research, both primary and secondary.

INFORMATION SOURCES

Primary sources

  • Manufacturers and suppliers
  • Channel partners
  • Industry experts
  • Strategic decision makers

Secondary sources

  • Industry journals and periodicals
  • Government data
  • Financial reports of key industry players
  • Historical data
  • Press releases

DATA ANALYSIS

Data Synthesis

  • Collation of data
  • Estimation of key figures
  • Analysis of derived insights

Data Validation

  • Triangulation with data models
  • Reference against proprietary databases
  • Corroboration with industry experts

REPORT WRITING

Qualitative

  • Market drivers
  • Market challenges
  • Market trends
  • Five forces analysis

Quantitative

  • Market size and forecast
  • Market segmentation
  • Geographical insights
  • Competitive landscape

Interested in this report?

Get your sample now to see our research methodology and insights!

Download Now

Frequently Asked Questions

Gas Sensors market growth will increase by 173.76 million during 2021-2026.

The Gas Sensors market is expected to grow at a CAGR of 9.38% during 2021-2026.

Gas Sensors market is segmented by Type( Wired, Wireless) Geographic( US, Canada, Mexico)

Control Instruments Corp., DOD Technologies Inc., Dragerwerk AG and Co. KGaA, Edinburgh Instruments Ltd., Figaro Engineering Inc., Gas-Sensing.com, Mettler Toledo International Inc., SIARGO Ltd., SPEC Sensors, LLC, Zhengzhou Winsen Electronics Technology Co Ltd. are a few of the key vendors in the Gas Sensors market.

US will register the highest growth rate of 65.54% among the other regions. Therefore, the Gas Sensors market in US is expected to garner significant business opportunities for the vendors during the forecast period.

US, Canada, Mexico

  • Increase in LNG trade is the driving factor this market.

The Gas Sensors market vendors should focus on grabbing business opportunities from the Wired segment as it accounted for the largest market share in the base year.