Gastritis Market Analysis, Size, and Forecast 2025-2029: North America (US, Canada, and Mexico), Europe (Germany, UK, and France), APAC (China, Japan, and India), South America (Brazil), Middle East and Africa (South Africa, UAE, and Saudi Arabia), Asia, Rest of World (ROW)

Gastritis Market Analysis, Size, and Forecast 2025-2029:
North America (US, Canada, and Mexico), Europe (Germany, UK, and France), APAC (China, Japan, and India), South America (Brazil), Middle East and Africa (South Africa, UAE, and Saudi Arabia), Asia, Rest of World (ROW)

Published: Dec 2025 295 Pages SKU: IRTNTR81152

Market Overview at a Glance

$1.50 B
Market Opportunity
4.6%
CAGR 2024 - 2029
36.1%
North America Growth
$3.81 B
Oral segment 2023

Gastritis Market Size 2025-2029

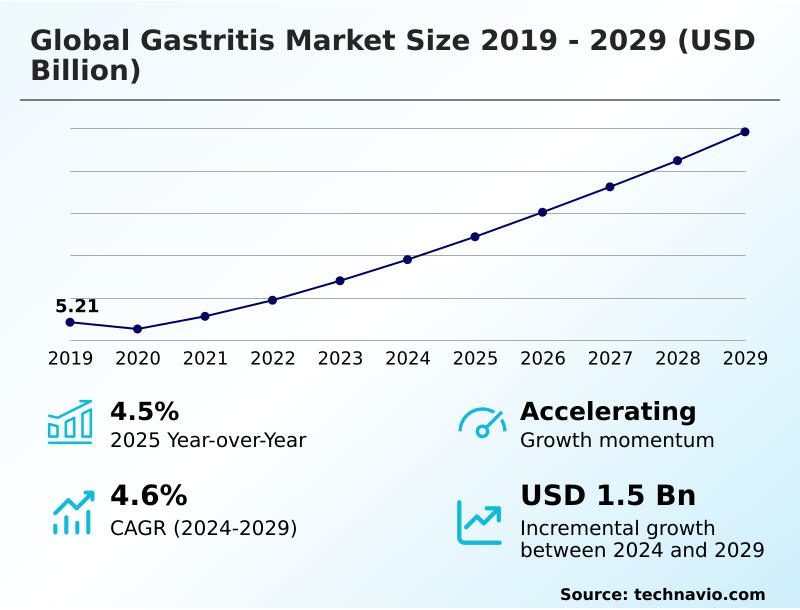
The gastritis market size is valued to increase by USD 1.50 billion, at a CAGR of 4.6% from 2024 to 2029. Pervasive helicobacter pylori infection and detrimental lifestyle factors will drive the gastritis market.

Major Market Trends & Insights

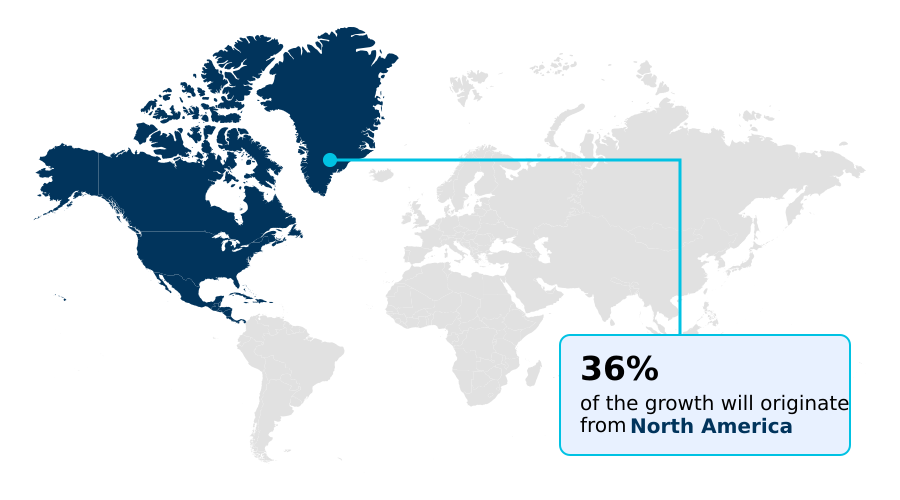
  • North America dominated the market and accounted for a 36.1% growth during the forecast period.
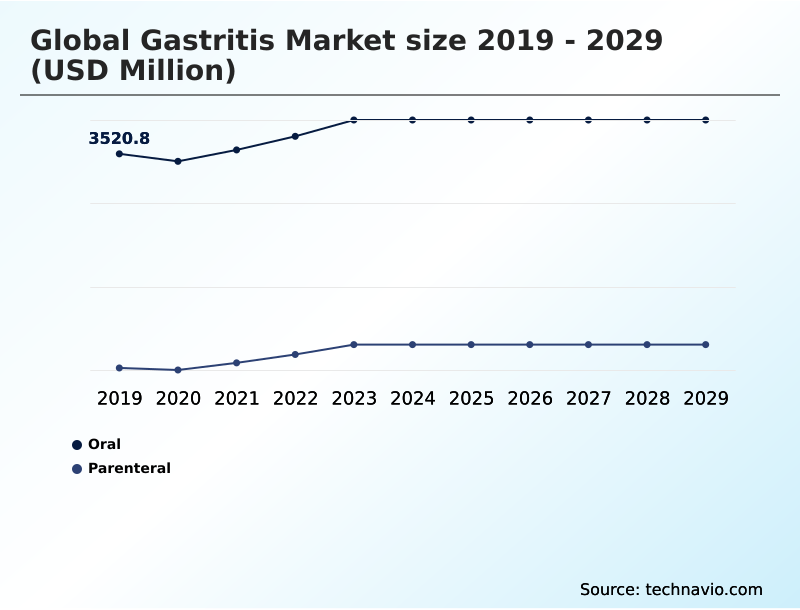
  • By Route of Administration - Oral segment was valued at USD 3.81 billion in 2023
  • By End-user - Hospitals and clinics segment accounted for the largest market revenue share in 2023

Market Size & Forecast

  • Market Opportunities: USD 2.25 billion
  • Market Future Opportunities: USD 1.50 billion
  • CAGR from 2024 to 2029 : 4.6%

Market Summary

  • The gastritis market is defined by a dynamic interplay between persistent epidemiological factors and continuous technological innovation. A primary driver is the high global prevalence of helicobacter pylori infection, the main cause of chronic gastritis, which creates a vast and sustained need for effective treatments.
  • This need is amplified by modern lifestyle choices and the widespread use of nonsteroidal anti-inflammatory drugs, particularly in aging populations. The therapeutic landscape is currently undergoing a significant transformation to address the critical challenge of antibiotic resistance, which has diminished the efficacy of long-standing regimens.
  • As a result, pharmaceutical firms are strategically pivoting R&D investment away from legacy proton pump inhibitors toward novel mechanisms, such as potassium-competitive acid blockers like vonoprazan, and more robust combination therapies.
  • Concurrently, the diagnostic segment is advancing with the integration of ai-assisted endoscopy, which enhances the detection of precancerous conditions like chronic atrophic gastritis and improves overall patient outcomes by enabling earlier, more accurate interventions.

What will be the Size of the Gastritis Market during the forecast period?

Get Key Insights on Market Forecast (PDF) Request Free Sample

How is the Gastritis Market Segmented?

The gastritis industry research report provides comprehensive data (region-wise segment analysis), with forecasts and estimates in "USD million" for the period 2025-2029, as well as historical data from 2019-2023 for the following segments.

  • Route of administration
    • Oral
    • Parenteral
  • End-user
    • Hospitals and clinics
    • Specialty centers
    • Homecare settings
  • Type
    • Acute gastritis
    • Chronic gastritis
    • Erosive gastritis
    • Non-erosive gastritis
  • Geography
    • North America
      • US
      • Canada
      • Mexico
    • Europe
      • Germany
      • UK
      • France
    • Asia
    • Rest of World (ROW)

By Route of Administration Insights

The oral segment is estimated to witness significant growth during the forecast period.

The market is segmented by offerings, including diagnostics and therapeutics, and by end-users, such as hospitals, specialty centers, and homecare.

The oral administration route dominates the global gastritis market, valued for its convenience, which is a critical factor for patient adherence to complex, multi-drug regimens.

While parenteral administration is reserved for acute scenarios like severe gastrointestinal bleeding, the vast majority of treatments for gastric inflammation and dyspeptic symptoms are oral. These include h2 receptor antagonists and other acid-suppressing agents that promote mucosal healing.

However, the symptomatic overlap with other conditions complicates diagnosis. The development of more tolerable oral rescue regimens is a key focus, as patient adherence to some multi-day therapies can be low, impacting treatment efficacy for many individuals.

Request Free Sample

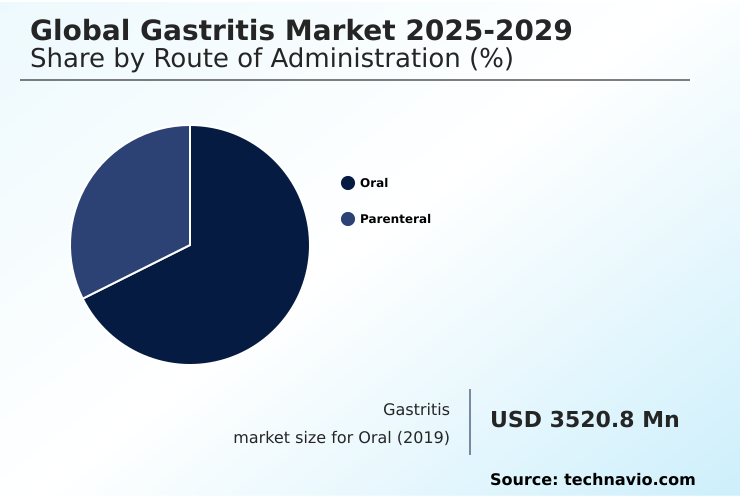
The Oral segment was valued at USD 3.81 billion in 2023 and showed a gradual increase during the forecast period.

Request Free Sample

Regional Analysis

North America is estimated to contribute 36.1% to the growth of the global market during the forecast period.Technavio’s analysts have elaborately explained the regional trends and drivers that shape the market during the forecast period.

See How Gastritis Market Demand is Rising in North America Request Free Sample

The global gastritis market exhibits distinct regional dynamics, with North America leading in value and Asia poised for the fastest growth.

North America is set to contribute approximately 36% of the market's incremental growth, driven by high healthcare spending and rapid adoption of innovative therapies like vonoprazan and advanced upper gi procedures.

However, Asia is forecast to expand at a rate approximately 43% faster than Europe, fueled by the high prevalence of helicobacter pylori infection and a growing focus on gastric cancer prevention.

This has created a substantial demand for cost-effective, non-invasive diagnostic methods, including the urea breath test and stool antigen test, to support mass screening initiatives.

In this region, a well-defined test and treat strategy is essential for managing chronic atrophic gastritis and reducing the long-term healthcare burden, pushing a shift from legacy proton pump inhibitors to more effective eradication solutions.

Market Dynamics

Our researchers analyzed the data with 2024 as the base year, along with the key drivers, trends, and challenges. A holistic analysis of drivers will help companies refine their marketing strategies to gain a competitive advantage.

  • Strategic decision-making in the gastritis market is increasingly complex, forcing companies to weigh the benefits of pursuing novel therapeutic targets for gastritis against the realities of the generic ppi market impact on innovation. The efficacy of vonoprazan vs ppi has set a new benchmark, compelling a re-evaluation of R&D pipelines.
  • Simultaneously, the challenge of managing nsaid-induced erosive gastritis remains a consistent revenue driver. Companies are focusing on the ai-assisted diagnosis of atrophic gastritis and improving endoscopy for precancerous lesion detection. Another key area is overcoming the challenges in functional dyspepsia diagnosis. For acute care, parenteral ppi for acute gi bleeding is a staple, but the focus is shifting to prevention.
  • The push for better non-invasive h.pylori testing accuracy and effective antibiotic stewardship in gastritis treatment is reshaping diagnostics. In chronic care, staging chronic gastritis histologically is crucial. Firms must also address concerns over long-term ppi use adverse effects and consider the cost-effectiveness of h.pylori eradication.
  • The development of pediatric h.pylori treatment protocols and methods for treating clarithromycin-resistant h.pylori are high-priority needs. There is also a renewed interest in the gut microbiome role in gastritis and the role of h2 blockers in gastritis. Ensuring patient compliance with quadruple therapy, like bismuth quadruple therapy for h.pylori, and preventing stress-related mucosal disease are also vital for improving outcomes.
  • This landscape demands a balanced portfolio, where investment in next-generation therapies is offset by efficient lifecycle management of established products.

What are the key market drivers leading to the rise in the adoption of Gastritis Industry?

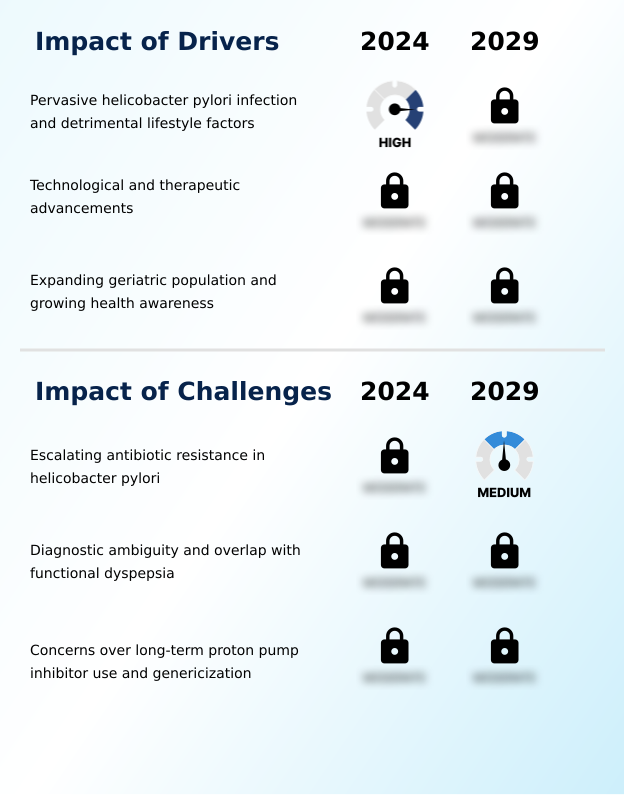
  • Market growth is significantly driven by the pervasive nature of Helicobacter pylori infections, compounded by detrimental modern lifestyle factors.

  • Market expansion is primarily fueled by the high global prevalence of helicobacter pylori infection, which is a leading cause of peptic ulcer disease and requires effective acid-suppressive therapies.
  • This driver is intensified by the widespread use of nonsteroidal anti-inflammatory drugs (NSAIDs), particularly among the growing elderly population with significant comorbidity management needs, which can damage the gastric mucosal barrier.
  • In high-risk patients, the use of stress ulcer prophylaxis is standard, but the sheer volume of NSAID users creates a sustained demand for gastroprotective agents.
  • The market is also sustained by the continuous need for effective first-line treatment and rescue regimens, with recent pharmacovigilance studies shaping prescribing habits.
  • This confluence of infectious disease and lifestyle-related factors ensures a persistent and expanding patient base requiring intervention to manage gastric acid secretion and prevent long-term complications.

What are the market trends shaping the Gastritis Industry?

  • The market is witnessing a paradigm shift in H. pylori eradication therapy. This change is primarily driven by the escalating challenge of antibiotic resistance.

  • Key market trends are centered on technological and therapeutic advancements to address clinical shortcomings. The integration of ai-assisted endoscopy is revolutionizing endoscopic diagnostics, with deep learning models demonstrating the ability to diagnose h. pylori infection from images with up to 90% accuracy. This enhances the potential for personalized therapy by identifying subtle mucosal changes.
  • In therapeutics, the introduction of the potassium-competitive acid blocker class is reshaping h.pylori eradication therapy, especially for refractory cases. The development of streamlined regimens like amoxicillin dual therapy and potent alternatives such as rifabutin-based triple therapy offers new options where traditional treatments fail.
  • This innovation extends to digital pathology, where AI algorithms can analyze histologic slides, improving diagnostic consistency and workflow efficiency by over 20% in some settings.

What challenges does the Gastritis Industry face during its growth?

  • A key challenge affecting industry growth is the escalating rate of antibiotic resistance in Helicobacter pylori.

  • A primary market challenge is the rise of antimicrobial resistance, which has led to clarithromycin resistance rates exceeding 30% in some regions and has rendered standard bismuth quadruple therapy less effective. This necessitates rigorous antibiotic resistance surveillance to guide treatment for both erosive gastritis and non-erosive gastritis.
  • The challenge is compounded by the significant diagnostic ambiguity created by functional dyspepsia, a disorder of gut-brain interaction that mimics gastritis symptoms in up to 75% of dyspeptic patients. This overlap often leads to an inefficient test-and-treat strategy and inappropriate prescribing.
  • Furthermore, the market faces pressure from generic price decay of legacy drugs and growing de-prescribing initiatives, which require a shift in strategy from established players toward innovation in both therapeutics and histologic analysis to maintain growth.

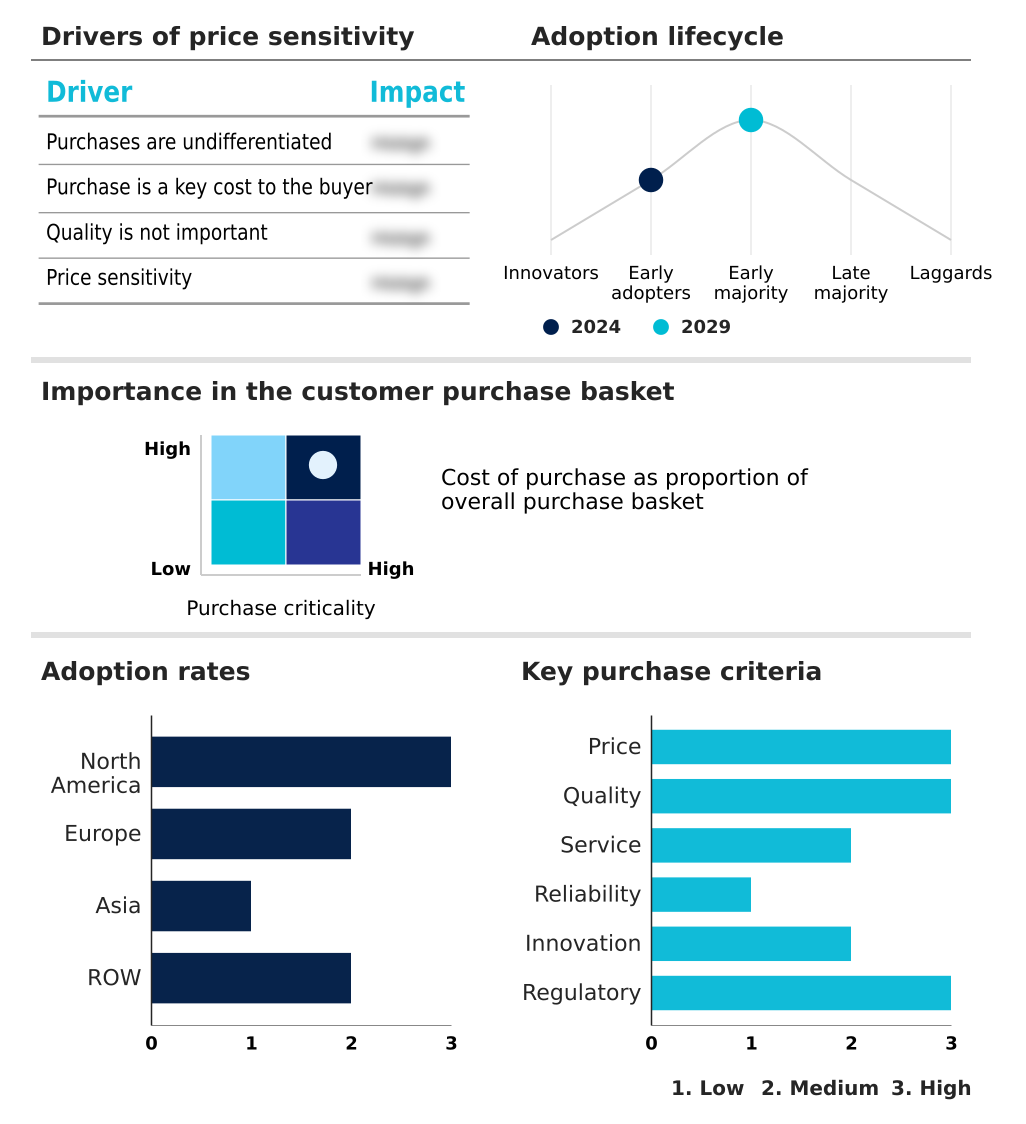
Exclusive Technavio Analysis on Customer Landscape

The gastritis market forecasting report includes the adoption lifecycle of the market, covering from the innovator’s stage to the laggard’s stage. It focuses on adoption rates in different regions based on penetration. Furthermore, the gastritis market report also includes key purchase criteria and drivers of price sensitivity to help companies evaluate and develop their market growth analysis strategies.

Customer Landscape of Gastritis Industry

Competitive Landscape

Companies are implementing various strategies, such as strategic alliances, gastritis market forecast, partnerships, mergers and acquisitions, geographical expansion, and product/service launches, to enhance their presence in the industry.

Abbott Laboratories - Key offerings include proton pump inhibitors for managing acid-related symptoms and therapies designed to mitigate NSAID-induced gastric damage and complications.

The industry research and growth report includes detailed analyses of the competitive landscape of the market and information about key companies, including:

  • Abbott Laboratories
  • AbbVie Inc.
  • AstraZeneca Plc
  • Cipla Inc.
  • Dr Reddys Laboratories Ltd.
  • GlaxoSmithKline Plc
  • Johnson and Johnson Services
  • Lupin Ltd.
  • Medtronic Plc
  • Novartis AG
  • Otsuka Pharmaceutical Co Ltd.
  • Perrigo Co. Plc
  • Pfizer Inc.
  • QIAGEN N.V.
  • Sanofi SA
  • Takeda Pharmaceutical Ltd.
  • Teva Pharmaceutical Ltd.
  • Zydus Lifesciences Ltd.

Qualitative and quantitative analysis of companies has been conducted to help clients understand the wider business environment as well as the strengths and weaknesses of key industry players. Data is qualitatively analyzed to categorize companies as pure play, category-focused, industry-focused, and diversified; it is quantitatively analyzed to categorize companies as dominant, leading, strong, tentative, and weak.

Recent Development and News in Gastritis market

  • In August 2024, a pivotal systematic review concluded that AI-based technologies significantly outperform human experts in diagnosing various gastritis types, signaling increased investment in AI-assisted endoscopy platforms by companies like Medtronic Plc.
  • In September 2024, the American College of Gastroenterology released new clinical guidelines recommending 14-day bismuth-based quadruple therapy, a move that directly reshapes the product and marketing strategies of firms like AbbVie Inc. and Takeda Pharmaceutical Ltd.
  • In November 2024, Takeda Pharmaceutical Ltd. presented research at the American College of Gastroenterology annual meeting demonstrating that its 10-day vonoprazan-based regimen was significantly more effective than standard 14-day omeprazole therapy for H. pylori eradication.
  • In January 2025, Teva Pharmaceutical Ltd. launched a new generic version of a leading proton pump inhibitor in Europe, intensifying price competition and expanding patient access to affordable gastritis treatments.

Dive into Technavio’s robust research methodology, blending expert interviews, extensive data synthesis, and validated models for unparalleled Gastritis Market insights. See full methodology.

Market Scope
Page number 295
Base year 2024
Historic period 2019-2023
Forecast period 2025-2029
Growth momentum & CAGR Accelerate at a CAGR of 4.6%
Market growth 2025-2029 USD 1502.4 million
Market structure Fragmented
YoY growth 2024-2025(%) 4.5%
Key countries US, Canada, Mexico, Germany, UK, France, Italy, Spain, The Netherlands, Russia, China, Japan, India, South Korea, Indonesia, Thailand, Singapore, Australia, Brazil, South Africa, UAE, Saudi Arabia and Turkey
Competitive landscape Leading Companies, Market Positioning of Companies, Competitive Strategies, and Industry Risks

Request Free Sample

Research Analyst Overview

  • The gastritis market is undergoing a fundamental realignment driven by the clinical necessity to overcome high antibiotic resistance. This shift is forcing a strategic pivot in product development and boardroom budgeting, moving away from legacy treatments. The declining efficacy of standard therapies has rendered many first-line protocols obsolete, creating a market imperative for innovation.
  • Consequently, there is a pronounced focus on advancing more robust therapeutic options, such as bismuth quadruple therapy and novel agents like vonoprazan, a potassium-competitive acid blocker. The development of amoxicillin dual therapy and rifabutin-based triple therapy further diversifies treatment for resistant infections.
  • This therapeutic evolution is complemented by advancements in diagnostics, including ai-assisted endoscopy and more precise histologic analysis for conditions from non-erosive gastritis to erosive gastritis. The management of peptic ulcer disease and gastrointestinal bleeding relies on effective acid-suppressive therapies and a clear understanding of the gastric mucosal barrier.
  • This complex environment, where treatment failure rates for older regimens can exceed 20% in some regions, demands that companies prioritize investment in clinically superior solutions to maintain market relevance.

What are the Key Data Covered in this Gastritis Market Research and Growth Report?

  • What is the expected growth of the Gastritis Market between 2025 and 2029?

    • USD 1.50 billion, at a CAGR of 4.6%

  • What segmentation does the market report cover?

    • The report is segmented by Route of Administration (Oral, and Parenteral), End-user (Hospitals and clinics, Specialty centers, and Homecare settings), Type (Acute gastritis, Chronic gastritis, Erosive gastritis, and Non-erosive gastritis) and Geography (North America, Europe, Asia, Rest of World (ROW))

  • Which regions are analyzed in the report?

    • North America, Europe, Asia and Rest of World (ROW)

  • What are the key growth drivers and market challenges?

    • Pervasive helicobacter pylori infection and detrimental lifestyle factors, Escalating antibiotic resistance in helicobacter pylori

  • Who are the major players in the Gastritis Market?

    • Abbott Laboratories, AbbVie Inc., AstraZeneca Plc, Cipla Inc., Dr Reddys Laboratories Ltd., GlaxoSmithKline Plc, Johnson and Johnson Services, Lupin Ltd., Medtronic Plc, Novartis AG, Otsuka Pharmaceutical Co Ltd., Perrigo Co. Plc, Pfizer Inc., QIAGEN N.V., Sanofi SA, Takeda Pharmaceutical Ltd., Teva Pharmaceutical Ltd. and Zydus Lifesciences Ltd.

Market Research Insights

  • Market dynamics are shaped by a strategic pivot toward value-based outcomes and technological integration. The introduction of novel therapeutic agents is a key factor, with newer regimens demonstrating the ability to reduce treatment duration by nearly 30% compared to traditional therapies, significantly lowering the overall cost of care and improving patient adherence.
  • The integration of deep learning models into diagnostics is also transforming care, with studies showing AI-assisted platforms can improve the detection of high-risk mucosal changes by over 15%, facilitating a more effective test and treat strategy. This focus on personalized therapy and more effective first-line treatments is critical for managing refractory cases and avoiding costly repeat procedures.
  • As the market contends with the symptomatic overlap between organic gastritis and functional dyspepsia, the emphasis on precise non-invasive diagnostic methods is increasing, driving demand for advanced urea breath tests and stool antigen tests to ensure appropriate and cost-effective patient management pathways.

We can help! Our analysts can customize this gastritis market research report to meet your requirements.

Get in touch

1. Executive Summary

1.1 Market overview

Executive Summary - Chart on Market Overview
Executive Summary - Data Table on Market Overview
Executive Summary - Chart on Global Market Characteristics
Executive Summary - Chart on Market by Geography
Executive Summary - Chart on Market Segmentation by Route of Administration
Executive Summary - Chart on Market Segmentation by End-user
Executive Summary - Chart on Market Segmentation by Type
Executive Summary - Chart on Incremental Growth
Executive Summary - Data Table on Incremental Growth
Executive Summary - Chart on Company Market Positioning

2. Technavio Analysis

2.1 Analysis of price sensitivity, lifecycle, customer purchase basket, adoption rates, and purchase criteria

2.2 Criticality of inputs and Factors of differentiation

Chart on Overview on criticality of inputs and factors of differentiation

2.3 Factors of disruption

Chart on Overview on factors of disruption

2.4 Impact of drivers and challenges

Chart on Impact of drivers and challenges in 2024 and 2029

3. Market Landscape

3.1 Market ecosystem

Chart on Parent Market
Data Table on - Parent Market

3.2 Market characteristics

Chart on Market characteristics analysis

3.3 Value chain analysis

Chart on Value chain analysis

4. Market Sizing

4.1 Market definition

Data Table on Offerings of companies included in the market definition

4.2 Market segment analysis

Market segments

4.3 Market size 2024

4.4 Market outlook: Forecast for 2024-2029

Chart on Global - Market size and forecast 2024-2029 ($ million)
Data Table on Global - Market size and forecast 2024-2029 ($ million)
Chart on Global Market: Year-over-year growth 2024-2029 (%)
Data Table on Global Market: Year-over-year growth 2024-2029 (%)

5. Historic Market Size

5.1 Global Gastritis Market 2019 - 2023

Historic Market Size - Data Table on Global Gastritis Market 2019 - 2023 ($ million)

5.2 Route of Administration segment analysis 2019 - 2023

Historic Market Size - Route of Administration Segment 2019 - 2023 ($ million)

5.3 End-user segment analysis 2019 - 2023

Historic Market Size - End-user Segment 2019 - 2023 ($ million)

5.4 Type segment analysis 2019 - 2023

Historic Market Size - Type Segment 2019 - 2023 ($ million)

5.5 Geography segment analysis 2019 - 2023

Historic Market Size - Geography Segment 2019 - 2023 ($ million)

5.6 Country segment analysis 2019 - 2023

Historic Market Size - Country Segment 2019 - 2023 ($ million)

6. Qualitative Analysis

6.1 The AI impact on global gastritis market

7. Five Forces Analysis

7.1 Five forces summary

Five forces analysis - Comparison between 2024 and 2029

7.2 Bargaining power of buyers

Bargaining power of buyers - Impact of key factors 2024 and 2029

7.3 Bargaining power of suppliers

Bargaining power of suppliers - Impact of key factors in 2024 and 2029

7.4 Threat of new entrants

Threat of new entrants - Impact of key factors in 2024 and 2029

7.5 Threat of substitutes

Threat of substitutes - Impact of key factors in 2024 and 2029

7.6 Threat of rivalry

Threat of rivalry - Impact of key factors in 2024 and 2029

7.7 Market condition

Chart on Market condition - Five forces 2024 and 2029

8. Market Segmentation by Route of Administration

8.1 Market segments

Chart on Route of Administration - Market share 2024-2029 (%)
Data Table on Route of Administration - Market share 2024-2029 (%)

8.2 Comparison by Route of Administration

Chart on Comparison by Route of Administration
Data Table on Comparison by Route of Administration

8.3 Oral - Market size and forecast 2024-2029

Chart on Oral - Market size and forecast 2024-2029 ($ million)
Data Table on Oral - Market size and forecast 2024-2029 ($ million)
Chart on Oral - Year-over-year growth 2024-2029 (%)
Data Table on Oral - Year-over-year growth 2024-2029 (%)

8.4 Parenteral - Market size and forecast 2024-2029

Chart on Parenteral - Market size and forecast 2024-2029 ($ million)
Data Table on Parenteral - Market size and forecast 2024-2029 ($ million)
Chart on Parenteral - Year-over-year growth 2024-2029 (%)
Data Table on Parenteral - Year-over-year growth 2024-2029 (%)

8.5 Market opportunity by Route of Administration

Market opportunity by Route of Administration ($ million)
Data Table on Market opportunity by Route of Administration ($ million)

9. Market Segmentation by End-user

9.1 Market segments

Chart on End-user - Market share 2024-2029 (%)
Data Table on End-user - Market share 2024-2029 (%)

9.2 Comparison by End-user

Chart on Comparison by End-user
Data Table on Comparison by End-user

9.3 Hospitals and clinics - Market size and forecast 2024-2029

Chart on Hospitals and clinics - Market size and forecast 2024-2029 ($ million)
Data Table on Hospitals and clinics - Market size and forecast 2024-2029 ($ million)
Chart on Hospitals and clinics - Year-over-year growth 2024-2029 (%)
Data Table on Hospitals and clinics - Year-over-year growth 2024-2029 (%)

9.4 Specialty centers - Market size and forecast 2024-2029

Chart on Specialty centers - Market size and forecast 2024-2029 ($ million)
Data Table on Specialty centers - Market size and forecast 2024-2029 ($ million)
Chart on Specialty centers - Year-over-year growth 2024-2029 (%)
Data Table on Specialty centers - Year-over-year growth 2024-2029 (%)

9.5 Homecare settings - Market size and forecast 2024-2029

Chart on Homecare settings - Market size and forecast 2024-2029 ($ million)
Data Table on Homecare settings - Market size and forecast 2024-2029 ($ million)
Chart on Homecare settings - Year-over-year growth 2024-2029 (%)
Data Table on Homecare settings - Year-over-year growth 2024-2029 (%)

9.6 Market opportunity by End-user

Market opportunity by End-user ($ million)
Data Table on Market opportunity by End-user ($ million)

10. Market Segmentation by Type

10.1 Market segments

Chart on Type - Market share 2024-2029 (%)
Data Table on Type - Market share 2024-2029 (%)

10.2 Comparison by Type

Chart on Comparison by Type
Data Table on Comparison by Type

10.3 Acute gastritis - Market size and forecast 2024-2029

Chart on Acute gastritis - Market size and forecast 2024-2029 ($ million)
Data Table on Acute gastritis - Market size and forecast 2024-2029 ($ million)
Chart on Acute gastritis - Year-over-year growth 2024-2029 (%)
Data Table on Acute gastritis - Year-over-year growth 2024-2029 (%)

10.4 Chronic gastritis - Market size and forecast 2024-2029

Chart on Chronic gastritis - Market size and forecast 2024-2029 ($ million)
Data Table on Chronic gastritis - Market size and forecast 2024-2029 ($ million)
Chart on Chronic gastritis - Year-over-year growth 2024-2029 (%)
Data Table on Chronic gastritis - Year-over-year growth 2024-2029 (%)

10.5 Erosive gastritis - Market size and forecast 2024-2029

Chart on Erosive gastritis - Market size and forecast 2024-2029 ($ million)
Data Table on Erosive gastritis - Market size and forecast 2024-2029 ($ million)
Chart on Erosive gastritis - Year-over-year growth 2024-2029 (%)
Data Table on Erosive gastritis - Year-over-year growth 2024-2029 (%)

10.6 Non-erosive gastritis - Market size and forecast 2024-2029

Chart on Non-erosive gastritis - Market size and forecast 2024-2029 ($ million)
Data Table on Non-erosive gastritis - Market size and forecast 2024-2029 ($ million)
Chart on Non-erosive gastritis - Year-over-year growth 2024-2029 (%)
Data Table on Non-erosive gastritis - Year-over-year growth 2024-2029 (%)

10.7 Market opportunity by Type

Market opportunity by Type ($ million)
Data Table on Market opportunity by Type ($ million)

11. Customer Landscape

11.1 Customer landscape overview

Analysis of price sensitivity, lifecycle, customer purchase basket, adoption rates, and purchase criteria

12. Geographic Landscape

12.1 Geographic segmentation

Chart on Market share by geography 2024-2029 (%)
Data Table on Market share by geography 2024-2029 (%)

12.2 Geographic comparison

Chart on Geographic comparison
Data Table on Geographic comparison

12.3 North America - Market size and forecast 2024-2029

Chart on North America - Market size and forecast 2024-2029 ($ million)
Data Table on North America - Market size and forecast 2024-2029 ($ million)
Chart on North America - Year-over-year growth 2024-2029 (%)
Data Table on North America - Year-over-year growth 2024-2029 (%)
Chart on Regional Comparison - North America
Data Table on Regional Comparison - North America

12.3.1 US - Market size and forecast 2024-2029

Chart on US - Market size and forecast 2024-2029 ($ million)
Data Table on US - Market size and forecast 2024-2029 ($ million)
Chart on US - Year-over-year growth 2024-2029 (%)
Data Table on US - Year-over-year growth 2024-2029 (%)

12.3.2 Canada - Market size and forecast 2024-2029

Chart on Canada - Market size and forecast 2024-2029 ($ million)
Data Table on Canada - Market size and forecast 2024-2029 ($ million)
Chart on Canada - Year-over-year growth 2024-2029 (%)
Data Table on Canada - Year-over-year growth 2024-2029 (%)

12.3.3 Mexico - Market size and forecast 2024-2029

Chart on Mexico - Market size and forecast 2024-2029 ($ million)
Data Table on Mexico - Market size and forecast 2024-2029 ($ million)
Chart on Mexico - Year-over-year growth 2024-2029 (%)
Data Table on Mexico - Year-over-year growth 2024-2029 (%)

12.4 Europe - Market size and forecast 2024-2029

Chart on Europe - Market size and forecast 2024-2029 ($ million)
Data Table on Europe - Market size and forecast 2024-2029 ($ million)
Chart on Europe - Year-over-year growth 2024-2029 (%)
Data Table on Europe - Year-over-year growth 2024-2029 (%)
Chart on Regional Comparison - Europe
Data Table on Regional Comparison - Europe

12.4.1 Germany - Market size and forecast 2024-2029

Chart on Germany - Market size and forecast 2024-2029 ($ million)
Data Table on Germany - Market size and forecast 2024-2029 ($ million)
Chart on Germany - Year-over-year growth 2024-2029 (%)
Data Table on Germany - Year-over-year growth 2024-2029 (%)

12.4.2 UK - Market size and forecast 2024-2029

Chart on UK - Market size and forecast 2024-2029 ($ million)
Data Table on UK - Market size and forecast 2024-2029 ($ million)
Chart on UK - Year-over-year growth 2024-2029 (%)
Data Table on UK - Year-over-year growth 2024-2029 (%)

12.4.3 France - Market size and forecast 2024-2029

Chart on France - Market size and forecast 2024-2029 ($ million)
Data Table on France - Market size and forecast 2024-2029 ($ million)
Chart on France - Year-over-year growth 2024-2029 (%)
Data Table on France - Year-over-year growth 2024-2029 (%)

12.4.4 Italy - Market size and forecast 2024-2029

Chart on Italy - Market size and forecast 2024-2029 ($ million)
Data Table on Italy - Market size and forecast 2024-2029 ($ million)
Chart on Italy - Year-over-year growth 2024-2029 (%)
Data Table on Italy - Year-over-year growth 2024-2029 (%)

12.4.5 Spain - Market size and forecast 2024-2029

Chart on Spain - Market size and forecast 2024-2029 ($ million)
Data Table on Spain - Market size and forecast 2024-2029 ($ million)
Chart on Spain - Year-over-year growth 2024-2029 (%)
Data Table on Spain - Year-over-year growth 2024-2029 (%)

12.4.6 The Netherlands - Market size and forecast 2024-2029

Chart on The Netherlands - Market size and forecast 2024-2029 ($ million)
Data Table on The Netherlands - Market size and forecast 2024-2029 ($ million)
Chart on The Netherlands - Year-over-year growth 2024-2029 (%)
Data Table on The Netherlands - Year-over-year growth 2024-2029 (%)

12.4.7 Russia - Market size and forecast 2024-2029

Chart on Russia - Market size and forecast 2024-2029 ($ million)
Data Table on Russia - Market size and forecast 2024-2029 ($ million)
Chart on Russia - Year-over-year growth 2024-2029 (%)
Data Table on Russia - Year-over-year growth 2024-2029 (%)

12.5 Asia - Market size and forecast 2024-2029

Chart on Asia - Market size and forecast 2024-2029 ($ million)
Data Table on Asia - Market size and forecast 2024-2029 ($ million)
Chart on Asia - Year-over-year growth 2024-2029 (%)
Data Table on Asia - Year-over-year growth 2024-2029 (%)
Chart on Regional Comparison - Asia
Data Table on Regional Comparison - Asia

12.5.1 China - Market size and forecast 2024-2029

Chart on China - Market size and forecast 2024-2029 ($ million)
Data Table on China - Market size and forecast 2024-2029 ($ million)
Chart on China - Year-over-year growth 2024-2029 (%)
Data Table on China - Year-over-year growth 2024-2029 (%)

12.5.2 Japan - Market size and forecast 2024-2029

Chart on Japan - Market size and forecast 2024-2029 ($ million)
Data Table on Japan - Market size and forecast 2024-2029 ($ million)
Chart on Japan - Year-over-year growth 2024-2029 (%)
Data Table on Japan - Year-over-year growth 2024-2029 (%)

12.5.3 India - Market size and forecast 2024-2029

Chart on India - Market size and forecast 2024-2029 ($ million)
Data Table on India - Market size and forecast 2024-2029 ($ million)
Chart on India - Year-over-year growth 2024-2029 (%)
Data Table on India - Year-over-year growth 2024-2029 (%)

12.5.4 South Korea - Market size and forecast 2024-2029

Chart on South Korea - Market size and forecast 2024-2029 ($ million)
Data Table on South Korea - Market size and forecast 2024-2029 ($ million)
Chart on South Korea - Year-over-year growth 2024-2029 (%)
Data Table on South Korea - Year-over-year growth 2024-2029 (%)

12.5.5 Indonesia - Market size and forecast 2024-2029

Chart on Indonesia - Market size and forecast 2024-2029 ($ million)
Data Table on Indonesia - Market size and forecast 2024-2029 ($ million)
Chart on Indonesia - Year-over-year growth 2024-2029 (%)
Data Table on Indonesia - Year-over-year growth 2024-2029 (%)

12.5.6 Thailand - Market size and forecast 2024-2029

Chart on Thailand - Market size and forecast 2024-2029 ($ million)
Data Table on Thailand - Market size and forecast 2024-2029 ($ million)
Chart on Thailand - Year-over-year growth 2024-2029 (%)
Data Table on Thailand - Year-over-year growth 2024-2029 (%)

12.5.7 Singapore - Market size and forecast 2024-2029

Chart on Singapore - Market size and forecast 2024-2029 ($ million)
Data Table on Singapore - Market size and forecast 2024-2029 ($ million)
Chart on Singapore - Year-over-year growth 2024-2029 (%)
Data Table on Singapore - Year-over-year growth 2024-2029 (%)

12.6 Rest of World (ROW) - Market size and forecast 2024-2029

Chart on Rest of World (ROW) - Market size and forecast 2024-2029 ($ million)
Data Table on Rest of World (ROW) - Market size and forecast 2024-2029 ($ million)
Chart on Rest of World (ROW) - Year-over-year growth 2024-2029 (%)
Data Table on Rest of World (ROW) - Year-over-year growth 2024-2029 (%)
Chart on Regional Comparison - Rest of World (ROW)
Data Table on Regional Comparison - Rest of World (ROW)

12.6.1 Australia - Market size and forecast 2024-2029

Chart on Australia - Market size and forecast 2024-2029 ($ million)
Data Table on Australia - Market size and forecast 2024-2029 ($ million)
Chart on Australia - Year-over-year growth 2024-2029 (%)
Data Table on Australia - Year-over-year growth 2024-2029 (%)

12.6.2 Brazil - Market size and forecast 2024-2029

Chart on Brazil - Market size and forecast 2024-2029 ($ million)
Data Table on Brazil - Market size and forecast 2024-2029 ($ million)
Chart on Brazil - Year-over-year growth 2024-2029 (%)
Data Table on Brazil - Year-over-year growth 2024-2029 (%)

12.6.3 South Africa - Market size and forecast 2024-2029

Chart on South Africa - Market size and forecast 2024-2029 ($ million)
Data Table on South Africa - Market size and forecast 2024-2029 ($ million)
Chart on South Africa - Year-over-year growth 2024-2029 (%)
Data Table on South Africa - Year-over-year growth 2024-2029 (%)

12.6.4 UAE - Market size and forecast 2024-2029

Chart on UAE - Market size and forecast 2024-2029 ($ million)
Data Table on UAE - Market size and forecast 2024-2029 ($ million)
Chart on UAE - Year-over-year growth 2024-2029 (%)
Data Table on UAE - Year-over-year growth 2024-2029 (%)

12.6.5 Saudi Arabia - Market size and forecast 2024-2029

Chart on Saudi Arabia - Market size and forecast 2024-2029 ($ million)
Data Table on Saudi Arabia - Market size and forecast 2024-2029 ($ million)
Chart on Saudi Arabia - Year-over-year growth 2024-2029 (%)
Data Table on Saudi Arabia - Year-over-year growth 2024-2029 (%)

12.6.6 Turkey - Market size and forecast 2024-2029

Chart on Turkey - Market size and forecast 2024-2029 ($ million)
Data Table on Turkey - Market size and forecast 2024-2029 ($ million)
Chart on Turkey - Year-over-year growth 2024-2029 (%)
Data Table on Turkey - Year-over-year growth 2024-2029 (%)

12.7 Market opportunity by geography

Market opportunity by geography ($ million)
Data Tables on Market opportunity by geography ($ million)

13. Drivers, Challenges, and Opportunity

13.1 Market drivers

Pervasive helicobacter pylori infection and detrimental lifestyle factors
Technological and therapeutic advancements
Expanding geriatric population and growing health awareness

13.2 Market challenges

Escalating antibiotic resistance in helicobacter pylori
Diagnostic ambiguity and overlap with functional dyspepsia
Concerns over long-term proton pump inhibitor use and genericization

13.3 Impact of drivers and challenges

Impact of drivers and challenges in 2024 and 2029

13.4 Market opportunities

Paradigm shift in h. pylori eradication therapy driven by antibiotic resistance
Integration of artificial intelligence in endoscopic diagnostics
Growing emphasis on advanced non-invasive diagnostic methods

14. Competitive Landscape

14.1 Overview

14.2

Overview on criticality of inputs and factors of differentiation

14.3 Landscape disruption

Overview on factors of disruption

14.4 Industry risks

Impact of key risks on business

15. Competitive Analysis

15.1 Companies profiled

Companies covered

15.2 Company ranking index

15.3 Market positioning of companies

Matrix on companies position and classification

15.4 Abbott Laboratories

Abbott Laboratories - Overview
Abbott Laboratories - Business segments
Abbott Laboratories - Key news
Abbott Laboratories - Key offerings
Abbott Laboratories - Segment focus
SWOT

15.5 AbbVie Inc.

AbbVie Inc. - Overview
AbbVie Inc. - Product / Service
AbbVie Inc. - Key news
AbbVie Inc. - Key offerings
SWOT

15.6 AstraZeneca Plc

AstraZeneca Plc - Overview
AstraZeneca Plc - Product / Service
AstraZeneca Plc - Key news
AstraZeneca Plc - Key offerings
SWOT

15.7 Cipla Inc.

Cipla Inc. - Overview
Cipla Inc. - Business segments
Cipla Inc. - Key news
Cipla Inc. - Key offerings
Cipla Inc. - Segment focus
SWOT

15.8 Dr Reddys Laboratories Ltd.

Dr Reddys Laboratories Ltd. - Overview
Dr Reddys Laboratories Ltd. - Business segments
Dr Reddys Laboratories Ltd. - Key news
Dr Reddys Laboratories Ltd. - Key offerings
Dr Reddys Laboratories Ltd. - Segment focus
SWOT

15.9 GlaxoSmithKline Plc

GlaxoSmithKline Plc - Overview
GlaxoSmithKline Plc - Business segments
GlaxoSmithKline Plc - Key news
GlaxoSmithKline Plc - Key offerings
GlaxoSmithKline Plc - Segment focus
SWOT

15.10 Johnson and Johnson Services

Johnson and Johnson Services - Overview
Johnson and Johnson Services - Business segments
Johnson and Johnson Services - Key news
Johnson and Johnson Services - Key offerings
Johnson and Johnson Services - Segment focus
SWOT

15.11 Lupin Ltd.

Lupin Ltd. - Overview
Lupin Ltd. - Business segments
Lupin Ltd. - Key news
Lupin Ltd. - Key offerings
Lupin Ltd. - Segment focus
SWOT

15.12 Medtronic Plc

Medtronic Plc - Overview
Medtronic Plc - Business segments
Medtronic Plc - Key news
Medtronic Plc - Key offerings
Medtronic Plc - Segment focus
SWOT

15.13 Novartis AG

Novartis AG - Overview
Novartis AG - Business segments
Novartis AG - Key news
Novartis AG - Key offerings
Novartis AG - Segment focus
SWOT

15.14 Otsuka Pharmaceutical Co Ltd.

Otsuka Pharmaceutical Co Ltd. - Overview
Otsuka Pharmaceutical Co Ltd. - Product / Service
Otsuka Pharmaceutical Co Ltd. - Key offerings
SWOT

15.15 Perrigo Co. Plc

Perrigo Co. Plc - Overview
Perrigo Co. Plc - Business segments
Perrigo Co. Plc - Key offerings
Perrigo Co. Plc - Segment focus
SWOT

15.16 Pfizer Inc.

Pfizer Inc. - Overview
Pfizer Inc. - Product / Service
Pfizer Inc. - Key news
Pfizer Inc. - Key offerings
SWOT

15.17 QIAGEN N.V.

QIAGEN N.V. - Overview
QIAGEN N.V. - Product / Service
QIAGEN N.V. - Key news
QIAGEN N.V. - Key offerings
SWOT

15.18 Sanofi SA

Sanofi SA - Overview
Sanofi SA - Business segments
Sanofi SA - Key news
Sanofi SA - Key offerings
Sanofi SA - Segment focus
SWOT

16. Appendix

16.1 Scope of the report

Market definition
Objectives
Notes and caveats

16.2 Inclusions and exclusions checklist

Inclusions checklist
Exclusions checklist

16.3 Currency conversion rates for US$

16.4 Research methodology

16.5 Data procurement

Information sources

16.6 Data validation

16.7 Validation techniques employed for market sizing

16.8 Data synthesis

16.9 360 degree market analysis

16.10 List of abbreviations

Research Methodology

Technavio presents a detailed picture of the market by way of study, synthesis, and summation of data from multiple sources. The analysts have presented the various facets of the market with a particular focus on identifying the key industry influencers. The data thus presented is comprehensive, reliable, and the result of extensive research, both primary and secondary.

INFORMATION SOURCES

Primary sources

  • Manufacturers and suppliers
  • Channel partners
  • Industry experts
  • Strategic decision makers

Secondary sources

  • Industry journals and periodicals
  • Government data
  • Financial reports of key industry players
  • Historical data
  • Press releases

DATA ANALYSIS

Data Synthesis

  • Collation of data
  • Estimation of key figures
  • Analysis of derived insights

Data Validation

  • Triangulation with data models
  • Reference against proprietary databases
  • Corroboration with industry experts

REPORT WRITING

Qualitative

  • Market drivers
  • Market challenges
  • Market trends
  • Five forces analysis

Quantitative

  • Market size and forecast
  • Market segmentation
  • Geographical insights
  • Competitive landscape

Interested in this report?

Get your sample now to see our research methodology and insights!

Download Now

Frequently Asked Questions

Gastritis market growth will increase by USD 1502.4 million during 2025-2029 .

The Gastritis market is expected to grow at a CAGR of 4.6% during 2025-2029 .

Gastritis market is segmented by Route of administration (Oral, Parenteral) End-user (Hospitals and clinics, Specialty centers, Homecare settings) Type (Acute gastritis, Chronic gastritis, Erosive gastritis, Non-erosive gastritis)

Abbott Laboratories, AbbVie Inc., AstraZeneca Plc, Cipla Inc., Dr Reddys Laboratories Ltd., GlaxoSmithKline Plc, Johnson and Johnson Services, Lupin Ltd., Medtronic Plc, Novartis AG, Otsuka Pharmaceutical Co Ltd., Perrigo Co. Plc, Pfizer Inc., QIAGEN N.V., Sanofi SA, Takeda Pharmaceutical Ltd., Teva Pharmaceutical Ltd., Zydus Lifesciences Ltd. are a few of the key vendors in the Gastritis market.

North America will register the highest growth rate of 36.1% among the other regions. Therefore, the Gastritis market in North America is expected to garner significant business opportunities for the vendors during the forecast period.

US, Canada, Mexico, Germany, UK, France, Italy, Spain, The Netherlands, Russia, China, Japan, India, South Korea, Indonesia, Thailand, Singapore, Australia, Brazil, South Africa, UAE, Saudi Arabia, Turkey

  • Pervasive helicobacter pylori infection and detrimental lifestyle factors is the driving factor this market.

The Gastritis market vendors should focus on grabbing business opportunities from the Route of administration segment as it accounted for the largest market share in the base year.