Glass Fiber Veil Market Analysis APAC, North America, Europe, Middle East and Africa, South America - US, China, India, Germany, UK - Size and Forecast 2024-2028

Glass Fiber Veil Market Analysis APAC, North America, Europe, Middle East and Africa, South America - US, China, India, Germany, UK - Size and Forecast 2024-2028

Published: Feb 2024 167 Pages SKU: IRTNTR77580

Market Overview at a Glance

$386.31 Mn
Market Opportunity
7.22%
CAGR
6.5
YoY growth 2023-2024(%)

Glass Fiber Veil Market Forecast 2024-2028

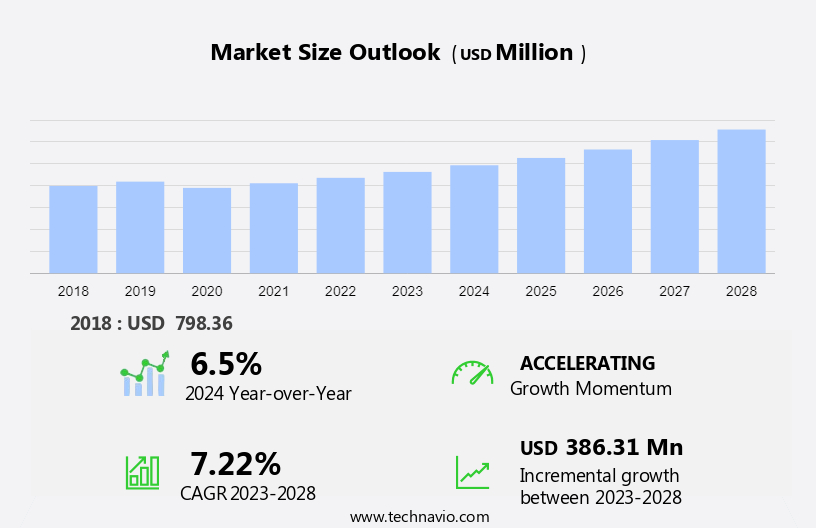
The glass fiber veil market size is forecast to increase by USD 386.31 million, at a CAGR of 7.22% between 2023 and 2028.  The growth rate of the market depends on several factors, including high demand for glass fiber veils in pipe wrapping applications, growing demand for glass fiber veils for waterproofing of building structures, and increasing use of glass fiber veils as filtration material.

What will be the  Market Size During the Forecast Period?

Glass Fiber Veil Market Size

Request Free Sample in PDF

Market Definition 

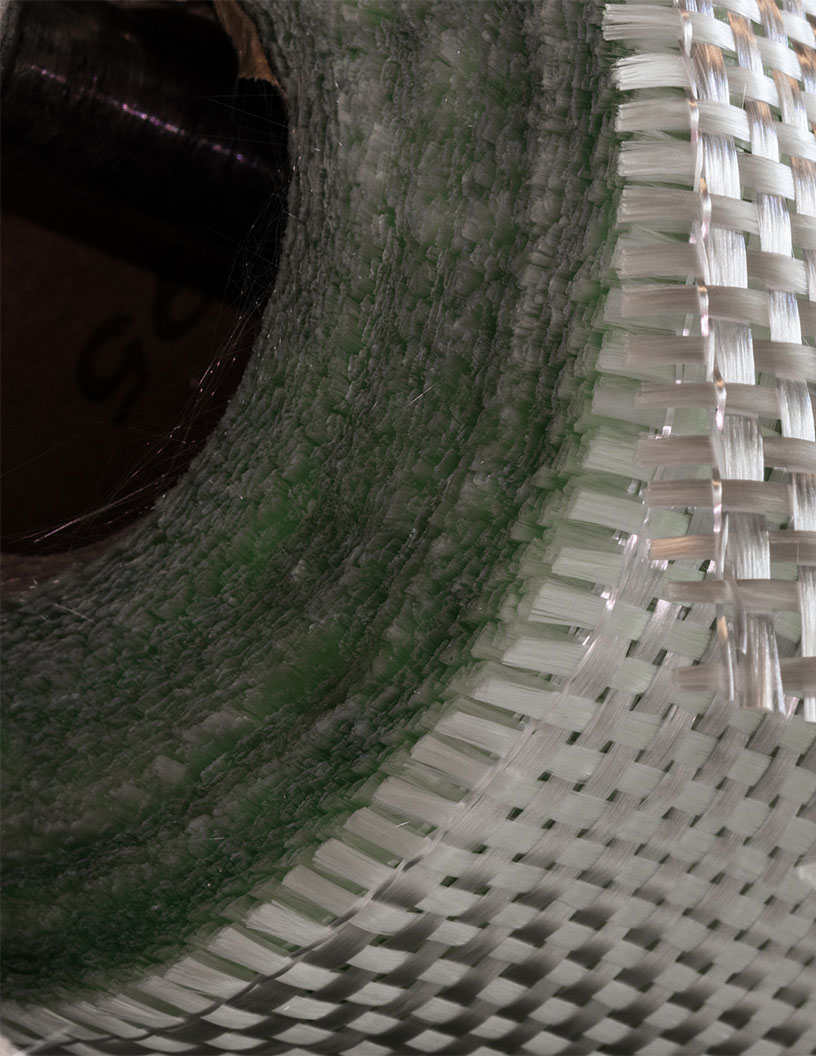
A glass fiber veil is a non-woven fabric made from fine strands of glass fibers. These fibers are typically manufactured through a process called continuous filament mat (CFM) production, where molten glass is extruded into thin fibers and then bonded together to form a fabric. The resulting veil has a lightweight and flexible structure with a smooth surface.

To Know more about the market report  Request Free Sample

Market Dynamics 

Key Market Growth Analysis Driver

The increasing use of glass fiber veils as filtration material is notably driving market growth. These are widely used in air filtration systems, including HVAC filters, automotive cabin air filters, and industrial dust collection filters. The fine fibers of glass fiber veils can capture airborne particles such as dust, pollen, and pollutants effectively, improving indoor air quality and protecting equipment and machinery. These are also employed in liquid filtration applications, including water treatment, oil filtration, and chemical processing. The porous structure enables the efficient filtration of suspended solids, contaminants, and impurities from liquids, ensuring clean and purified fluids for various industrial processes and applications.

Moreover, they are resistant to chemical degradation and are compatible with a wide range of chemicals, acids, and alkalis. They can be used in filtration systems that deal with aggressive chemical solutions, corrosive liquids, and hazardous materials, providing reliable filtration performance and long-term durability in harsh chemical environments, which may positively impact the growth of the market during the forecast period.

Significant  Market Trends and Analysis

Growing demand for prepainted glass fiber veils is an emerging trend shaping market growth. This is particularly important in applications where aesthetics are crucial, such as automotive parts, architectural panels, and consumer goods. The prepainted coating provides an additional layer of protection to the fiberglass substrate, helping prevent damage due to exposure to harsh environmental conditions, chemicals, and mechanical abrasion. This enhances the durability and longevity of the composite material. Manufacturers are increasingly focusing on environment-friendly coatings for prepainted glass fiber veils, which comply with regulatory standards and sustainability objectives.

However, this aligns with the growing demand for eco-friendly products among consumers and industries. As industries continue to seek lightweight, durable, and visually appealing materials, the demand for prepainted glass fiber veils is expected to grow. This growth is driven by factors such as increasing construction activities, automotive production, and consumer preference for high-quality products, which, in turn, will have a positive impact on the growth of the market during the forecast period.

Major Challenge

Fluctuations in raw material costs are a significant challenge hindering market growth. The primary raw material for this product is glass, which is derived from silica sand, limestone, and other minerals. Fluctuations in the prices of these raw materials can impact the overall cost of production of these fibers, thereby affecting its cost. Resins are used to bind the glass fibers together during production. The prices of resins, such as polyester or epoxy resins, can vary due to factors such as changes in raw material costs (e.g., petrochemical prices), supply and demand dynamics, and market conditions. The manufacturing of glass fibers and veils involves energy-intensive processes, including melting glass and curing resins. 

Further, Fluctuations in transportation costs, including fuel prices and shipping rates, can influence overall production costs and product pricing. They are traded globally and therefore, currency exchange rates can have an impact on the costs of raw materials and finished products, especially if raw materials are imported or exported. Currency fluctuations may negatively affect the competitiveness of manufacturers and their pricing strategies. Thus, fluctuations in raw material prices may hamper market growth during the forecast period. 

Segmentation by End-user, Type , and Geography

 End-user Analysis

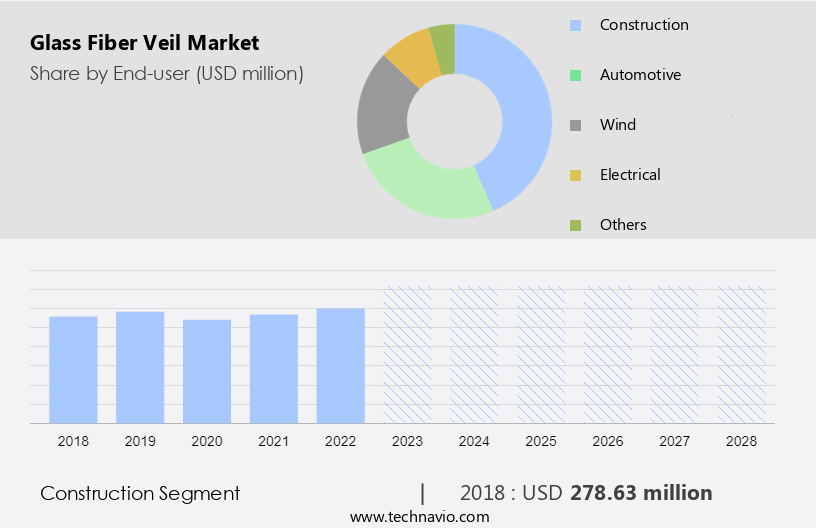
The market share growth by the construction segment will be significant during the forecast years. Glass fiber veils are incorporated into roofing membranes to provide reinforcement, durability, and weather resistance. It enhances the strength and tear resistance of roofing materials, such as bitumen membranes, single-ply membranes, and liquid-applied roofing systems, extending their lifespan and protecting buildings from water ingress. 

Glass Fiber Veil Market Size

Get a glance at the market contribution of the End User  segment Request Free Sample

The construction segment was the largest and was valued at USD 278.68 million in 2018. Glass fiber veils are incorporated into fireproofing materials and fire barriers to enhance fire resistance and safety in buildings. They are used in intumescent coatings, fire-resistant panels, and fireproof barriers to provide thermal insulation, flame retardant properties, and compartmentalization, minimizing the spread of fire and protecting occupants and assets. As construction activities related to infrastructure projects, such as roads, bridges, airports, and utilities, increase across the world, there is a higher demand for materials. These veils are used in various construction applications, including reinforced concrete that is used for structural elements like beams, columns, and foundations. Thus, due to all these applications, the demand for such veils from the construction sector is expected to surge, which, in turn, may have a positive impact on market growth during the forecast period. 

Type Analysis 

Based on the type, the market has been segmented into wet laid process and dry laid process. The wet laid process?segment will account for the largest share of this segment.?Wet-laid glass fiber veils are typically manufactured using the wet-laid process, where glass fiber is dispersed in water and then formed into a mat on a moving wire screen. This mat is then bonded together using a binder or adhesive and dried to form a cohesive, nonwoven fabric of glass. Wet-laid glass fiber veils offer excellent uniformity, porosity, and strength, making them suitable for demanding applications, such as composite reinforcement in automotive and aerospace components, surface coatings, and filtration media in air and water purification systems. Overall, the growing recognition of the benefits offered by wet-laid glass fiber veils, coupled with advancements in production technology and increasing demand from various industries, will boost the growth of the wed-laid segment of the market during the forecast period.

Region Analysis

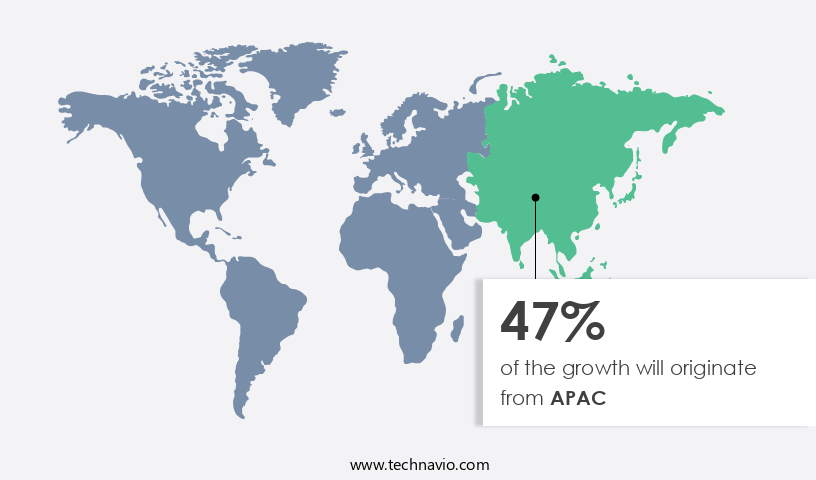
APAC is estimated to contribute 47% to the growth of the global market during the projection period. Technavio's analysts have provided extensive insight into the market forecasting, detailing the regional trends and drivers influencing the market's trajectory throughout the projection period.

Glass Fiber Veil Market Share by Geography

For more insights on the market share of various regions Request Free Sample

APAC is experiencing rapid industrialization and urbanization, driving the demand for construction materials, automotive components, and industrial applications. Glass fiber veils are integral to the growth of these sectors, catering to their demand in applications such as reinforced concrete, lightweight automotive parts, and industrial filtration systems. APAC is home to some of the largest automotive markets across the globe, including China, Japan, and South Korea. The automotive sector in APAC is increasingly adopting lightweight materials like glass fiber veils to improve fuel efficiency, reduce emissions, and enhance performance in automobiles. APAC is witnessing significant growth in the number of renewable energy installations, particularly wind energy. Such veils are essential components as they are used in wind turbine blades for reinforcement and durability, driving the demand in the regional renewable energy sector.

In addition, the oil and gas sector in the APAC region is expanding, driven by increasing demand for energy, rising exploration and production activities, and investments in downstream refinery and petrochemical projects. Such veils are utilized in pipe-wrapping systems to protect oil and gas pipelines from corrosion, abrasion, and mechanical damage, particularly in offshore and onshore oil and gas installations. Due to its high adoption in various applications, the regional market is expected to witness growth during the forecast period.

Key Companies

Companies are implementing various market growth and forecasting strategies by analyzing factors such as strategic alliances, partnerships, mergers and acquisitions, geographical expansion, and product or service launches to enhance their presence in the market.

ACP Composites Inc - The company offers a glass fiber veil, which can be used to provide a smooth covering for composite structures or to add stiffness with minimal weight gain and thickness.

The report also includes detailed analyses of the competitive landscape of the market and information about 15 market companies, including ACP Composites Inc., CA Composites, Chang Zhou Matex Composites Co., Ltd., Composite Envisions LLC, CTech LLC, Dymriton, EAS Fiberglass Co., Ltd., Feroca, S.A., Greenlight Surf Co, Hollingsworth and Vose, Hubei Apex Technology Co., Ltd., Multi-Foil New Materials Co., Ltd., Nanjing EFG Co.,Ltd, Owens Corning, RESINECO Composites, and  Sinauva Composites Co., Ltd.

Qualitative and quantitative analysis of companies has been conducted to help clients understand the wider business environment as well as the strengths and weaknesses of key market players. Data is qualitatively analyzed to categorize companies as pure play, category-focused, industry-focused, and diversified; it is quantitatively analyzed to categorize companies as dominant, leading, strong, tentative, and weak.

Segment Overview

The market research and growth forecast report predicts market growth by revenue at global, regional & country levels and provides an analysis of the latest trends and growth opportunities from 2018-2028. 

  • End-user Outlook 
    • Construction
    • Automotive
    • Wind
    • Electrical
    • Others
  • Type Outlook
    • Wet laid process
    • Dry laid process
  • Region Outlook 
    • North America
      • The U.S.
      • Canada
    • South America
      • Chile
      • Brazil
      • Argentina 
    • Europe
      • The U.K.
      • Germany
      • France
      • Rest of Europe
    • APAC
      • China
      • India
    • Middle East & Africa
      • Saudi Arabia
      • South Africa
      • Rest of the Middle East & Africa

Market Analyst Overview 

The glass fiber veil market is poised for exponential growth, witnessing increased demand in various applications such as roof materials, plasterboard, electronics, automobiles, floor coverings, and more. This growth trend is not only limited to specific regions but extends globally, offering lucrative opportunities, especially in commercial development. Major key players are actively shaping this market within the industry during the projected period. The market analysis involves both quantitative and qualitative data, covering aspects like product or service penetration, country GDP, end-application industries, and consumer buying behavior.

Scenarios related to economics, politics, and society are considered, with a focus on market segments and outlook. Company profiles, end-use industries, and product or service types are vital components, along with in-depth analyses of growth drivers, restraints, challenges, macroeconomic factors, value chains, pricing, and new business development, providing a comprehensive perspective and revealing promising investment opportunities.

Market Scope

Report Coverage

Details

Page number

167

Base year

2023

Historic period

2018 - 2022

Forecast period

2024-2028

Growth momentum & CAGR

Accelerate at a CAGR of 7.22%

Market growth 2024-2028

USD 386.31 million

Market structure

Fragmented

YoY growth 2023-2024(%)

6.5

Regional analysis

APAC, North America, Europe, Middle East and Africa, and South America

Performing market contribution

APAC at 47%

Key countries

US, China, India, Germany, and UK

Competitive landscape

Leading Companies, Market Positioning of Companies, Competitive Strategies, and Industry Risks

Key companies profiled

ACP Composites Inc., CA Composites, Chang Zhou Matex Composites Co., Ltd., Composite Envisions LLC, CTech LLC, Dymriton , EAS Fiberglass Co., Ltd., Feroca, S.A., Greenlight Surf Co, Hollingsworth and Vose, Hubei Apex Technology Co., Ltd., Multi-Foil New Materials Co., Ltd., Nanjing EFG Co.,Ltd, Owens Corning, RESINECO Composites, and  Sinauva Composites Co., Ltd.

Market dynamics

Parent market analysis, Market growth inducers and obstacles, Fast-growing and slow-growing segment analysis, COVID-19 impact and recovery analysis and future consumer dynamics, Market condition analysis for the forecast period

Customization purview

If our report has not included the data that you are looking for, you can reach out to our analysts and get segments customized.

Request Free Sample

What are the Key Data Covered in this Market Research Report?

  • CAGR of the market forecast during the forecast period
  • Detailed information on factors that will drive the growth of the market  between 2024 and 2028
  • Precise estimation of the size of the market  size and its contribution to the market in focus on the parent market
  • Accurate predictions about upcoming trends and changes in consumer behavior
  • Growth of the market industry across APAC, North America, Europe, Middle East and Africa, and South America
  • Thorough market analysis and report of the market’s competitive landscape and detailed information about companies
  • Comprehensive analysis of factors that will challenge the growth of market companies

We can help! Our analysts can customize this market research report to meet your requirements. Get in touch

1 Executive Summary

  • 1.1 Market overview
    • Exhibit 01: Executive Summary – Chart on Market Overview
    • Exhibit 02: Executive Summary – Data Table on Market Overview
    • Exhibit 03: Executive Summary – Chart on Global Market Characteristics
    • Exhibit 04: Executive Summary – Chart on Market by Geography
    • Exhibit 05: Executive Summary – Chart on Market Segmentation by End-user
    • Exhibit 06: Executive Summary – Chart on Market Segmentation by Type
    • Exhibit 07: Executive Summary – Chart on Incremental Growth
    • Exhibit 08: Executive Summary – Data Table on Incremental Growth
    • Exhibit 09: Executive Summary – Chart on Vendor Market Positioning

2 Market Landscape

  • 2.1 Market ecosystem
    • Exhibit 10: Parent market
    • Exhibit 11: Market Characteristics

3 Market Sizing

  • 3.1 Market definition
    • Exhibit 12: Offerings of vendors included in the market definition
  • 3.2 Market segment analysis
    • Exhibit 13: Market segments
  • 3.3 Market size 2023
    • 3.4 Market outlook: Forecast for 2023-2028
      • Exhibit 14: Chart on Global - Market size and forecast 2023-2028 ($ million)
      • Exhibit 15: Data Table on Global - Market size and forecast 2023-2028 ($ million)
      • Exhibit 16: Chart on Global Market: Year-over-year growth 2023-2028 (%)
      • Exhibit 17: Data Table on Global Market: Year-over-year growth 2023-2028 (%)

    4 Historic Market Size

    • 4.1 Global glass fiber veil market 2018 - 2022
      • Exhibit 18: Historic Market Size – Data Table on global glass fiber veil market 2018 - 2022 ($ million)
    • 4.2 End-user Segment Analysis 2018 - 2022
      • Exhibit 19: Historic Market Size – End-user Segment 2018 - 2022 ($ million)
    • 4.3 Type Segment Analysis 2018 - 2022
      • Exhibit 20: Historic Market Size – Type Segment 2018 - 2022 ($ million)
    • 4.4 Geography Segment Analysis 2018 - 2022
      • Exhibit 21: Historic Market Size – Geography Segment 2018 - 2022 ($ million)
    • 4.5 Country Segment Analysis 2018 - 2022
      • Exhibit 22: Historic Market Size – Country Segment 2018 - 2022 ($ million)

    5 Five Forces Analysis

    • 5.1 Five forces summary
      • Exhibit 23: Five forces analysis - Comparison between 2023 and 2028
    • 5.2 Bargaining power of buyers
      • Exhibit 24: Chart on Bargaining power of buyers – Impact of key factors 2023 and 2028
    • 5.3 Bargaining power of suppliers
      • Exhibit 25: Bargaining power of suppliers – Impact of key factors in 2023 and 2028
    • 5.4 Threat of new entrants
      • Exhibit 26: Threat of new entrants – Impact of key factors in 2023 and 2028
    • 5.5 Threat of substitutes
      • Exhibit 27: Threat of substitutes – Impact of key factors in 2023 and 2028
    • 5.6 Threat of rivalry
      • Exhibit 28: Threat of rivalry – Impact of key factors in 2023 and 2028
    • 5.7 Market condition
      • Exhibit 29: Chart on Market condition - Five forces 2023 and 2028

    6 Market Segmentation by End-user

    • 6.1 Market segments
      • Exhibit 30: Chart on End-user - Market share 2023-2028 (%)
      • Exhibit 31: Data Table on End-user - Market share 2023-2028 (%)
    • 6.2 Comparison by End-user
      • Exhibit 32: Chart on Comparison by End-user
      • Exhibit 33: Data Table on Comparison by End-user
    • 6.3 Construction - Market size and forecast 2023-2028
      • Exhibit 34: Chart on Construction - Market size and forecast 2023-2028 ($ million)
      • Exhibit 35: Data Table on Construction - Market size and forecast 2023-2028 ($ million)
      • Exhibit 36: Chart on Construction - Year-over-year growth 2023-2028 (%)
      • Exhibit 37: Data Table on Construction - Year-over-year growth 2023-2028 (%)
    • 6.4 Automotive - Market size and forecast 2023-2028
      • Exhibit 38: Chart on Automotive - Market size and forecast 2023-2028 ($ million)
      • Exhibit 39: Data Table on Automotive - Market size and forecast 2023-2028 ($ million)
      • Exhibit 40: Chart on Automotive - Year-over-year growth 2023-2028 (%)
      • Exhibit 41: Data Table on Automotive - Year-over-year growth 2023-2028 (%)
    • 6.5 Wind - Market size and forecast 2023-2028
      • Exhibit 42: Chart on Wind - Market size and forecast 2023-2028 ($ million)
      • Exhibit 43: Data Table on Wind - Market size and forecast 2023-2028 ($ million)
      • Exhibit 44: Chart on Wind - Year-over-year growth 2023-2028 (%)
      • Exhibit 45: Data Table on Wind - Year-over-year growth 2023-2028 (%)
    • 6.6 Electrical - Market size and forecast 2023-2028
      • Exhibit 46: Chart on Electrical - Market size and forecast 2023-2028 ($ million)
      • Exhibit 47: Data Table on Electrical - Market size and forecast 2023-2028 ($ million)
      • Exhibit 48: Chart on Electrical - Year-over-year growth 2023-2028 (%)
      • Exhibit 49: Data Table on Electrical - Year-over-year growth 2023-2028 (%)
    • 6.7 Others - Market size and forecast 2023-2028
      • Exhibit 50: Chart on Others - Market size and forecast 2023-2028 ($ million)
      • Exhibit 51: Data Table on Others - Market size and forecast 2023-2028 ($ million)
      • Exhibit 52: Chart on Others - Year-over-year growth 2023-2028 (%)
      • Exhibit 53: Data Table on Others - Year-over-year growth 2023-2028 (%)
    • 6.8 Market opportunity by End-user
      • Exhibit 54: Market opportunity by End-user ($ million)
      • Exhibit 55: Data Table on Market opportunity by End-user ($ million)

    7 Market Segmentation by Type

    • 7.1 Market segments
      • Exhibit 56: Chart on Type - Market share 2023-2028 (%)
      • Exhibit 57: Data Table on Type - Market share 2023-2028 (%)
    • 7.2 Comparison by Type
      • Exhibit 58: Chart on Comparison by Type
      • Exhibit 59: Data Table on Comparison by Type
    • 7.3 Wet laid process - Market size and forecast 2023-2028
      • Exhibit 60: Chart on Wet laid process - Market size and forecast 2023-2028 ($ million)
      • Exhibit 61: Data Table on Wet laid process - Market size and forecast 2023-2028 ($ million)
      • Exhibit 62: Chart on Wet laid process - Year-over-year growth 2023-2028 (%)
      • Exhibit 63: Data Table on Wet laid process - Year-over-year growth 2023-2028 (%)
    • 7.4 Dry laid process - Market size and forecast 2023-2028
      • Exhibit 64: Chart on Dry laid process - Market size and forecast 2023-2028 ($ million)
      • Exhibit 65: Data Table on Dry laid process - Market size and forecast 2023-2028 ($ million)
      • Exhibit 66: Chart on Dry laid process - Year-over-year growth 2023-2028 (%)
      • Exhibit 67: Data Table on Dry laid process - Year-over-year growth 2023-2028 (%)
    • 7.5 Market opportunity by Type
      • Exhibit 68: Market opportunity by Type ($ million)
      • Exhibit 69: Data Table on Market opportunity by Type ($ million)

    8 Customer Landscape

    • 8.1 Customer landscape overview
      • Exhibit 70: Analysis of price sensitivity, lifecycle, customer purchase basket, adoption rates, and purchase criteria

    9 Geographic Landscape

    • 9.1 Geographic segmentation
      • Exhibit 71: Chart on Market share by geography 2023-2028 (%)
      • Exhibit 72: Data Table on Market share by geography 2023-2028 (%)
    • 9.2 Geographic comparison
      • Exhibit 73: Chart on Geographic comparison
      • Exhibit 74: Data Table on Geographic comparison
    • 9.3 APAC - Market size and forecast 2023-2028
      • Exhibit 75: Chart on APAC - Market size and forecast 2023-2028 ($ million)
      • Exhibit 76: Data Table on APAC - Market size and forecast 2023-2028 ($ million)
      • Exhibit 77: Chart on APAC - Year-over-year growth 2023-2028 (%)
      • Exhibit 78: Data Table on APAC - Year-over-year growth 2023-2028 (%)
    • 9.4 North America - Market size and forecast 2023-2028
      • Exhibit 79: Chart on North America - Market size and forecast 2023-2028 ($ million)
      • Exhibit 80: Data Table on North America - Market size and forecast 2023-2028 ($ million)
      • Exhibit 81: Chart on North America - Year-over-year growth 2023-2028 (%)
      • Exhibit 82: Data Table on North America - Year-over-year growth 2023-2028 (%)
    • 9.5 Europe - Market size and forecast 2023-2028
      • Exhibit 83: Chart on Europe - Market size and forecast 2023-2028 ($ million)
      • Exhibit 84: Data Table on Europe - Market size and forecast 2023-2028 ($ million)
      • Exhibit 85: Chart on Europe - Year-over-year growth 2023-2028 (%)
      • Exhibit 86: Data Table on Europe - Year-over-year growth 2023-2028 (%)
    • 9.6 Middle East and Africa - Market size and forecast 2023-2028
      • Exhibit 87: Chart on Middle East and Africa - Market size and forecast 2023-2028 ($ million)
      • Exhibit 88: Data Table on Middle East and Africa - Market size and forecast 2023-2028 ($ million)
      • Exhibit 89: Chart on Middle East and Africa - Year-over-year growth 2023-2028 (%)
      • Exhibit 90: Data Table on Middle East and Africa - Year-over-year growth 2023-2028 (%)
    • 9.7 South America - Market size and forecast 2023-2028
      • Exhibit 91: Chart on South America - Market size and forecast 2023-2028 ($ million)
      • Exhibit 92: Data Table on South America - Market size and forecast 2023-2028 ($ million)
      • Exhibit 93: Chart on South America - Year-over-year growth 2023-2028 (%)
      • Exhibit 94: Data Table on South America - Year-over-year growth 2023-2028 (%)
    • 9.8 China - Market size and forecast 2023-2028
      • Exhibit 95: Chart on China - Market size and forecast 2023-2028 ($ million)
      • Exhibit 96: Data Table on China - Market size and forecast 2023-2028 ($ million)
      • Exhibit 97: Chart on China - Year-over-year growth 2023-2028 (%)
      • Exhibit 98: Data Table on China - Year-over-year growth 2023-2028 (%)
    • 9.9 US - Market size and forecast 2023-2028
      • Exhibit 99: Chart on US - Market size and forecast 2023-2028 ($ million)
      • Exhibit 100: Data Table on US - Market size and forecast 2023-2028 ($ million)
      • Exhibit 101: Chart on US - Year-over-year growth 2023-2028 (%)
      • Exhibit 102: Data Table on US - Year-over-year growth 2023-2028 (%)
    • 9.10 Germany - Market size and forecast 2023-2028
      • Exhibit 103: Chart on Germany - Market size and forecast 2023-2028 ($ million)
      • Exhibit 104: Data Table on Germany - Market size and forecast 2023-2028 ($ million)
      • Exhibit 105: Chart on Germany - Year-over-year growth 2023-2028 (%)
      • Exhibit 106: Data Table on Germany - Year-over-year growth 2023-2028 (%)
    • 9.11 India - Market size and forecast 2023-2028
      • Exhibit 107: Chart on India - Market size and forecast 2023-2028 ($ million)
      • Exhibit 108: Data Table on India - Market size and forecast 2023-2028 ($ million)
      • Exhibit 109: Chart on India - Year-over-year growth 2023-2028 (%)
      • Exhibit 110: Data Table on India - Year-over-year growth 2023-2028 (%)
    • 9.12 UK - Market size and forecast 2023-2028
      • Exhibit 111: Chart on UK - Market size and forecast 2023-2028 ($ million)
      • Exhibit 112: Data Table on UK - Market size and forecast 2023-2028 ($ million)
      • Exhibit 113: Chart on UK - Year-over-year growth 2023-2028 (%)
      • Exhibit 114: Data Table on UK - Year-over-year growth 2023-2028 (%)
    • 9.13 Market opportunity by geography
      • Exhibit 115: Market opportunity by geography ($ million)
      • Exhibit 116: Data Tables on Market opportunity by geography ($ million)

    10 Drivers, Challenges, and Trends

    • 10.1 Market drivers
      • 10.2 Market challenges
        • 10.3 Impact of drivers and challenges
          • Exhibit 117: Impact of drivers and challenges in 2023 and 2028
        • 10.4 Market trends

          11 Vendor Landscape

          • 11.1 Overview
            • 11.2 Vendor landscape
              • Exhibit 118: Overview on Criticality of inputs and Factors of differentiation
            • 11.3 Landscape disruption
              • Exhibit 119: Overview on factors of disruption
            • 11.4 Industry risks
              • Exhibit 120: Impact of key risks on business

            12 Vendor Analysis

            • 12.1 Vendors covered
              • Exhibit 121: Vendors covered
            • 12.2 Market positioning of vendors
              • Exhibit 122: Matrix on vendor position and classification
            • 12.3 ACP Composites Inc.
              • Exhibit 123: ACP Composites Inc. - Overview
              • Exhibit 124: ACP Composites Inc. - Product / Service
              • Exhibit 125: ACP Composites Inc. - Key offerings
            • 12.4 CA Composites
              • Exhibit 126: CA Composites - Overview
              • Exhibit 127: CA Composites - Product / Service
              • Exhibit 128: CA Composites - Key offerings
            • 12.5 Chang Zhou Matex Composites Co., Ltd.
              • Exhibit 129: Chang Zhou Matex Composites Co., Ltd. - Overview
              • Exhibit 130: Chang Zhou Matex Composites Co., Ltd. - Product / Service
              • Exhibit 131: Chang Zhou Matex Composites Co., Ltd. - Key offerings
            • 12.6 Composite Envisions LLC
              • Exhibit 132: Composite Envisions LLC - Overview
              • Exhibit 133: Composite Envisions LLC - Product / Service
              • Exhibit 134: Composite Envisions LLC - Key offerings
            • 12.7 CTech LLC
              • Exhibit 135: CTech LLC - Overview
              • Exhibit 136: CTech LLC - Product / Service
              • Exhibit 137: CTech LLC - Key offerings
            • 12.8 Dymriton
              • Exhibit 138: Dymriton  - Overview
              • Exhibit 139: Dymriton  - Product / Service
              • Exhibit 140: Dymriton  - Key offerings
            • 12.9 EAS Fiberglass Co., Ltd.
              • Exhibit 141: EAS Fiberglass Co., Ltd. - Overview
              • Exhibit 142: EAS Fiberglass Co., Ltd. - Product / Service
              • Exhibit 143: EAS Fiberglass Co., Ltd. - Key offerings
            • 12.10 Feroca S.A.
              • Exhibit 144: Feroca S.A. - Overview
              • Exhibit 145: Feroca S.A. - Product / Service
              • Exhibit 146: Feroca S.A. - Key offerings
            • 12.11 Greenlight Surf Co
              • Exhibit 147: Greenlight Surf Co - Overview
              • Exhibit 148: Greenlight Surf Co - Product / Service
              • Exhibit 149: Greenlight Surf Co - Key offerings
            • 12.12 Hollingsworth and Vose
              • Exhibit 150: Hollingsworth and Vose - Overview
              • Exhibit 151: Hollingsworth and Vose - Product / Service
              • Exhibit 152: Hollingsworth and Vose - Key offerings
            • 12.13 Hubei Apex Technology Co., Ltd.
              • Exhibit 153: Hubei Apex Technology Co., Ltd. - Overview
              • Exhibit 154: Hubei Apex Technology Co., Ltd. - Product / Service
              • Exhibit 155: Hubei Apex Technology Co., Ltd. - Key offerings
            • 12.14 Multi-Foil New Materials Co., Ltd.
              • Exhibit 156: Multi-Foil New Materials Co., Ltd. - Overview
              • Exhibit 157: Multi-Foil New Materials Co., Ltd. - Product / Service
              • Exhibit 158: Multi-Foil New Materials Co., Ltd. - Key offerings
            • 12.15 Nanjing EFG Co.,Ltd
              • Exhibit 159: Nanjing EFG Co.,Ltd - Overview
              • Exhibit 160: Nanjing EFG Co.,Ltd - Product / Service
              • Exhibit 161: Nanjing EFG Co.,Ltd - Key offerings
            • 12.16 Owens Corning
              • Exhibit 162: Owens Corning - Overview
              • Exhibit 163: Owens Corning - Business segments
              • Exhibit 164: Owens Corning - Key news
              • Exhibit 165: Owens Corning - Key offerings
              • Exhibit 166: Owens Corning - Segment focus
            • 12.17 Sinauva Composites Co., Ltd.
              • Exhibit 167: Sinauva Composites Co., Ltd. - Overview
              • Exhibit 168: Sinauva Composites Co., Ltd. - Product / Service
              • Exhibit 169: Sinauva Composites Co., Ltd. - Key offerings

            13 Appendix

            • 13.1 Scope of the report
              • 13.2 Inclusions and exclusions checklist
                • Exhibit 170: Inclusions checklist
                • Exhibit 171: Exclusions checklist
              • 13.3 Currency conversion rates for US$
                • Exhibit 172: Currency conversion rates for US$
              • 13.4 Research methodology
                • Exhibit 173: Research methodology
                • Exhibit 174: Validation techniques employed for market sizing
                • Exhibit 175: Information sources
              • 13.5 List of abbreviations
                • Exhibit 176: List of abbreviations

              Research Methodology

              Technavio presents a detailed picture of the market by way of study, synthesis, and summation of data from multiple sources. The analysts have presented the various facets of the market with a particular focus on identifying the key industry influencers. The data thus presented is comprehensive, reliable, and the result of extensive research, both primary and secondary.

              INFORMATION SOURCES

              Primary sources

              • Manufacturers and suppliers
              • Channel partners
              • Industry experts
              • Strategic decision makers

              Secondary sources

              • Industry journals and periodicals
              • Government data
              • Financial reports of key industry players
              • Historical data
              • Press releases

              DATA ANALYSIS

              Data Synthesis

              • Collation of data
              • Estimation of key figures
              • Analysis of derived insights

              Data Validation

              • Triangulation with data models
              • Reference against proprietary databases
              • Corroboration with industry experts

              REPORT WRITING

              Qualitative

              • Market drivers
              • Market challenges
              • Market trends
              • Five forces analysis

              Quantitative

              • Market size and forecast
              • Market segmentation
              • Geographical insights
              • Competitive landscape

              Interested in this report?

              Get your sample now to see our research methodology and insights!

              Download Now

              Frequently Asked Questions

              Glass Fiber Veil market growth will increase by $ 386.31 mn during 2024-2028.

              The Glass Fiber Veil market is expected to grow at a CAGR of 7.22% during 2024-2028.

              Glass Fiber Veil market is segmented by End-user( Construction, Automotive, Wind, Electrical, Others) Type( Wet laid process, Dry laid process)

              ACP Composites Inc., CA Composites, Chang Zhou Matex Composites Co., Ltd., Composite Envisions LLC, CTech LLC, Dymriton , EAS Fiberglass Co., Ltd., Feroca, S.A., Greenlight Surf Co, Hollingsworth and Vose, Hubei Apex Technology Co., Ltd., Multi-Foil New Materials Co., Ltd., Nanjing EFG Co.,Ltd, Owens Corning, RESINECO Composites,  Sinauva Composites Co., Ltd. are a few of the key vendors in the Glass Fiber Veil market.

              APAC will register the highest growth rate of 47% among the other regions. Therefore, the Glass Fiber Veil market in APAC is expected to garner significant business opportunities for the vendors during the forecast period.

              US, China, India, Germany, UK

              • High demand for glass fiber veils in pipe wrapping applicationsGlass fiber veils provide excellent corrosion resistance is the driving factor this market.
              • making it an ideal material for wrapping pipes is the driving factor this market.
              • especially those used in corrosive environments such as chemical plants is the driving factor this market.
              • oil refineries is the driving factor this market.
              • and offshore platforms. Glass fiber veils enhance the mechanical strength of pipe systems by providing reinforcement. This is particularly important for pipelines that carry fluids under high pressure or are subjected to external forces. The use of glass fiber veils in pipe wrapping improves the durability and longevity of pipelines by protecting them from abrasion is the driving factor this market.
              • impact is the driving factor this market.
              • and environmental factors. This can help extend the service life of pipelines and reduce maintenance costs. Glass fiber veils offer thermal insulation properties is the driving factor this market.
              • which can help maintain the temperature of fluids transported through pipelines. This is beneficial in industries where temperature control is critical is the driving factor this market.
              • such as in the petrochemical and food processing sectors. Glass fiber veils are resistant to a wide range of chemicals is the driving factor this market.
              • acids is the driving factor this market.
              • and alkalis is the driving factor this market.
              • making them suitable for use in pipelines that transport corrosive or reactive substances. Glass fiber veils can be easily applied to pipes using various techniques is the driving factor this market.
              • such as wrapping is the driving factor this market.
              • winding is the driving factor this market.
              • or laminating. This makes them a cost-effective solution for protecting pipelines during construction or maintenance activities. Thus is the driving factor this market.
              • the high demand for glass fiber veils in pipe wrapping applications is driven by their superior properties is the driving factor this market.
              • including corrosion resistance is the driving factor this market.
              • mechanical strength is the driving factor this market.
              • durability is the driving factor this market.
              • and ease of application is the driving factor this market.
              • making glass fiber veils an essential component in the construction and maintenance of pipelines across various industries. Thus is the driving factor this market.
              • the high demand for glass fiber veils in pipe wrapping applications may fuel the growth of the global glass fiber veil market during the forecast period. is the driving factor this market.

              The Glass Fiber Veil market vendors should focus on grabbing business opportunities from the Construction segment as it accounted for the largest market share in the base year.
              RIA - Research AI Assistant
              Ask RIA