Hydraulic Accumulators Market Analysis, Size, and Forecast 2026-2030: APAC (China, Japan, and India), North America (US, Canada, and Mexico), Europe (Germany, UK, and France), Middle East and Africa (Saudi Arabia, UAE, and South Africa), South America (Brazil, Argentina, and Colombia), and Rest of World (ROW)

Hydraulic Accumulators Market Analysis, Size, and Forecast 2026-2030:
APAC (China, Japan, and India), North America (US, Canada, and Mexico), Europe (Germany, UK, and France), Middle East and Africa (Saudi Arabia, UAE, and South Africa), South America (Brazil, Argentina, and Colombia), and Rest of World (ROW)

Published: May 2026 302 Pages SKU: IRTNTR45839

Market Overview at a Glance

$65.70 Mn
Market Opportunity
5.6%
CAGR 2025 - 2030
53.7%
APAC Growth
$103.43 Mn
Bladder segment 2024

Hydraulic Accumulators Market Size 2026-2030

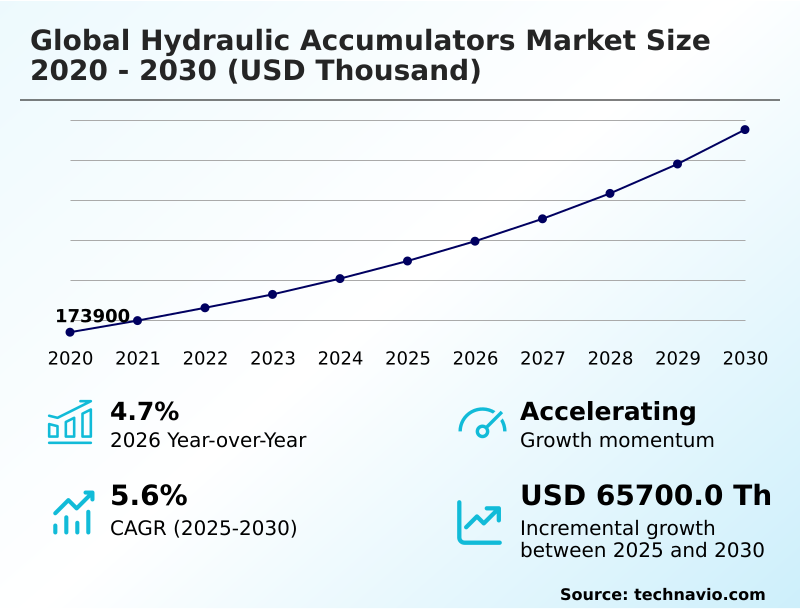
The Hydraulic Accumulators Market size was valued at USD 209.50 million in 2025, growing at a CAGR of 5.6% during the forecast period 2026-2030.

Major Market Trends & Insights

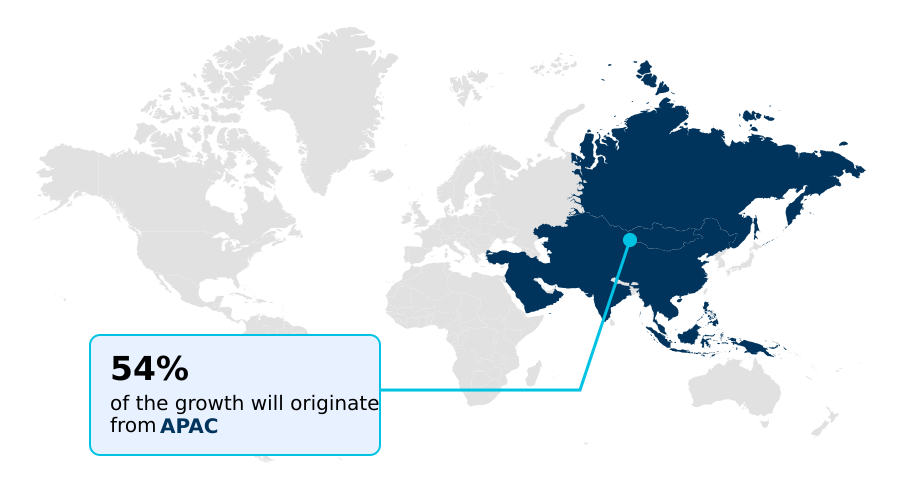
  • APAC dominated the market and accounted for a 53.7% growth during the forecast period.
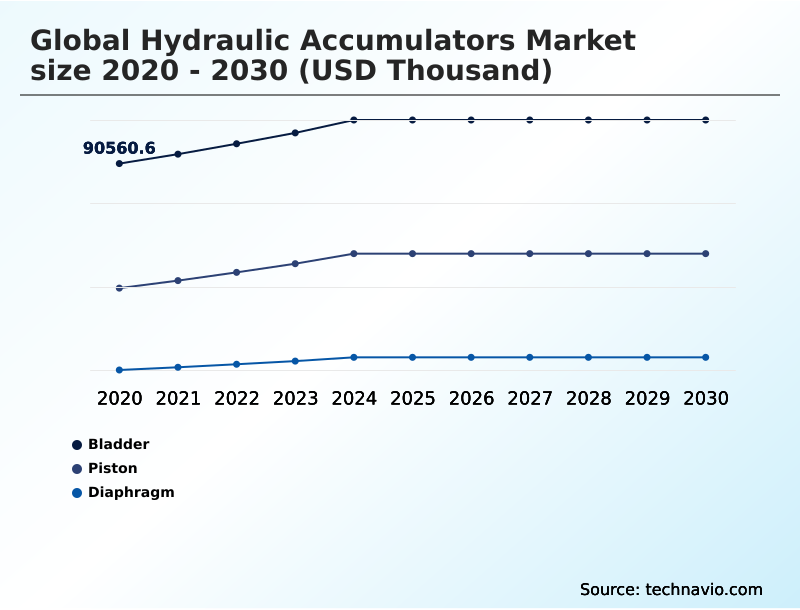
  • By Type - Bladder segment was valued at USD 103.43 million in 2024
  • By End-user - CM and MH segment accounted for the largest market revenue share in 2024

Market Size & Forecast

  • Historic Market Opportunities 2020-2024:
  • Market Future Opportunities 2025-2030: USD 65.70 million
  • CAGR from 2025 to 2030 : 5.6%

Market Summary

  • The hydraulic accumulators market is defined by its critical role in enhancing the performance and safety of fluid power systems, where proper energy storage can improve system efficiency by over 15%. In a typical manufacturing scenario, integrating a properly sized accumulator into a hydraulic press circuit reduces energy consumption and minimizes wear on the main pump.
  • This is achieved by storing pressurized fluid during low-demand cycles and releasing it to meet peak power needs, a process that can extend the lifespan of primary components by up to 25%. A primary driver is the modernization of aging industrial equipment, as companies seek to replace inefficient legacy systems.
  • Conversely, the market faces a significant challenge from the risk of leakage and seal failure, which can lead to costly operational downtime and environmental hazards if not addressed through robust design and predictive maintenance schedules. This balance between performance enhancement and reliability assurance shapes purchasing decisions across end-user industries.

What will be the Size of the Hydraulic Accumulators Market during the forecast period?

Get Key Insights on Market Forecast (PDF) Request Free Sample

How is the Hydraulic Accumulators Market Segmented?

The hydraulic accumulators industry research report provides comprehensive data (region-wise segment analysis), with forecasts and analysis for the period 2026-2030, as well as historical data from 2020-2024 for the following segments.

  • Type
    • Bladder
    • Piston
    • Diaphragm
  • End-user
    • CM and MH
    • Agriculture and forestry
    • Oil and gas
    • Others
  • Product
    • Horizontal mounted
    • Vertical mounted
    • Wall mounted
  • Geography
    • APAC
      • China
      • Japan
      • India
    • North America
      • US
      • Canada
      • Mexico
    • Europe
      • Germany
      • UK
      • France
    • Middle East and Africa
      • Saudi Arabia
      • UAE
      • South Africa
    • South America
      • Brazil
      • Argentina
      • Colombia
    • Rest of World (ROW)

How is the Hydraulic Accumulators Market Segmented by Type?

The bladder segment is estimated to witness significant growth during the forecast period.

The bladder segment's utility in the global hydraulic accumulators market is defined by its rapid response capabilities, with certain designs discharging energy up to 15% faster than other accumulator types.

These devices leverage a flexible elastomer bladder within a pressure vessel to separate gas and fluid, excelling in shock absorption and pulsation dampening.

Their high power density-to-size ratio makes them ideal for mobile equipment where space is a premium, contributing to a 10% reduction in overall system weight in some applications.

Advancements in material science have improved fluid power recovery and resistance to chemical degradation, extending operational life.

Consequently, their role in providing a supplemental or emergency power source ensures system integrity and operational continuity across various industrial settings, driving consistent adoption for applications demanding both speed and reliability.

Request Free Sample

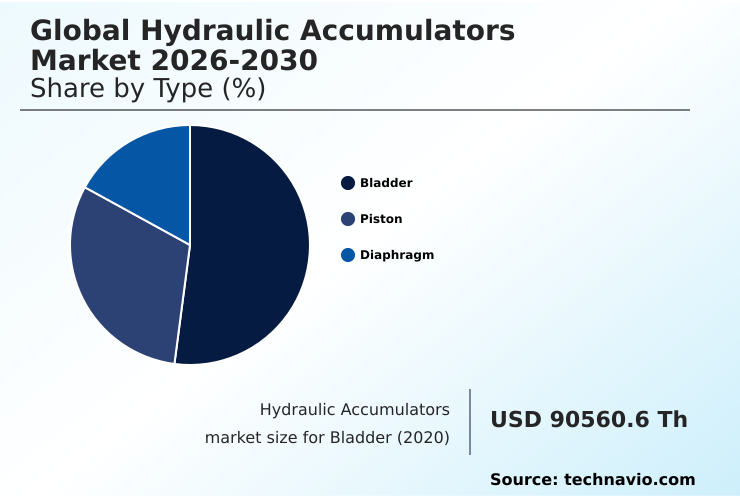
The Bladder segment was valued at USD 103.43 million in 2024 and showed a gradual increase during the forecast period.

Request Free Sample

How demand for the Hydraulic Accumulators market is rising in the leading region?

APAC is estimated to contribute 53.7% to the growth of the global market during the forecast period.Technavio’s analysts have elaborately explained the regional trends and drivers that shape the market during the forecast period.

See How Hydraulic Accumulators Market demand is rising in APAC Request Free Sample

Geographically, the global hydraulic accumulators market exhibits significant divergence, with APAC accounting for over 53% of the incremental growth, a stark contrast to North America's 23.77% share.

This dominance is propelled by countries like China, where the market is valued at over USD 37 billion, fueled by expansive infrastructure projects and a massive manufacturing base requiring high volumes of bladder accumulator and piston accumulator units.

In contrast, adoption in North America is often driven by the need to upgrade aging industrial facilities with more energy-efficient hydraulic systems to enhance hydraulic system reliability.

This regional difference also impacts supply chain strategies; APAC focuses on localized, high-volume production with an emphasis on elastomer bladder technology, while North America prioritizes specialized hydropneumatic accumulator components for sectors like aerospace, where moveable piston design and system pressure stabilization are critical.

What are the key Drivers, Trends, and Challenges in the Hydraulic Accumulators Market?

Our researchers analyzed the data with 2025 as the base year, along with the key drivers, trends, and challenges. A holistic analysis of drivers will help companies refine their marketing strategies to gain a competitive advantage.

  • Understanding the hydraulic accumulator working principle is fundamental for optimizing industrial and mobile equipment performance, where efficiency gains of up to 15% are achievable with correctly specified systems. The debate over bladder vs piston accumulator often concludes with application-specific needs; bladder types offer faster response, while piston models provide durability under higher pressures.
  • Accurate hydraulic accumulator sizing calculation is critical, as an undersized unit can fail to absorb shocks, while an oversized one adds unnecessary cost and weight. For instance, in systems where response time is less critical than high-pressure tolerance, piston accumulators are preferred, leading to a 10% lower failure rate in extreme-duty cycles.
  • Maintaining correct hydraulic accumulator precharge pressure is another crucial aspect of operational safety and efficiency. Technicians frequently perform a hydraulic accumulator failure analysis as part of predictive maintenance, a practice that can reduce catastrophic failures and unscheduled downtime. Identifying the symptoms of a bad hydraulic accumulator early, such as sluggish system response or pressure drops, allows for timely intervention.
  • This proactive approach to maintenance, which includes learning how to test a hydraulic accumulator effectively, is key to extending equipment life and ensuring reliable operation.

What are the key market drivers leading to the rise in the adoption of Hydraulic Accumulators Industry?

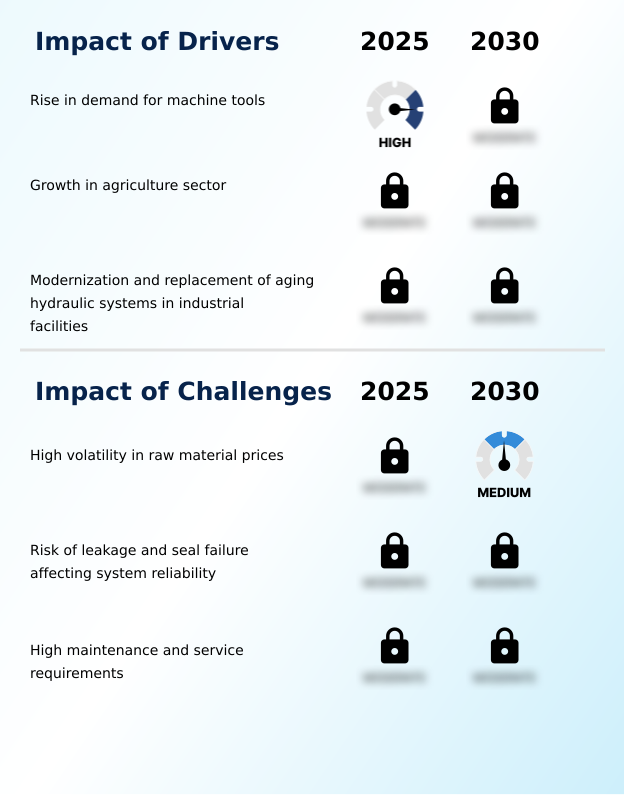
  • A key driver for the market is the rising demand for hydraulic accumulators within the machine tools sector.

  • The modernization of aging industrial infrastructure is a primary driver, with facilities reporting up to a 20% improvement in energy efficiency after replacing legacy equipment with modern high-pressure hydraulic systems.
  • This transition is fueled by the need to enhance system responsiveness and adhere to stricter operational safety standards.
  • The expansion of the agriculture sector, where mechanization rates in some regions are growing by 5% annually, also propels demand for reliable fluid power system components.
  • In these applications, precise pressure regulation is crucial for optimizing equipment lifespan extension and performance.
  • The adoption of advanced accumulators with proper nitrogen gas charging ensures consistent system pressure, supporting the demanding duty cycles of modern industrial hydraulic applications and hydraulic system design.

What are the market trends shaping the Hydraulic Accumulators Industry?

  • A prominent market trend is the rapid technological advancement of hydraulic accumulators. This development is primarily focused on enhancing energy efficiency across industrial and mobile applications.

  • Technological advancements are driving a significant shift toward smart hydraulic energy storage solutions that can improve overall hydraulic system efficiency by up to 20%. The integration of sensor technology for predictive maintenance integration is a key trend, allowing for real-time monitoring of accumulator performance and reducing unscheduled downtime by over 25% compared to traditional systems.
  • This focus on digitalization enables superior pulsation damping and dynamic load management in mobile hydraulic equipment and industrial machinery. As industries prioritize sustainability, the demand for systems capable of advanced energy recovery is increasing. This trend supports the development of more sophisticated motion control systems that offer enhanced hydraulic system stability and operational longevity.

What challenges does the Hydraulic Accumulators Industry face during its growth?

  • A significant challenge affecting industry growth is the high volatility in the prices of raw materials required for manufacturing hydraulic accumulators.

  • High volatility in raw material costs presents a major challenge, with prices for specialized steel and elastomers fluctuating by as much as 25% in a single year, directly impacting the total cost of ownership for end-users. This price instability complicates production planning and can lead to compromised hydraulic fluid containment if lower-quality materials are substituted.
  • Furthermore, the persistent risk of seal failure remains a critical issue, contributing to over 30% of unplanned downtime in certain high-pressure applications. Issues such as improper gas pre-charge, fluid contamination control, and vibration reduction are essential to mitigate leakage compensation problems. Managing these factors is crucial to prevent inconsistent fluid flow consistency and maintain system reliability.

Exclusive Technavio Analysis on Customer Landscape

The hydraulic accumulators market forecasting report includes the adoption lifecycle of the market, covering from the innovator’s stage to the laggard’s stage. It focuses on adoption rates in different regions based on penetration. Furthermore, the hydraulic accumulators market report also includes key purchase criteria and drivers of price sensitivity to help companies evaluate and develop their market growth analysis strategies.

Customer Landscape of Hydraulic Accumulators Industry

Competitive Landscape

Companies are implementing various strategies, such as strategic alliances, hydraulic accumulators market forecast, partnerships, mergers and acquisitions, geographical expansion, and product/service launches, to enhance their presence in the industry.

Accumulators Inc. - Offerings are centered on a diverse range of hydraulic energy storage devices, including bladder, piston, and diaphragm accumulators for varied industrial and mobile applications.

The industry research and growth report includes detailed analyses of the competitive landscape of the market and information about key companies, including:

  • Accumulators Inc.
  • Bailey International LLC
  • Bucher Hydraulics GmbH
  • Danfoss AS
  • Freudenberg and Co. KG
  • HANNON HYDRUALICS LLC
  • HAWE Hydraulik SE
  • HYDAC International GmbH
  • Hydrapac Italia Inc.
  • HYDRO LEDUC SA
  • Hydroll Oy
  • Parker Hannifin Corp.
  • Robert Bosch GmbH
  • Roth Hydraulics GmbH
  • Servi Group
  • Stauffenberg GmbH and Co. KG

Qualitative and quantitative analysis of companies has been conducted to help clients understand the wider business environment as well as the strengths and weaknesses of key industry players. Data is qualitatively analyzed to categorize companies as pure play, category-focused, industry-focused, and diversified; it is quantitatively analyzed to categorize companies as dominant, leading, strong, tentative, and weak.

Market Intelligence Radar: High-Impact Developments & Growth Signals

  • In the Aerospace and Defense industry, the push for lightweight materials to enhance fuel efficiency in next-generation aircraft has increased demand for compact hydraulic accumulators. This directly impacts the market by requiring innovations in designs that reduce component weight without compromising hydraulic system reliability or performance under high-pressure conditions.
  • The growing preference for fuel-efficient aircraft and the modernization of aviation fleets are creating new requirements for energy consumption reduction. This trend necessitates the integration of advanced hydraulic accumulators capable of superior energy recovery and dynamic load management, thereby improving the overall hydraulic system efficiency of aerospace platforms.
  • Advances in unmanned aerial vehicle (UAV) technology and the development of more complex electronic warfare systems have spurred the need for highly responsive and compact fluid power components. As a result, the market is seeing increased demand for specialized diaphragm and piston accumulators that support the precise motion control systems essential for these advanced defense applications.
  • Heightened geopolitical tensions and shifts in international trade agreements have altered supply chain dynamics for critical aerospace components. This has compelled manufacturers to diversify sourcing for high-strength metals and elastomers used in hydraulic accumulators, impacting production costs and necessitating more resilient hydraulic circuit design and logistics planning.

Dive into Technavio’s robust research methodology, blending expert interviews, extensive data synthesis, and validated models for unparalleled Hydraulic Accumulators Market insights. See full methodology.

Market Scope
Page number 302
Base year 2025
Historic period 2020-2024
Forecast period 2026-2030
Growth momentum & CAGR Accelerate at a CAGR of 5.6%
Market growth 2026-2030 USD 65700.0 thousand
Market structure Fragmented
YoY growth 2025-2026(%) 4.7%
Key countries China, Japan, India, South Korea, Australia, Indonesia, US, Canada, Mexico, Germany, UK, France, Italy, Spain, The Netherlands, Saudi Arabia, UAE, South Africa, Israel, Turkey, Brazil, Argentina and Colombia
Competitive landscape Leading Companies, Market Positioning of Companies, Competitive Strategies, and Industry Risks

Request Free Sample

Research Analyst Overview

  • The ecosystem of the global hydraulic accumulators market is a multi-layered value chain, where the construction and material handling (CM and MH) sector represents over 53% of end-user demand. The chain begins with suppliers of raw materials like high-strength steel and specialized elastomers, which are procured by component producers.
  • These components are then integrated by system manufacturers, including major industrial players like Robert Bosch GmbH and Parker Hannifin Corp., into complete hydraulic solutions. These solutions are distributed through direct sales and channel partners to end-users in key industries such as agriculture and oil and gas.
  • Regulatory bodies influence design by setting safety and environmental standards, while R&D entities drive innovation in areas like energy efficiency and smart monitoring. Piston accumulators, favored for their durability in high-pressure environments, constitute approximately 32% of the market, highlighting a clear preference for robust solutions in demanding applications.

What are the Key Data Covered in this Hydraulic Accumulators Market Research and Growth Report?

  • What is the expected growth of the Hydraulic Accumulators Market between 2026 and 2030?

    • The Hydraulic Accumulators Market is expected to grow by USD 65.70 million during 2026-2030, registering a CAGR of 5.6%. Year-over-year growth in 2026 is estimated at 4.7%%. This acceleration is shaped by rise in demand for machine tools, which is intensifying demand across multiple end-use verticals covered in the report.

  • What segmentation does the market report cover?

    • The report is segmented by Type (Bladder, Piston, and Diaphragm), End-user (CM and MH, Agriculture and forestry, Oil and gas, and Others), Product (Horizontal mounted, Vertical mounted, and Wall mounted) and Geography (APAC, North America, Europe, Middle East and Africa, South America). Among these, the Bladder segment is estimated to witness significant growth during the forecast period, driven by rising adoption across key application areas. Each segment includes detailed qualitative and quantitative analysis, along with historical data from 2020-2024 and forecasts through 2030 with year-over-year growth rates.

  • Which regions are analyzed in the report?

    • The report covers APAC, North America, Europe, Middle East and Africa and South America. APAC is estimated to contribute 53.7% to market growth during the forecast period. Country-level analysis includes China, Japan, India, South Korea, Australia, Indonesia, US, Canada, Mexico, Germany, UK, France, Italy, Spain, The Netherlands, Saudi Arabia, UAE, South Africa, Israel, Turkey, Brazil, Argentina and Colombia, with dedicated market size tables and year-over-year growth for each.

  • What are the key growth drivers and market challenges?

    • The primary driver is rise in demand for machine tools, which is accelerating investment and industry demand. The main challenge is high volatility in raw material prices, creating operational barriers for key market participants. The report quantifies the impact of each driver and challenge across 2026 and 2030 with comparative analysis.

  • Who are the major players in the Hydraulic Accumulators Market?

    • Key vendors include Accumulators Inc., Bailey International LLC, Bucher Hydraulics GmbH, Danfoss AS, Freudenberg and Co. KG, HANNON HYDRUALICS LLC, HAWE Hydraulik SE, HYDAC International GmbH, Hydrapac Italia Inc., HYDRO LEDUC SA, Hydroll Oy, Parker Hannifin Corp., Robert Bosch GmbH, Roth Hydraulics GmbH, Servi Group and Stauffenberg GmbH and Co. KG. The report provides qualitative and quantitative analysis categorizing companies as dominant, leading, strong, tentative, and weak based on their market positioning. Company profiles include business segment analysis, SWOT assessment, key offerings, and recent strategic developments.

Market Research Insights

  • The competitive landscape for hydraulic accumulators is characterized by intense innovation, with the top five vendors accounting for over 45% of the market share through technological differentiation. Key players such as Robert Bosch GmbH and Parker Hannifin Corp.
  • are focusing on developing smart hydraulic systems that integrate advanced sensors for predictive maintenance, a feature that can reduce unscheduled downtime by up to 20%. These developments directly address enterprise demand for greater operational efficiency and automation in sectors like construction and manufacturing.
  • The industry's strategic direction is toward creating more integrated solutions that combine hardware with digital control for optimized performance. However, vendors continue to navigate the challenge of high volatility in raw material prices, adapting by optimizing supply chains and exploring alternative materials to maintain cost competitiveness and production stability.

We can help! Our analysts can customize this hydraulic accumulators market research report to meet your requirements.

Get in touch

1. Executive Summary

1.1 Market overview

Executive Summary - Chart on Market Overview
Executive Summary - Data Table on Market Overview
Executive Summary - Chart on Global Market Characteristics
Executive Summary - Chart on Market by Geography
Executive Summary - Chart on Market Segmentation by Type
Executive Summary - Chart on Market Segmentation by End-user
Executive Summary - Chart on Market Segmentation by Product
Executive Summary - Chart on Incremental Growth
Executive Summary - Data Table on Incremental Growth
Executive Summary - Chart on Company Market Positioning

2. Technavio Analysis

2.1 Analysis of price sensitivity, lifecycle, customer purchase basket, adoption rates, and purchase criteria

2.2 Criticality of inputs and Factors of differentiation

Chart on Overview on criticality of inputs and factors of differentiation

2.3 Factors of disruption

Chart on Overview on factors of disruption

2.4 Impact of drivers and challenges

Chart on Impact of drivers and challenges in 2025 and 2030

3. Market Landscape

3.1 Market ecosystem

Chart on Parent Market
Data Table on - Parent Market

3.2 Market characteristics

Chart on Market characteristics analysis

3.3 Value chain analysis

Chart on Value chain analysis

4. Market Sizing

4.1 Market definition

Data Table on Offerings of companies included in the market definition

4.2 Market segment analysis

Market segments

4.3 Market size 2025

4.4 Market outlook: Forecast for 2025-2030

Chart on Global - Market size and forecast 2025-2030 ($ thousand)
Data Table on Global - Market size and forecast 2025-2030 ($ thousand)
Chart on Global Market: Year-over-year growth 2025-2030 (%)
Data Table on Global Market: Year-over-year growth 2025-2030 (%)

5. Historic Market Size

5.1 Global Hydraulic Accumulators Market 2020 - 2024

Historic Market Size - Data Table on Global Hydraulic Accumulators Market 2020 - 2024 ($ thousand)

5.2 Type segment analysis 2020 - 2024

Historic Market Size - Type Segment 2020 - 2024 ($ thousand)

5.3 End-user segment analysis 2020 - 2024

Historic Market Size - End-user Segment 2020 - 2024 ($ thousand)

5.4 Product segment analysis 2020 - 2024

Historic Market Size - Product Segment 2020 - 2024 ($ thousand)

5.5 Geography segment analysis 2020 - 2024

Historic Market Size - Geography Segment 2020 - 2024 ($ thousand)

5.6 Country segment analysis 2020 - 2024

Historic Market Size - Country Segment 2020 - 2024 ($ thousand)

6. Qualitative Analysis

6.1 AI Impact on Global Hydraulic Accumulators Market

7. Five Forces Analysis

7.1 Five forces summary

Five forces analysis - Comparison between 2025 and 2030

7.2 Bargaining power of buyers

Bargaining power of buyers - Impact of key factors 2025 and 2030

7.3 Bargaining power of suppliers

Bargaining power of suppliers - Impact of key factors in 2025 and 2030

7.4 Threat of new entrants

Threat of new entrants - Impact of key factors in 2025 and 2030

7.5 Threat of substitutes

Threat of substitutes - Impact of key factors in 2025 and 2030

7.6 Threat of rivalry

Threat of rivalry - Impact of key factors in 2025 and 2030

7.7 Market condition

Chart on Market condition - Five forces 2025 and 2030

8. Market Segmentation by Type

8.1 Market segments

Chart on Type - Market share 2025-2030 (%)
Data Table on Type - Market share 2025-2030 (%)

8.2 Comparison by Type

Chart on Comparison by Type
Data Table on Comparison by Type

8.3 Bladder - Market size and forecast 2025-2030

Chart on Bladder - Market size and forecast 2025-2030 ($ thousand)
Data Table on Bladder - Market size and forecast 2025-2030 ($ thousand)
Chart on Bladder - Year-over-year growth 2025-2030 (%)
Data Table on Bladder - Year-over-year growth 2025-2030 (%)

8.4 Piston - Market size and forecast 2025-2030

Chart on Piston - Market size and forecast 2025-2030 ($ thousand)
Data Table on Piston - Market size and forecast 2025-2030 ($ thousand)
Chart on Piston - Year-over-year growth 2025-2030 (%)
Data Table on Piston - Year-over-year growth 2025-2030 (%)

8.5 Diaphragm - Market size and forecast 2025-2030

Chart on Diaphragm - Market size and forecast 2025-2030 ($ thousand)
Data Table on Diaphragm - Market size and forecast 2025-2030 ($ thousand)
Chart on Diaphragm - Year-over-year growth 2025-2030 (%)
Data Table on Diaphragm - Year-over-year growth 2025-2030 (%)

8.6 Market opportunity by Type

Market opportunity by Type ($ thousand)
Data Table on Market opportunity by Type ($ thousand)

9. Market Segmentation by End-user

9.1 Market segments

Chart on End-user - Market share 2025-2030 (%)
Data Table on End-user - Market share 2025-2030 (%)

9.2 Comparison by End-user

Chart on Comparison by End-user
Data Table on Comparison by End-user

9.3 CM and MH - Market size and forecast 2025-2030

Chart on CM and MH - Market size and forecast 2025-2030 ($ thousand)
Data Table on CM and MH - Market size and forecast 2025-2030 ($ thousand)
Chart on CM and MH - Year-over-year growth 2025-2030 (%)
Data Table on CM and MH - Year-over-year growth 2025-2030 (%)

9.4 Agriculture and forestry - Market size and forecast 2025-2030

Chart on Agriculture and forestry - Market size and forecast 2025-2030 ($ thousand)
Data Table on Agriculture and forestry - Market size and forecast 2025-2030 ($ thousand)
Chart on Agriculture and forestry - Year-over-year growth 2025-2030 (%)
Data Table on Agriculture and forestry - Year-over-year growth 2025-2030 (%)

9.5 Oil and gas - Market size and forecast 2025-2030

Chart on Oil and gas - Market size and forecast 2025-2030 ($ thousand)
Data Table on Oil and gas - Market size and forecast 2025-2030 ($ thousand)
Chart on Oil and gas - Year-over-year growth 2025-2030 (%)
Data Table on Oil and gas - Year-over-year growth 2025-2030 (%)

9.6 Others - Market size and forecast 2025-2030

Chart on Others - Market size and forecast 2025-2030 ($ thousand)
Data Table on Others - Market size and forecast 2025-2030 ($ thousand)
Chart on Others - Year-over-year growth 2025-2030 (%)
Data Table on Others - Year-over-year growth 2025-2030 (%)

9.7 Market opportunity by End-user

Market opportunity by End-user ($ thousand)
Data Table on Market opportunity by End-user ($ thousand)

10. Market Segmentation by Product

10.1 Market segments

Chart on Product - Market share 2025-2030 (%)
Data Table on Product - Market share 2025-2030 (%)

10.2 Comparison by Product

Chart on Comparison by Product
Data Table on Comparison by Product

10.3 Horizontal mounted - Market size and forecast 2025-2030

Chart on Horizontal mounted - Market size and forecast 2025-2030 ($ thousand)
Data Table on Horizontal mounted - Market size and forecast 2025-2030 ($ thousand)
Chart on Horizontal mounted - Year-over-year growth 2025-2030 (%)
Data Table on Horizontal mounted - Year-over-year growth 2025-2030 (%)

10.4 Vertical mounted - Market size and forecast 2025-2030

Chart on Vertical mounted - Market size and forecast 2025-2030 ($ thousand)
Data Table on Vertical mounted - Market size and forecast 2025-2030 ($ thousand)
Chart on Vertical mounted - Year-over-year growth 2025-2030 (%)
Data Table on Vertical mounted - Year-over-year growth 2025-2030 (%)

10.5 Wall mounted - Market size and forecast 2025-2030

Chart on Wall mounted - Market size and forecast 2025-2030 ($ thousand)
Data Table on Wall mounted - Market size and forecast 2025-2030 ($ thousand)
Chart on Wall mounted - Year-over-year growth 2025-2030 (%)
Data Table on Wall mounted - Year-over-year growth 2025-2030 (%)

10.6 Market opportunity by Product

Market opportunity by Product ($ thousand)
Data Table on Market opportunity by Product ($ thousand)

11. Customer Landscape

11.1 Customer landscape overview

Analysis of price sensitivity, lifecycle, customer purchase basket, adoption rates, and purchase criteria

12. Geographic Landscape

12.1 Geographic segmentation

Chart on Market share by geography 2025-2030 (%)
Data Table on Market share by geography 2025-2030 (%)

12.2 Geographic comparison

Chart on Geographic comparison
Data Table on Geographic comparison

12.3 APAC - Market size and forecast 2025-2030

Chart on APAC - Market size and forecast 2025-2030 ($ thousand)
Data Table on APAC - Market size and forecast 2025-2030 ($ thousand)
Chart on APAC - Year-over-year growth 2025-2030 (%)
Data Table on APAC - Year-over-year growth 2025-2030 (%)
Chart on Regional Comparison - APAC
Data Table on Regional Comparison - APAC

12.3.1 China - Market size and forecast 2025-2030

Chart on China - Market size and forecast 2025-2030 ($ thousand)
Data Table on China - Market size and forecast 2025-2030 ($ thousand)
Chart on China - Year-over-year growth 2025-2030 (%)
Data Table on China - Year-over-year growth 2025-2030 (%)

12.3.2 Japan - Market size and forecast 2025-2030

Chart on Japan - Market size and forecast 2025-2030 ($ thousand)
Data Table on Japan - Market size and forecast 2025-2030 ($ thousand)
Chart on Japan - Year-over-year growth 2025-2030 (%)
Data Table on Japan - Year-over-year growth 2025-2030 (%)

12.3.3 India - Market size and forecast 2025-2030

Chart on India - Market size and forecast 2025-2030 ($ thousand)
Data Table on India - Market size and forecast 2025-2030 ($ thousand)
Chart on India - Year-over-year growth 2025-2030 (%)
Data Table on India - Year-over-year growth 2025-2030 (%)

12.3.4 South Korea - Market size and forecast 2025-2030

Chart on South Korea - Market size and forecast 2025-2030 ($ thousand)
Data Table on South Korea - Market size and forecast 2025-2030 ($ thousand)
Chart on South Korea - Year-over-year growth 2025-2030 (%)
Data Table on South Korea - Year-over-year growth 2025-2030 (%)

12.3.5 Australia - Market size and forecast 2025-2030

Chart on Australia - Market size and forecast 2025-2030 ($ thousand)
Data Table on Australia - Market size and forecast 2025-2030 ($ thousand)
Chart on Australia - Year-over-year growth 2025-2030 (%)
Data Table on Australia - Year-over-year growth 2025-2030 (%)

12.3.6 Indonesia - Market size and forecast 2025-2030

Chart on Indonesia - Market size and forecast 2025-2030 ($ thousand)
Data Table on Indonesia - Market size and forecast 2025-2030 ($ thousand)
Chart on Indonesia - Year-over-year growth 2025-2030 (%)
Data Table on Indonesia - Year-over-year growth 2025-2030 (%)

12.4 North America - Market size and forecast 2025-2030

Chart on North America - Market size and forecast 2025-2030 ($ thousand)
Data Table on North America - Market size and forecast 2025-2030 ($ thousand)
Chart on North America - Year-over-year growth 2025-2030 (%)
Data Table on North America - Year-over-year growth 2025-2030 (%)
Chart on Regional Comparison - North America
Data Table on Regional Comparison - North America

12.4.1 US - Market size and forecast 2025-2030

Chart on US - Market size and forecast 2025-2030 ($ thousand)
Data Table on US - Market size and forecast 2025-2030 ($ thousand)
Chart on US - Year-over-year growth 2025-2030 (%)
Data Table on US - Year-over-year growth 2025-2030 (%)

12.4.2 Canada - Market size and forecast 2025-2030

Chart on Canada - Market size and forecast 2025-2030 ($ thousand)
Data Table on Canada - Market size and forecast 2025-2030 ($ thousand)
Chart on Canada - Year-over-year growth 2025-2030 (%)
Data Table on Canada - Year-over-year growth 2025-2030 (%)

12.4.3 Mexico - Market size and forecast 2025-2030

Chart on Mexico - Market size and forecast 2025-2030 ($ thousand)
Data Table on Mexico - Market size and forecast 2025-2030 ($ thousand)
Chart on Mexico - Year-over-year growth 2025-2030 (%)
Data Table on Mexico - Year-over-year growth 2025-2030 (%)

12.5 Europe - Market size and forecast 2025-2030

Chart on Europe - Market size and forecast 2025-2030 ($ thousand)
Data Table on Europe - Market size and forecast 2025-2030 ($ thousand)
Chart on Europe - Year-over-year growth 2025-2030 (%)
Data Table on Europe - Year-over-year growth 2025-2030 (%)
Chart on Regional Comparison - Europe
Data Table on Regional Comparison - Europe

12.5.1 Germany - Market size and forecast 2025-2030

Chart on Germany - Market size and forecast 2025-2030 ($ thousand)
Data Table on Germany - Market size and forecast 2025-2030 ($ thousand)
Chart on Germany - Year-over-year growth 2025-2030 (%)
Data Table on Germany - Year-over-year growth 2025-2030 (%)

12.5.2 UK - Market size and forecast 2025-2030

Chart on UK - Market size and forecast 2025-2030 ($ thousand)
Data Table on UK - Market size and forecast 2025-2030 ($ thousand)
Chart on UK - Year-over-year growth 2025-2030 (%)
Data Table on UK - Year-over-year growth 2025-2030 (%)

12.5.3 France - Market size and forecast 2025-2030

Chart on France - Market size and forecast 2025-2030 ($ thousand)
Data Table on France - Market size and forecast 2025-2030 ($ thousand)
Chart on France - Year-over-year growth 2025-2030 (%)
Data Table on France - Year-over-year growth 2025-2030 (%)

12.5.4 Italy - Market size and forecast 2025-2030

Chart on Italy - Market size and forecast 2025-2030 ($ thousand)
Data Table on Italy - Market size and forecast 2025-2030 ($ thousand)
Chart on Italy - Year-over-year growth 2025-2030 (%)
Data Table on Italy - Year-over-year growth 2025-2030 (%)

12.5.5 Spain - Market size and forecast 2025-2030

Chart on Spain - Market size and forecast 2025-2030 ($ thousand)
Data Table on Spain - Market size and forecast 2025-2030 ($ thousand)
Chart on Spain - Year-over-year growth 2025-2030 (%)
Data Table on Spain - Year-over-year growth 2025-2030 (%)

12.5.6 The Netherlands - Market size and forecast 2025-2030

Chart on The Netherlands - Market size and forecast 2025-2030 ($ thousand)
Data Table on The Netherlands - Market size and forecast 2025-2030 ($ thousand)
Chart on The Netherlands - Year-over-year growth 2025-2030 (%)
Data Table on The Netherlands - Year-over-year growth 2025-2030 (%)

12.6 Middle East and Africa - Market size and forecast 2025-2030

Chart on Middle East and Africa - Market size and forecast 2025-2030 ($ thousand)
Data Table on Middle East and Africa - Market size and forecast 2025-2030 ($ thousand)
Chart on Middle East and Africa - Year-over-year growth 2025-2030 (%)
Data Table on Middle East and Africa - Year-over-year growth 2025-2030 (%)
Chart on Regional Comparison - Middle East and Africa
Data Table on Regional Comparison - Middle East and Africa

12.6.1 Saudi Arabia - Market size and forecast 2025-2030

Chart on Saudi Arabia - Market size and forecast 2025-2030 ($ thousand)
Data Table on Saudi Arabia - Market size and forecast 2025-2030 ($ thousand)
Chart on Saudi Arabia - Year-over-year growth 2025-2030 (%)
Data Table on Saudi Arabia - Year-over-year growth 2025-2030 (%)

12.6.2 UAE - Market size and forecast 2025-2030

Chart on UAE - Market size and forecast 2025-2030 ($ thousand)
Data Table on UAE - Market size and forecast 2025-2030 ($ thousand)
Chart on UAE - Year-over-year growth 2025-2030 (%)
Data Table on UAE - Year-over-year growth 2025-2030 (%)

12.6.3 South Africa - Market size and forecast 2025-2030

Chart on South Africa - Market size and forecast 2025-2030 ($ thousand)
Data Table on South Africa - Market size and forecast 2025-2030 ($ thousand)
Chart on South Africa - Year-over-year growth 2025-2030 (%)
Data Table on South Africa - Year-over-year growth 2025-2030 (%)

12.6.4 Israel - Market size and forecast 2025-2030

Chart on Israel - Market size and forecast 2025-2030 ($ thousand)
Data Table on Israel - Market size and forecast 2025-2030 ($ thousand)
Chart on Israel - Year-over-year growth 2025-2030 (%)
Data Table on Israel - Year-over-year growth 2025-2030 (%)

12.6.5 Turkey - Market size and forecast 2025-2030

Chart on Turkey - Market size and forecast 2025-2030 ($ thousand)
Data Table on Turkey - Market size and forecast 2025-2030 ($ thousand)
Chart on Turkey - Year-over-year growth 2025-2030 (%)
Data Table on Turkey - Year-over-year growth 2025-2030 (%)

12.7 South America - Market size and forecast 2025-2030

Chart on South America - Market size and forecast 2025-2030 ($ thousand)
Data Table on South America - Market size and forecast 2025-2030 ($ thousand)
Chart on South America - Year-over-year growth 2025-2030 (%)
Data Table on South America - Year-over-year growth 2025-2030 (%)
Chart on Regional Comparison - South America
Data Table on Regional Comparison - South America

12.7.1 Brazil - Market size and forecast 2025-2030

Chart on Brazil - Market size and forecast 2025-2030 ($ thousand)
Data Table on Brazil - Market size and forecast 2025-2030 ($ thousand)
Chart on Brazil - Year-over-year growth 2025-2030 (%)
Data Table on Brazil - Year-over-year growth 2025-2030 (%)

12.7.2 Argentina - Market size and forecast 2025-2030

Chart on Argentina - Market size and forecast 2025-2030 ($ thousand)
Data Table on Argentina - Market size and forecast 2025-2030 ($ thousand)
Chart on Argentina - Year-over-year growth 2025-2030 (%)
Data Table on Argentina - Year-over-year growth 2025-2030 (%)

12.7.3 Colombia - Market size and forecast 2025-2030

Chart on Colombia - Market size and forecast 2025-2030 ($ thousand)
Data Table on Colombia - Market size and forecast 2025-2030 ($ thousand)
Chart on Colombia - Year-over-year growth 2025-2030 (%)
Data Table on Colombia - Year-over-year growth 2025-2030 (%)

12.8 Market opportunity by geography

Market opportunity by geography ($ thousand)
Data Tables on Market opportunity by geography ($ thousand)

13. Drivers, Challenges, and Opportunity

13.1 Market drivers

Rise in demand for machine tools
Growth in agriculture sector
Modernization and replacement of aging hydraulic systems in industrial facilities

13.2 Market challenges

High volatility in raw material prices
Risk of leakage and seal failure affecting system reliability
High maintenance and service requirements

13.3 Impact of drivers and challenges

Impact of drivers and challenges in 2025 and 2030

13.4 Market opportunities

Rapid technological advancements of energy-efficient hydraulic accumulators
Increased commercial construction activities
Rising investments in chemical manufacturing facilities in emerging economies

14. Competitive Landscape

14.1 Overview

14.2

Overview on criticality of inputs and factors of differentiation

14.3 Landscape disruption

Overview on factors of disruption

14.4 Industry risks

Impact of key risks on business

15. Competitive Analysis

15.1 Companies profiled

Companies covered

15.2 Company ranking index

15.3 Market positioning of companies

Matrix on companies position and classification

15.4 Accumulators Inc.

Accumulators Inc. - Overview
Accumulators Inc. - Product / Service
Accumulators Inc. - Key offerings
SWOT

15.5 Bailey International LLC

Bailey International LLC - Overview
Bailey International LLC - Product / Service
Bailey International LLC - Key offerings
SWOT

15.6 Bucher Hydraulics GmbH

Bucher Hydraulics GmbH - Overview
Bucher Hydraulics GmbH - Product / Service
Bucher Hydraulics GmbH - Key offerings
SWOT

15.7 Danfoss AS

Danfoss AS - Overview
Danfoss AS - Product / Service
Danfoss AS - Key offerings
SWOT

15.8 Freudenberg and Co. KG

Freudenberg and Co. KG - Overview
Freudenberg and Co. KG - Product / Service
Freudenberg and Co. KG - Key news
Freudenberg and Co. KG - Key offerings
SWOT

15.9 HANNON HYDRUALICS LLC

HANNON HYDRUALICS LLC - Overview
HANNON HYDRUALICS LLC - Product / Service
HANNON HYDRUALICS LLC - Key offerings
SWOT

15.10 HAWE Hydraulik SE

HAWE Hydraulik SE - Overview
HAWE Hydraulik SE - Product / Service
HAWE Hydraulik SE - Key offerings
SWOT

15.11 HYDAC International GmbH

HYDAC International GmbH - Overview
HYDAC International GmbH - Product / Service
HYDAC International GmbH - Key offerings
SWOT

15.12 Hydrapac Italia Inc.

Hydrapac Italia Inc. - Overview
Hydrapac Italia Inc. - Product / Service
Hydrapac Italia Inc. - Key offerings
SWOT

15.13 HYDRO LEDUC SA

HYDRO LEDUC SA - Overview
HYDRO LEDUC SA - Product / Service
HYDRO LEDUC SA - Key offerings
SWOT

15.14 Hydroll Oy

Hydroll Oy - Overview
Hydroll Oy - Product / Service
Hydroll Oy - Key offerings
SWOT

15.15 Parker Hannifin Corp.

Parker Hannifin Corp. - Overview
Parker Hannifin Corp. - Business segments
Parker Hannifin Corp. - Key offerings
Parker Hannifin Corp. - Segment focus
SWOT

15.16 Robert Bosch GmbH

Robert Bosch GmbH - Overview
Robert Bosch GmbH - Product / Service
Robert Bosch GmbH - Key news
Robert Bosch GmbH - Key offerings
SWOT

15.17 Roth Hydraulics GmbH

Roth Hydraulics GmbH - Overview
Roth Hydraulics GmbH - Product / Service
Roth Hydraulics GmbH - Key offerings
SWOT

15.18 Servi Group

Servi Group - Overview
Servi Group - Product / Service
Servi Group - Key offerings
SWOT

16. Appendix

16.1 Scope of the report

Market definition
Objectives
Notes and caveats

16.2 Inclusions and exclusions checklist

Inclusions checklist
Exclusions checklist

16.3 Currency conversion rates for US$

16.4 Research methodology

16.5 Data procurement

Information sources

16.6 Data validation

16.7 Validation techniques employed for market sizing

16.8 Data synthesis

16.9 360 degree market analysis

16.10 List of abbreviations

Research Methodology

Technavio presents a detailed picture of the market by way of study, synthesis, and summation of data from multiple sources. The analysts have presented the various facets of the market with a particular focus on identifying the key industry influencers. The data thus presented is comprehensive, reliable, and the result of extensive research, both primary and secondary.

INFORMATION SOURCES

Primary sources

  • Manufacturers and suppliers
  • Channel partners
  • Industry experts
  • Strategic decision makers

Secondary sources

  • Industry journals and periodicals
  • Government data
  • Financial reports of key industry players
  • Historical data
  • Press releases

DATA ANALYSIS

Data Synthesis

  • Collation of data
  • Estimation of key figures
  • Analysis of derived insights

Data Validation

  • Triangulation with data models
  • Reference against proprietary databases
  • Corroboration with industry experts

REPORT WRITING

Qualitative

  • Market drivers
  • Market challenges
  • Market trends
  • Five forces analysis

Quantitative

  • Market size and forecast
  • Market segmentation
  • Geographical insights
  • Competitive landscape

Interested in this report?

Get your sample now to see our research methodology and insights!

Download Now

Frequently Asked Questions

Hydraulic Accumulators market growth will increase by USD 65700.0 thousand thousand during 2026-2030.

The Hydraulic Accumulators market is expected to grow at a CAGR of 5.6% during 2026-2030.

Hydraulic Accumulators market is segmented by Type (Bladder, Piston, Diaphragm) End-user (CM and MH, Agriculture and forestry, Oil and gas, Others) Product (Horizontal mounted, Vertical mounted, Wall mounted)

Accumulators Inc., Bailey International LLC, Bucher Hydraulics GmbH, Danfoss AS, Freudenberg and Co. KG, HANNON HYDRUALICS LLC, HAWE Hydraulik SE, HYDAC International GmbH, Hydrapac Italia Inc., HYDRO LEDUC SA, Hydroll Oy, Parker Hannifin Corp., Robert Bosch GmbH, Roth Hydraulics GmbH, Servi Group, Stauffenberg GmbH and Co. KG are a few of the key vendors in the Hydraulic Accumulators market.

APAC will register the highest growth rate of 53.7% among the other regions. Therefore, the Hydraulic Accumulators market in APAC is expected to garner significant business opportunities for the vendors during the forecast period.

China, Japan, India, South Korea, Australia, Indonesia, US, Canada, Mexico, Germany, UK, France, Italy, Spain, The Netherlands, Saudi Arabia, UAE, South Africa, Israel, Turkey, Brazil, Argentina, Colombia

  • Rise in demand for machine tools is the driving factor this market.

The Hydraulic Accumulators market vendors should focus on grabbing business opportunities from the Type segment as it accounted for the largest market share in the base year.
RIA - Research AI Assistant
Ask RIA