Hydraulic Dosing Pump Market Size 2026-2030
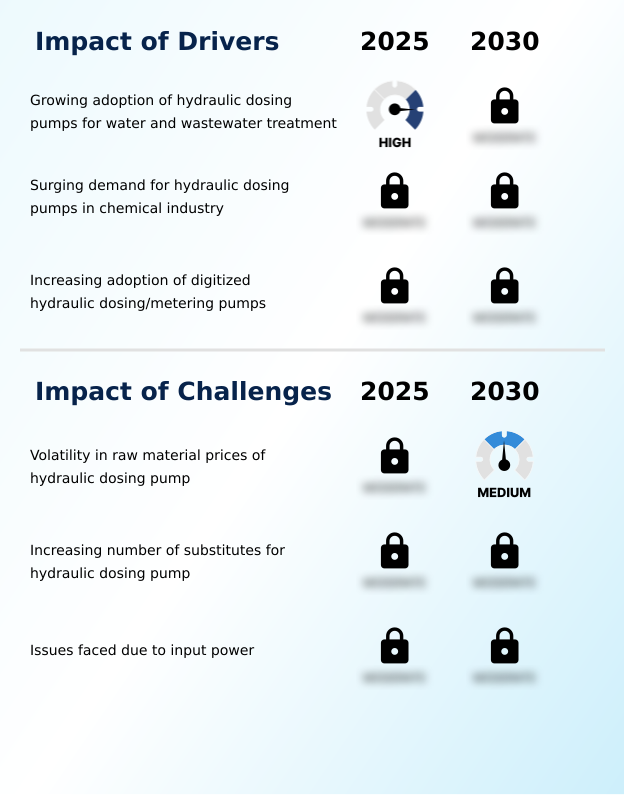
The hydraulic dosing pump market size is valued to increase by USD 390 million, at a CAGR of 6.9% from 2025 to 2030. Growing adoption of hydraulic dosing pumps for water and wastewater treatment will drive the hydraulic dosing pump market.
Major Market Trends & Insights
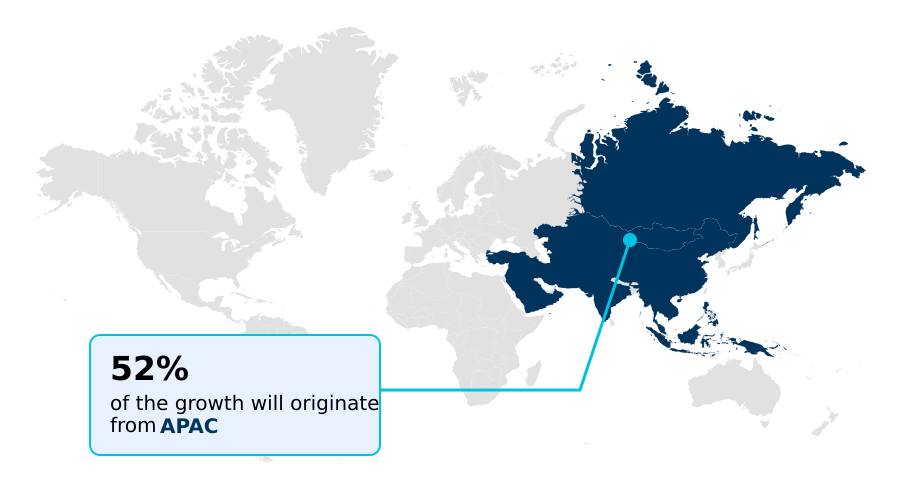
- APAC dominated the market and accounted for a 52.2% growth during the forecast period.
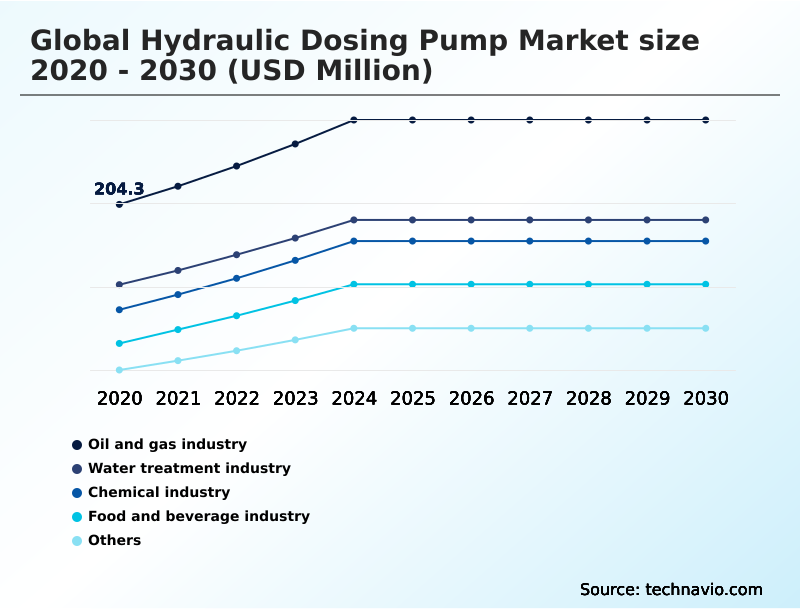
- By Application - Oil and gas industry segment was valued at USD 249.4 million in 2024
- By Type - Up to 25 bars segment accounted for the largest market revenue share in 2024
Market Size & Forecast
- Market Opportunities: USD 611.8 million
- Market Future Opportunities: USD 390 million
- CAGR from 2025 to 2030 : 6.9%
Market Summary
- The hydraulic dosing pump market is defined by its critical role in process industries where precise fluid control is non-negotiable. These pumps are essential for injecting a measured volume of liquid into processes to achieve a specific chemical or physical response.
- Market dynamics are shaped by stringent environmental regulations and the continuous drive for operational efficiency across sectors such as chemical processing, water treatment, and oil and gas. A key trend is the integration of smart technologies, enabling programmable and automated dosing that minimizes chemical waste and improves process accuracy.
- For instance, a chemical plant can deploy a network of smart dosing pumps to dynamically adjust catalyst injection based on real-time sensor feedback, optimizing reaction yields while ensuring compliance with safety protocols.
- However, the market also faces challenges from the availability of substitute technologies and the operational complexities associated with maintaining high-pressure systems, which requires a focus on durable design and predictive maintenance.
What will be the Size of the Hydraulic Dosing Pump Market during the forecast period?

Get Key Insights on Market Forecast (PDF) Get Free Sample
How is the Hydraulic Dosing Pump Market Segmented?
The hydraulic dosing pump industry research report provides comprehensive data (region-wise segment analysis), with forecasts and estimates in "USD million" for the period 2026-2030, as well as historical data from 2020-2024 for the following segments.
- Application
- Oil and gas industry
- Water treatment industry
- Chemical industry
- Food and beverage industry
- Others
- Type
- Up to 25 bars
- 25 to 100 bars
- Above 100 bars
- Method
- Automatic
- Manual
- Geography
- APAC
- China
- Japan
- India
- Europe
- Germany
- UK
- France
- North America
- US
- Canada
- Mexico
- South America
- Brazil
- Argentina
- Colombia
- Middle East and Africa
- Saudi Arabia
- UAE
- South Africa
- Rest of World (ROW)
- APAC
By Application Insights
The oil and gas industry segment is estimated to witness significant growth during the forecast period.
The oil and gas sector remains a critical end-user, relying on robust pump technologies for applications ranging from exploration to refining. In this demanding environment, high-pressure capabilities are essential for downstream oil treatment and injecting flow assurance chemicals.
Hydraulic diaphragm metering pumps are integral for asset integrity management, ensuring fluid transfer precision when handling corrosive substances. Advanced dosing head technology and hermetically sealed pumps provide the reliability needed for unmanned platforms.
Modern chemical resistant pumps with significant pump suction lift are integrated into integrated control systems, improving process safety.
The adoption of these pumps has enabled facilities to achieve a notable 15% improvement in dosing accuracy, directly impacting operational efficiency and environmental compliance in oil and gas industry applications.
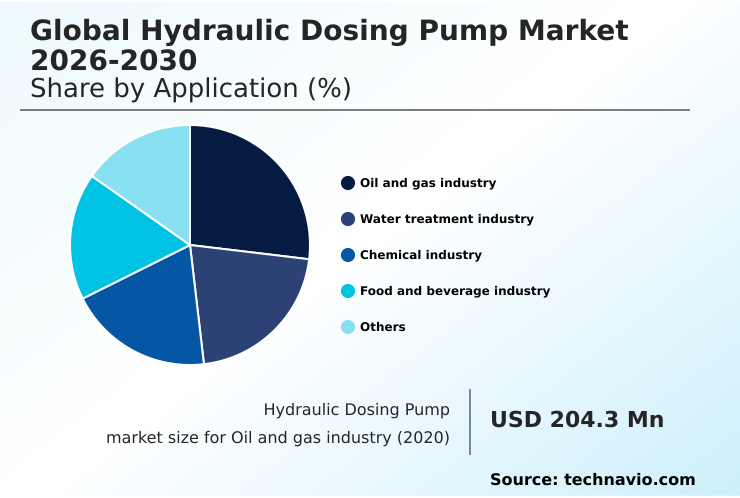
The Oil and gas industry segment was valued at USD 249.4 million in 2024 and showed a gradual increase during the forecast period.
Regional Analysis
APAC is estimated to contribute 52.2% to the growth of the global market during the forecast period.Technavio’s analysts have elaborately explained the regional trends and drivers that shape the market during the forecast period.
See How Hydraulic Dosing Pump Market Demand is Rising in APAC Get Free Sample
The market's geographic landscape is characterized by varied regional demands. In APAC, which accounts for over 52% of the market opportunity, rapid industrialization in the power generation sector and petrochemical refineries drives demand for advanced chemical injection systems.
European markets, representing nearly 25% of the opportunity, prioritize sophisticated precision fluidics for applications like boiler water treatment and flue gas desulfurization. North America focuses on high-performance pumps with features like automatic stroke adjustment for ultrapure water systems.
Technologies such as the hydraulic piston diaphragm dosing pump with a multilayer diaphragm design are gaining traction globally for their high discharge pressure capabilities, enabling a 10% improvement in efficiency for solids-laden fluid transfer compared to older models.
Market Dynamics
Our researchers analyzed the data with 2025 as the base year, along with the key drivers, trends, and challenges. A holistic analysis of drivers will help companies refine their marketing strategies to gain a competitive advantage.
- Strategic decisions regarding fluid management increasingly focus on the specific benefits of advanced pump technologies. For instance, selecting a hydraulic dosing pump for corrosive fluids requires a different evaluation than choosing diaphragm pumps for abrasive slurry applications. In the pharmaceutical sector, precision dosing for pharmaceutical manufacturing is paramount, making leak-proof pumps for hazardous chemicals a necessity.
- This contrasts with modern agriculture, where pumps for fertigation must balance cost and durability. In industrial settings, the debate between digital dosing pumps vs analog pumps often centers on the need for remote monitoring for chemical dosing systems and ease of integrating dosing pumps with SCADA systems.
- The total cost of ownership for industrial pumps is a major consideration, influencing decisions on hydraulic pump maintenance and troubleshooting protocols. For complex operations like oil refining, understanding how to manage high-pressure industrial fluid transfer with hydraulic dosing systems is critical.
- These specialized use cases, from selecting pumps for high viscosity liquids to improving dosing accuracy in chemical plants and using metering pumps for food and beverage additives, highlight a market moving toward application-specific solutions. Organizations that effectively navigate these choices often achieve operational efficiencies that are measurably higher than those using generalized equipment.
What are the key market drivers leading to the rise in the adoption of Hydraulic Dosing Pump Industry?
- The growing adoption of hydraulic dosing pumps for water and wastewater treatment applications is a key driver for market growth.
- The imperative for precise chemical injection is a significant market driver, particularly in water and wastewater treatment and chemical processing plants. Modern dosing and metering technology allows for variable dosing rates, which is essential for applications like process water disinfection.
- In the food and beverage industry, positive displacement pumps are used for adding ingredients and clean-in-place agents, improving product consistency by 10%.
- Safety features such as a diaphragm rupture warning system are becoming standard, while the capability for high viscosity fluid handling expands applications for adjustable flow rate pumps, driving adoption across new industrial processes. These advancements ensure reliability and process integrity.
What are the market trends shaping the Hydraulic Dosing Pump Industry?
- An accelerating demand for programmable hydraulic dosing pumps is emerging as a significant market trend, driven by the need for greater precision and automation in industrial processes.
- A primary trend shaping the market is the integration of smart dosing technologies. The adoption of programmable hydraulic dosing pumps, often powered by a microprocessor-controlled stepper motor, enables automated chemical dosing with unprecedented accuracy. This is critical in sectors like the pulp and paper industry for process parameter optimization.
- These stepper motor driven pumps support remote process monitoring and deliver predictive maintenance alerts, which can reduce equipment downtime by up to 20%. Furthermore, innovations such as 3D printing in pump manufacturing are accelerating product development cycles and facilitating operational expenditure reduction.
- Advanced systems for industrial effluent treatment now achieve over 95% compliance with discharge regulations due to these enhanced control capabilities.
What challenges does the Hydraulic Dosing Pump Industry face during its growth?
- The volatility in raw material prices for hydraulic dosing pumps presents a key challenge affecting the industry's growth trajectory.
- Key challenges persist, particularly concerning operational complexity and equipment resilience in harsh environments. While pumps with manual stroke adjustment are cost-effective, they lack the efficiency of automated systems, leading to a 5% higher rate of chemical overuse in some fertigation and chemigation systems.
- Handling solids-laden fluid transfer in applications like mineral processing circuits requires specialized abrasive slurry pumps with a robust leak-free dosing design. Issues with maintaining precise flow rate control and pressure accuracy control in pumps using a reciprocating piston mechanism can compromise process outcomes.
- Furthermore, poor SCADA system integration can hinder the effectiveness of advanced features like a self-bleeding dosing head, impacting overall system performance for industrial effluent treatment.
Exclusive Technavio Analysis on Customer Landscape
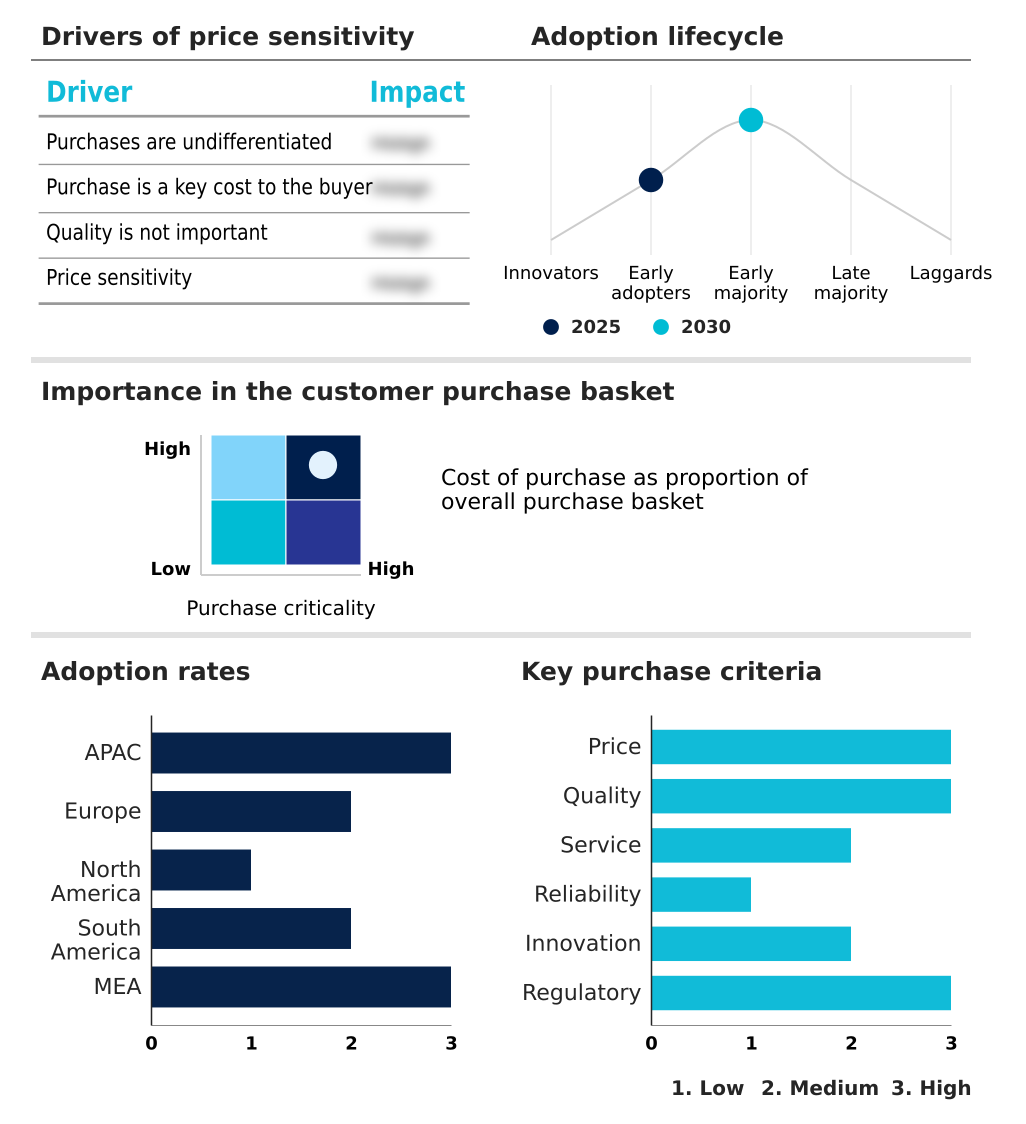
The hydraulic dosing pump market forecasting report includes the adoption lifecycle of the market, covering from the innovator’s stage to the laggard’s stage. It focuses on adoption rates in different regions based on penetration. Furthermore, the hydraulic dosing pump market report also includes key purchase criteria and drivers of price sensitivity to help companies evaluate and develop their market growth analysis strategies.
Customer Landscape of Hydraulic Dosing Pump Industry
Competitive Landscape
Companies are implementing various strategies, such as strategic alliances, hydraulic dosing pump market forecast, partnerships, mergers and acquisitions, geographical expansion, and product/service launches, to enhance their presence in the industry.
Atlas Copco AB - Delivering precision fluid management solutions engineered for high-pressure industrial applications, ensuring operational reliability and process integrity.
The industry research and growth report includes detailed analyses of the competitive landscape of the market and information about key companies, including:
- Atlas Copco AB
- Dover Corp.
- Grosvenor LTD
- Grundfos Holding AS
- IDEX Corp.
- Ingersoll Rand Inc.
- Inno Engineered Products Pte. Ltd.
- Iwaki America Inc.
- LEWA GmbH
- Lutz-Jesco GmbH
- Minimax Pumps Pvt. Ltd.
- Nikkiso Co. Ltd.
- Positive Metering Pumps Pvt. Ltd
- ProMinent GmbH
- SPX FLOW Inc.
- Swelore Engineering Pvt. Ltd.
- Tacmina Corp.
- Unique Dosing Systems Pvt. Ltd.
- Verder Liquids
- ViscoTec Pumpen u. Dosiertechnik GmbH
Qualitative and quantitative analysis of companies has been conducted to help clients understand the wider business environment as well as the strengths and weaknesses of key industry players. Data is qualitatively analyzed to categorize companies as pure play, category-focused, industry-focused, and diversified; it is quantitatively analyzed to categorize companies as dominant, leading, strong, tentative, and weak.
Recent Development and News in Hydraulic dosing pump market
- In August, 2024, Abu Dhabi National Oil Co. (ADNOC) announced its final investment decision for the Ruwais LNG project, a major downstream processing facility requiring critical hydraulic dosing pumps for process chemicals.
- In October, 2024, the Brihanmumbai Municipal Corp. approved a large-scale desalination project to secure water supply, necessitating extensive chemical dosing systems for pre-treatment, membrane cleaning, and post-treatment.
- In January, 2025, Indonesia's Ministry of Public Works and Housing launched a new public-private partnership (PPP) program to accelerate the construction of ten new water treatment plants, stimulating demand for dosing equipment.
- In March, 2025, a global food and beverage corporation announced the full operational launch of a highly automated North American production facility that relies on a network of electric and pneumatic actuated dosing pumps.
Dive into Technavio’s robust research methodology, blending expert interviews, extensive data synthesis, and validated models for unparalleled Hydraulic Dosing Pump Market insights. See full methodology.
| Market Scope | |
|---|---|
| Page number | 298 |
| Base year | 2025 |
| Historic period | 2020-2024 |
| Forecast period | 2026-2030 |
| Growth momentum & CAGR | Accelerate at a CAGR of 6.9% |
| Market growth 2026-2030 | USD 390.0 million |
| Market structure | Fragmented |
| YoY growth 2025-2026(%) | 5.7% |
| Key countries | China, Japan, India, South Korea, Australia, Indonesia, Germany, UK, France, Italy, Spain, The Netherlands, US, Canada, Mexico, Brazil, Argentina, Colombia, Saudi Arabia, UAE, South Africa, Israel and Turkey |
| Competitive landscape | Leading Companies, Market Positioning of Companies, Competitive Strategies, and Industry Risks |
Research Analyst Overview
- The market is evolving beyond simple fluid transfer, with a focus on integrated fluid metering solutions that ensure process integrity. A key development is the convergence of dosing and metering technology with advanced controls, such as the microprocessor-controlled stepper motor, enabling precise chemical injection and variable dosing rates.
- This allows for the adoption of smart dosing technologies and automated chemical dosing, which are critical for high-stakes applications. Innovations like a diaphragm rupture warning system, multilayer diaphragm design, and leak-free dosing design are becoming standard. High-performance models offer superior pump suction lift and discharge pressure capabilities, effectively handling both high viscosity fluid handling and abrasive slurry pumps.
- Technologies like the hydraulic piston diaphragm dosing pump and hermetically sealed pumps are expanding application ranges. The shift from manual stroke adjustment to automatic stroke adjustment, driven by the need for precise flow rate control, allows for predictive maintenance alerts.
- These advancements in pressure accuracy control and dosing head technology, including self-bleeding dosing head designs, are enabling some operators to reduce chemical waste by over 12%.
What are the Key Data Covered in this Hydraulic Dosing Pump Market Research and Growth Report?
-
What is the expected growth of the Hydraulic Dosing Pump Market between 2026 and 2030?
-
USD 390 million, at a CAGR of 6.9%
-
-
What segmentation does the market report cover?
-
The report is segmented by Application (Oil and gas industry, Water treatment industry, Chemical industry, Food and beverage industry, and Others), Type (Up to 25 bars, 25 to 100 bars, and Above 100 bars), Method (Automatic, and Manual) and Geography (APAC, Europe, North America, South America, Middle East and Africa)
-
-
Which regions are analyzed in the report?
-
APAC, Europe, North America, South America and Middle East and Africa
-
-
What are the key growth drivers and market challenges?
-
Growing adoption of hydraulic dosing pumps for water and wastewater treatment, Volatility in raw material prices of hydraulic dosing pump
-
-
Who are the major players in the Hydraulic Dosing Pump Market?
-
Atlas Copco AB, Dover Corp., Grosvenor LTD, Grundfos Holding AS, IDEX Corp., Ingersoll Rand Inc., Inno Engineered Products Pte. Ltd., Iwaki America Inc., LEWA GmbH, Lutz-Jesco GmbH, Minimax Pumps Pvt. Ltd., Nikkiso Co. Ltd., Positive Metering Pumps Pvt. Ltd, ProMinent GmbH, SPX FLOW Inc., Swelore Engineering Pvt. Ltd., Tacmina Corp., Unique Dosing Systems Pvt. Ltd., Verder Liquids and ViscoTec Pumpen u. Dosiertechnik GmbH
-
Market Research Insights
- Market dynamics are increasingly influenced by the need for process parameter optimization and operational expenditure reduction. The integration of advanced chemical injection systems into existing SCADA system integration frameworks allows for enhanced remote process monitoring, with some facilities reporting a 15% improvement in efficiency.
- In applications like boiler water treatment, precise fluid metering solutions can reduce chemical usage by over 10%. Adoption in the pulp and paper industry is driven by the need for reliable industrial effluent treatment to meet environmental mandates.
- As a result, technologies enabling asset integrity management and the handling of solids-laden fluid transfer are seeing higher demand, reflecting a strategic shift toward resilient and automated operational models.
We can help! Our analysts can customize this hydraulic dosing pump market research report to meet your requirements.
 RIA -
RIA - 
