Industrial Gases Market for Glass Industry Analysis APAC, Europe, North America, South America, Middle East and Africa - US, China, Japan, India, Germany - Size and Forecast 2023-2027

Industrial Gases Market for Glass Industry Analysis APAC, Europe, North America, South America, Middle East and Africa - US, China, Japan, India, Germany - Size and Forecast 2023-2027

Published: Sep 2023 173 Pages SKU: IRTNTR70981

Market Overview at a Glance

$808.18 Mn
Market Opportunity
4.62%
CAGR
4.38
YoY growth 2022-2023(%)

Industrial Gases Market for Glass Industry Size 2023-2027

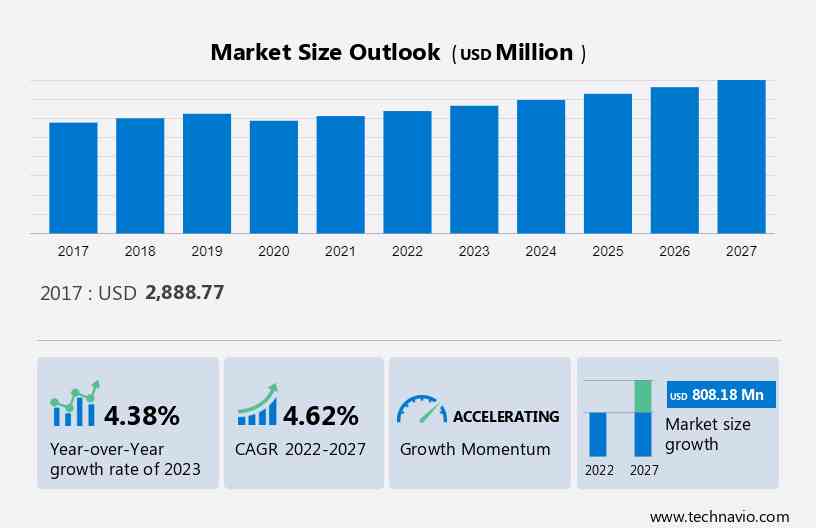
The industrial gases market for glass industry size is forecast to increase by USD 808.18 million. The market is estimated to grow at a CAGR of 4.62% between 2022 and 2027. The industrial gases market refers to the production, distribution, and use of gases such as oxygen, nitrogen, helium, and carbon dioxide in various industries. The demand for industrial gases is influenced by factors like economic growth, technological advancements, and environmental regulations. The market size The growth of the market depends on several factors such as the augmented demand for glass from the construction industry, the expanding glass packaging industry, and the flourishing global automotive industry.

What will be the Size of the Industrial Gases Market For the Glass Industry During the Forecast Period?

Industrial Gases Market for Glass Industry Size

To learn more about this report, View Report Sample

Key Drivers, Trends and Challenges

Our researchers analyzed the data with 2022 as the base year, along with the key drivers, trends, and challenges. A holistic analysis of drivers will help companies refine their marketing strategies to gain a competitive advantage. This market analysis and report also includes an in-depth analysis of drivers, trends, and challenges. Furthermore, the report includes historic market data from 2017 to 2021.

Key Driver

One of the key factors driving the market growth is the expanding glass packaging industry. There is an increasing preference for glass packaging as a packaging solution for food and soft drinks, pharmaceuticals, and beer, as glasses are made from sustainable raw materials and can be reused more than 40 times. Some of the main advantages of glass packaging include a reduction in the quantity of waste to be disposed of as well as premium quality.

Moreover, each ton of recycled glass saves approximately 300 kWh of energy which fuels the adoption of this packaging solution. In addition factors such as the increasing consumer awareness regarding the sustainable lifestyle are fuelling the adoption of glass packaging. Hence, such factors are positively impacting the market. Therefore, it is expected to drive the market growth during the forecast period.

Market Trends and Analysis

A key factor shaping the market growth is the growth of wearable technology. There is a growing popularity for wearable technology across the globe. Wearables can be referred to as smart devices that are used for multiple purposes, including fitness, healthcare, gaming, and entertainment. There is a high potential for the growth of flexible glass in wearable technology.

Moreover, some of the main advantages of flexible glasses include high flexibility and durability for displays, sensors, and other electronic systems, which are vital components for the design of wearable technology. In addition, it enables a better user experience and compatibility with the lifestyle of users. Hence, such factors are positively impacting the market. Therefore, it is expected to drive the market growth during the forecast period.

Key Challenge

The availability of substitutes for glass is one of the key challenges hindering the market growth. There is an increasing adoption of glass across various industries such as automotive, electronics, healthcare, construction, and food and beverages due to its recyclable properties. However, there are other alternatives to glass such as plastic, wood, metal, and polycarbonate due to their low cost compared with glass. 

Moreover, there is an increasing adoption of polycarbonate across various industries such as automotive, aviation, and packaging due to its adaptability properties.  Another significant alternative to glass is wood, as it is affordable, renewable, and offers versatile properties. Hence, such factors are negatively impacting the market. Therefore, it is expected to hinder the market growth during the forecast period.

Customer Landscape

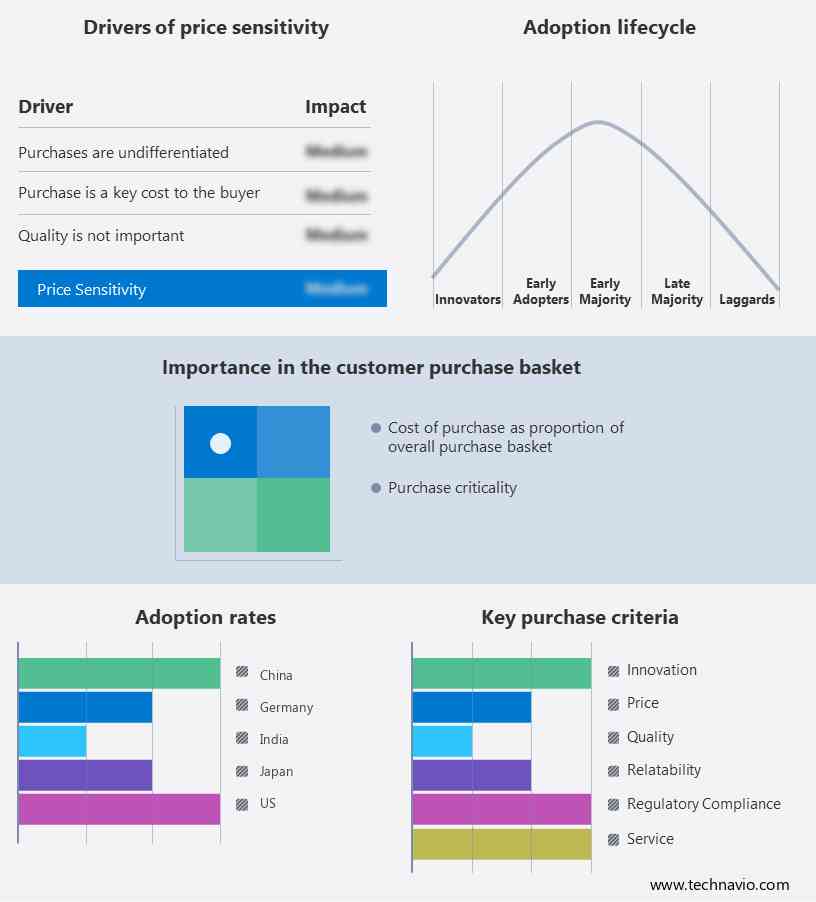
The market research report includes the adoption lifecycle of the market, covering from the innovator's stage to the laggard's stage. It focuses on adoption rates in different regions based on penetration. Furthermore, the report also includes key purchase criteria and drivers of price sensitivity to help companies evaluate and develop their growth strategies.

Industrial Gases Market for Glass Industry Share by Geography

Global Industrial Gases Market for Glass Industry Customer Landscape

Who are the key players in this industry?

Companies are implementing various strategies, such as strategic alliances, partnerships, mergers and acquisitions, geographical expansion, and product/service launches, to enhance their presence in the market.

Air Water Inc: The company offers industrial gases for glass industry such as argon, carbon dioxide, helium and oxygen for manufacturing various types of glasses.

This market research and growth report also includes detailed analyses of the competitive landscape of the market and information about 12 market companies, including:

  • Messer SE and Co. KGaA
  • Gulf Cryo Holding CSC
  • HoSt Holding B.V.
  • Iwatani Corp.
  • Mitsubishi Chemical Group Corp.
  • SOL Spa
  • SIG Gases Berhad
  • Air Liquide SA
  • Air Products and Chemicals Inc.
  • The Linde Group
  • Yingde Gas Group Co. Ltd.

Qualitative and quantitative analysis of companies has been conducted to help clients understand the wider business environment as well as the strengths and weaknesses of key market players. Data is qualitatively analyzed to categorize companies as pure play, category-focused, industry-focused, and diversified; it is quantitatively analyzed to categorize companies as dominant, leading, strong, tentative, and weak.

Market Segmentation

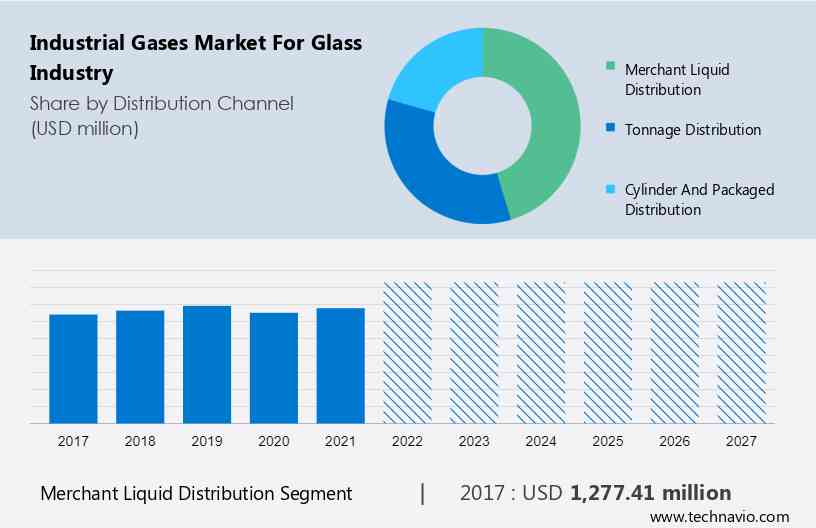
The merchant liquid distribution segment is estimated to witness significant growth during the forecast period. The merchant liquid distribution mode comprises the movement of industrial gas tankers to storage containers at the glass manufacturer site. Industrial gases, including oxygen, nitrogen, hydrogen, helium, and liquid nitrogen, are widely supplied through the merchant liquid distribution mode. The main advantage of the merchant liquid distribution mode is that it is cost-effective and there is an increasing preference for this segment over cylinder-based distribution as huge volumes of these gases required by the glass industry are easily supplied through it. 

Industrial Gases Market for Glass Industry Size

Get a glance at the market contribution of various segments View the PDF Sample

The merchant liquid distribution segment was the largest segment and was valued at USD 1,277.41 million in 2017. Merchant liquid distribution is usually offered on a lease basis to the glass manufacturers as there is a requirement to set up a storage facility at the customer's site, which needs huge capital investments. This segment is suitable when customers do not have a steady demand pattern for tonnage mode. In addition, it provides cost benefits to such customers. Hence, such factors are expected to fuel the growth of the merchant liquid distribution segment which in turn will drive the market growth during the forecast period.

Key Regions

Industrial Gases Market for Glass Industry Share by Geography

For more insights on the market share of various regions Download PDF Sample now!

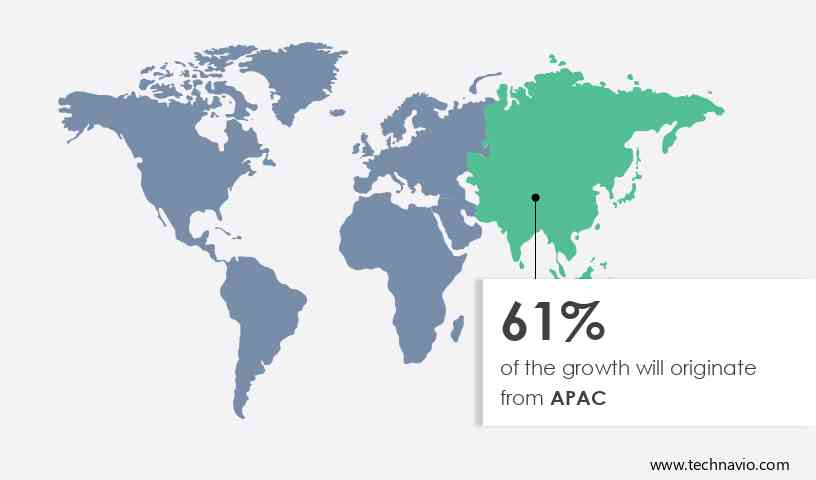
APAC is estimated to contribute 61% to the growth of the global market during the forecast period. Technavio's analysts have elaborately explained the regional trends and drivers that shape the market during the forecast period. Some of the main factors that are significantly contributing to the growth of the market in APAC are the rising industrialization and increasing demand for these gases from the end-user industries such as construction, automotive, and food and beverage, which require glasses in huge volume. There is a rapid expansion of infrastructure in APAC which requires these gases to produce large volumes of glass. Some of the key countries that are significantly contributing to the market growth in APAC include China, India, South Korea, Japan, Australia, and Indonesia. Furthermore, the strong presence of manufacturing industries in several regions of APAC will drive market growth in the region during the forecast period.

Market Analyst Overview

Industrial gases play a vital role in various sectors, including the glass industry. In the glass manufacturing process, they are used for welding and metallurgy processes, ensuring the quality and durability of glass products. For the past few years, the demand for glass, especially in the healthcare industry and healthcare sector, has surged. Additionally, the transportation and oil sectors rely on glass for various applications, further driving the need for them in the glass industry. With the growth rate of the glass industry, there's a continuous demand for the supply of industrial gases, highlighting the importance of this sector in supporting key industrial processes.

Segment Overview

This market growth and trends report forecasts market growth by revenue at global, regional & country levels and provides an analysis of the latest trends and growth opportunities from 2017 to 2027. 

  • Distribution Channel Outlook (USD Million, 2017 - 2027)
    • Merchant liquid distribution
    • Tonnage distribution
    • Cylinder and packaged distribution
  • Type Outlook (USD Million, 2017 - 2027)
    • Nitrogen
    • Oxygen
    • Hydrogen
    • Acetylene
    • Others
  • Geography Outlook (USD Million, 2017 - 2027)
    • North America
      • The U.S.
      • Canada
    • Europe
      • U.K.
      • Germany
      • France
      • Rest of Europe
    • APAC
      • China
      • India
    • South America
      • Chile
      • Argentina
      • Brazil
    • Middle East & Africa
      • Saudi Arabia
      • South Africa
      • Rest of the Middle East & Africa


Market Scope

Report Coverage

Details

Page number

173

Base year

2022

Historic period

2017-2021

Forecast period

2023-2027

Growth momentum & CAGR

Accelerate at a CAGR of 4.62%

Market growth 2023-2027

USD 808.18 million

Market structure

Concentrated

YoY growth 2022-2023(%)

4.38

Regional analysis

APAC, Europe, North America, South America, and Middle East and Africa

Performing market contribution

APAC at 61%

Key countries

US, China, Japan, India, and Germany

Competitive landscape

Leading Companies, Market Positioning of Companies, Competitive Strategies, and Industry Risks

Key companies profiled

Air Water Inc., Messer SE and Co. KGaA, Gulf Cryo Holding CSC, HoSt Holding B.V., Iwatani Corp., Mitsubishi Chemical Group Corp., SOL Spa, SIG Gases Berhad, Air Liquide SA, Air Products and Chemicals Inc., The Linde Group, and Yingde Gas Group Co. Ltd.

Market dynamics

Parent market analysis, Market growth inducers and obstacles, Fast-growing and slow-growing segment analysis, COVID-19 impact and recovery analysis and future consumer dynamics, and Market condition analysis for the forecast period.

Customization purview

If our market report has not included the data that you are looking for, you can reach out to our analysts and get segments customized.

View PDF Sample

What are the Key Data Covered in this Market Research Report?

  • CAGR of the market during the forecast period
  • Detailed information on factors that will drive the market growth and forecasting between 2023 and 2027
  • Precise estimation of the market size and its contribution to the market in focus on the parent market
  • Accurate predictions about upcoming trends and changes in consumer behavior
  • Market Growth Analysis across APAC, Europe, North America, South America, and the Middle East and Africa
  • A thorough analysis of the market's competitive landscape and detailed information about companies
  • Market forecasting of factors that will challenge the growth of market companies

We can help! Our analysts can customize this market research report to meet your requirements. 

Get in touch

1 Executive Summary

  • 1.1 Market overview
    • Exhibit 01: Executive Summary – Chart on Market Overview
    • Exhibit 02: Executive Summary – Data Table on Market Overview
    • Exhibit 03: Executive Summary – Chart on Global Market Characteristics
    • Exhibit 04: Executive Summary – Chart on Market by Geography
    • Exhibit 05: Executive Summary – Chart on Market Segmentation by Distribution Channel
    • Exhibit 06: Executive Summary – Chart on Market Segmentation by Type
    • Exhibit 07: Executive Summary – Chart on Incremental Growth
    • Exhibit 08: Executive Summary – Data Table on Incremental Growth
    • Exhibit 09: Executive Summary – Chart on Vendor Market Positioning

2 Market Landscape

  • 2.1 Market ecosystem
    • Exhibit 10: Parent market
    • Exhibit 11: Market Characteristics

3 Market Sizing

  • 3.1 Market definition
    • Exhibit 12: Offerings of vendors included in the market definition
  • 3.2 Market segment analysis
    • Exhibit 13: Market segments
  • 3.3 Market size 2022
    • 3.4 Market outlook: Forecast for 2022-2027
      • Exhibit 14: Chart on Global - Market size and forecast 2022-2027 ($ million)
      • Exhibit 15: Data Table on Global - Market size and forecast 2022-2027 ($ million)
      • Exhibit 16: Chart on Global Market: Year-over-year growth 2022-2027 (%)
      • Exhibit 17: Data Table on Global Market: Year-over-year growth 2022-2027 (%)

    4 Historic Market Size

    • 4.1 Global industrial gases market for glass industry 2017 - 2021
      • Exhibit 18: Historic Market Size – Data Table on global industrial gases market for glass industry 2017 - 2021 ($ million)
    • 4.2 Distribution Channel Segment Analysis 2017 - 2021
      • Exhibit 19: Historic Market Size – Distribution Channel Segment 2017 - 2021 ($ million)
    • 4.3 Type Segment Analysis 2017 - 2021
      • Exhibit 20: Historic Market Size – Type Segment 2017 - 2021 ($ million)
    • 4.4 Geography Segment Analysis 2017 - 2021
      • Exhibit 21: Historic Market Size – Geography Segment 2017 - 2021 ($ million)
    • 4.5 Country Segment Analysis 2017 - 2021
      • Exhibit 22: Historic Market Size – Country Segment 2017 - 2021 ($ million)

    5 Five Forces Analysis

    • 5.1 Five forces summary
      • Exhibit 23: Five forces analysis - Comparison between 2022 and 2027
    • 5.2 Bargaining power of buyers
      • Exhibit 24: Chart on Bargaining power of buyers – Impact of key factors 2022 and 2027
    • 5.3 Bargaining power of suppliers
      • Exhibit 25: Bargaining power of suppliers – Impact of key factors in 2022 and 2027
    • 5.4 Threat of new entrants
      • Exhibit 26: Threat of new entrants – Impact of key factors in 2022 and 2027
    • 5.5 Threat of substitutes
      • Exhibit 27: Threat of substitutes – Impact of key factors in 2022 and 2027
    • 5.6 Threat of rivalry
      • Exhibit 28: Threat of rivalry – Impact of key factors in 2022 and 2027
    • 5.7 Market condition
      • Exhibit 29: Chart on Market condition - Five forces 2022 and 2027

    6 Market Segmentation by Distribution Channel

    • 6.1 Market segments
      • Exhibit 30: Chart on Distribution Channel - Market share 2022-2027 (%)
      • Exhibit 31: Data Table on Distribution Channel - Market share 2022-2027 (%)
    • 6.2 Comparison by Distribution Channel
      • Exhibit 32: Chart on Comparison by Distribution Channel
      • Exhibit 33: Data Table on Comparison by Distribution Channel
    • 6.3 Merchant liquid distribution - Market size and forecast 2022-2027
      • Exhibit 34: Chart on Merchant liquid distribution - Market size and forecast 2022-2027 ($ million)
      • Exhibit 35: Data Table on Merchant liquid distribution - Market size and forecast 2022-2027 ($ million)
      • Exhibit 36: Chart on Merchant liquid distribution - Year-over-year growth 2022-2027 (%)
      • Exhibit 37: Data Table on Merchant liquid distribution - Year-over-year growth 2022-2027 (%)
    • 6.4 Tonnage distribution - Market size and forecast 2022-2027
      • Exhibit 38: Chart on Tonnage distribution - Market size and forecast 2022-2027 ($ million)
      • Exhibit 39: Data Table on Tonnage distribution - Market size and forecast 2022-2027 ($ million)
      • Exhibit 40: Chart on Tonnage distribution - Year-over-year growth 2022-2027 (%)
      • Exhibit 41: Data Table on Tonnage distribution - Year-over-year growth 2022-2027 (%)
    • 6.5 Cylinder and packaged distribution - Market size and forecast 2022-2027
      • Exhibit 42: Chart on Cylinder and packaged distribution - Market size and forecast 2022-2027 ($ million)
      • Exhibit 43: Data Table on Cylinder and packaged distribution - Market size and forecast 2022-2027 ($ million)
      • Exhibit 44: Chart on Cylinder and packaged distribution - Year-over-year growth 2022-2027 (%)
      • Exhibit 45: Data Table on Cylinder and packaged distribution - Year-over-year growth 2022-2027 (%)
    • 6.6 Market opportunity by Distribution Channel
      • Exhibit 46: Market opportunity by Distribution Channel ($ million)
      • Exhibit 47: Data Table on Market opportunity by Distribution Channel ($ million)

    7 Market Segmentation by Type

    • 7.1 Market segments
      • Exhibit 48: Chart on Type - Market share 2022-2027 (%)
      • Exhibit 49: Data Table on Type - Market share 2022-2027 (%)
    • 7.2 Comparison by Type
      • Exhibit 50: Chart on Comparison by Type
      • Exhibit 51: Data Table on Comparison by Type
    • 7.3 Nitrogen - Market size and forecast 2022-2027
      • Exhibit 52: Chart on Nitrogen - Market size and forecast 2022-2027 ($ million)
      • Exhibit 53: Data Table on Nitrogen - Market size and forecast 2022-2027 ($ million)
      • Exhibit 54: Chart on Nitrogen - Year-over-year growth 2022-2027 (%)
      • Exhibit 55: Data Table on Nitrogen - Year-over-year growth 2022-2027 (%)
    • 7.4 Oxygen - Market size and forecast 2022-2027
      • Exhibit 56: Chart on Oxygen - Market size and forecast 2022-2027 ($ million)
      • Exhibit 57: Data Table on Oxygen - Market size and forecast 2022-2027 ($ million)
      • Exhibit 58: Chart on Oxygen - Year-over-year growth 2022-2027 (%)
      • Exhibit 59: Data Table on Oxygen - Year-over-year growth 2022-2027 (%)
    • 7.5 Hydrogen - Market size and forecast 2022-2027
      • Exhibit 60: Chart on Hydrogen - Market size and forecast 2022-2027 ($ million)
      • Exhibit 61: Data Table on Hydrogen - Market size and forecast 2022-2027 ($ million)
      • Exhibit 62: Chart on Hydrogen - Year-over-year growth 2022-2027 (%)
      • Exhibit 63: Data Table on Hydrogen - Year-over-year growth 2022-2027 (%)
    • 7.6 Acetylene - Market size and forecast 2022-2027
      • Exhibit 64: Chart on Acetylene - Market size and forecast 2022-2027 ($ million)
      • Exhibit 65: Data Table on Acetylene - Market size and forecast 2022-2027 ($ million)
      • Exhibit 66: Chart on Acetylene - Year-over-year growth 2022-2027 (%)
      • Exhibit 67: Data Table on Acetylene - Year-over-year growth 2022-2027 (%)
    • 7.7 Others - Market size and forecast 2022-2027
      • Exhibit 68: Chart on Others - Market size and forecast 2022-2027 ($ million)
      • Exhibit 69: Data Table on Others - Market size and forecast 2022-2027 ($ million)
      • Exhibit 70: Chart on Others - Year-over-year growth 2022-2027 (%)
      • Exhibit 71: Data Table on Others - Year-over-year growth 2022-2027 (%)
    • 7.8 Market opportunity by Type
      • Exhibit 72: Market opportunity by Type ($ million)
      • Exhibit 73: Data Table on Market opportunity by Type ($ million)

    8 Customer Landscape

    • 8.1 Customer landscape overview
      • Exhibit 74: Analysis of price sensitivity, lifecycle, customer purchase basket, adoption rates, and purchase criteria

    9 Geographic Landscape

    • 9.1 Geographic segmentation
      • Exhibit 75: Chart on Market share by geography 2022-2027 (%)
      • Exhibit 76: Data Table on Market share by geography 2022-2027 (%)
    • 9.2 Geographic comparison
      • Exhibit 77: Chart on Geographic comparison
      • Exhibit 78: Data Table on Geographic comparison
    • 9.3 APAC - Market size and forecast 2022-2027
      • Exhibit 79: Chart on APAC - Market size and forecast 2022-2027 ($ million)
      • Exhibit 80: Data Table on APAC - Market size and forecast 2022-2027 ($ million)
      • Exhibit 81: Chart on APAC - Year-over-year growth 2022-2027 (%)
      • Exhibit 82: Data Table on APAC - Year-over-year growth 2022-2027 (%)
    • 9.4 Europe - Market size and forecast 2022-2027
      • Exhibit 83: Chart on Europe - Market size and forecast 2022-2027 ($ million)
      • Exhibit 84: Data Table on Europe - Market size and forecast 2022-2027 ($ million)
      • Exhibit 85: Chart on Europe - Year-over-year growth 2022-2027 (%)
      • Exhibit 86: Data Table on Europe - Year-over-year growth 2022-2027 (%)
    • 9.5 North America - Market size and forecast 2022-2027
      • Exhibit 87: Chart on North America - Market size and forecast 2022-2027 ($ million)
      • Exhibit 88: Data Table on North America - Market size and forecast 2022-2027 ($ million)
      • Exhibit 89: Chart on North America - Year-over-year growth 2022-2027 (%)
      • Exhibit 90: Data Table on North America - Year-over-year growth 2022-2027 (%)
    • 9.6 South America - Market size and forecast 2022-2027
      • Exhibit 91: Chart on South America - Market size and forecast 2022-2027 ($ million)
      • Exhibit 92: Data Table on South America - Market size and forecast 2022-2027 ($ million)
      • Exhibit 93: Chart on South America - Year-over-year growth 2022-2027 (%)
      • Exhibit 94: Data Table on South America - Year-over-year growth 2022-2027 (%)
    • 9.7 Middle East and Africa - Market size and forecast 2022-2027
      • Exhibit 95: Chart on Middle East and Africa - Market size and forecast 2022-2027 ($ million)
      • Exhibit 96: Data Table on Middle East and Africa - Market size and forecast 2022-2027 ($ million)
      • Exhibit 97: Chart on Middle East and Africa - Year-over-year growth 2022-2027 (%)
      • Exhibit 98: Data Table on Middle East and Africa - Year-over-year growth 2022-2027 (%)
    • 9.8 China - Market size and forecast 2022-2027
      • Exhibit 99: Chart on China - Market size and forecast 2022-2027 ($ million)
      • Exhibit 100: Data Table on China - Market size and forecast 2022-2027 ($ million)
      • Exhibit 101: Chart on China - Year-over-year growth 2022-2027 (%)
      • Exhibit 102: Data Table on China - Year-over-year growth 2022-2027 (%)
    • 9.9 US - Market size and forecast 2022-2027
      • Exhibit 103: Chart on US - Market size and forecast 2022-2027 ($ million)
      • Exhibit 104: Data Table on US - Market size and forecast 2022-2027 ($ million)
      • Exhibit 105: Chart on US - Year-over-year growth 2022-2027 (%)
      • Exhibit 106: Data Table on US - Year-over-year growth 2022-2027 (%)
    • 9.10 Japan - Market size and forecast 2022-2027
      • Exhibit 107: Chart on Japan - Market size and forecast 2022-2027 ($ million)
      • Exhibit 108: Data Table on Japan - Market size and forecast 2022-2027 ($ million)
      • Exhibit 109: Chart on Japan - Year-over-year growth 2022-2027 (%)
      • Exhibit 110: Data Table on Japan - Year-over-year growth 2022-2027 (%)
    • 9.11 Germany - Market size and forecast 2022-2027
      • Exhibit 111: Chart on Germany - Market size and forecast 2022-2027 ($ million)
      • Exhibit 112: Data Table on Germany - Market size and forecast 2022-2027 ($ million)
      • Exhibit 113: Chart on Germany - Year-over-year growth 2022-2027 (%)
      • Exhibit 114: Data Table on Germany - Year-over-year growth 2022-2027 (%)
    • 9.12 India - Market size and forecast 2022-2027
      • Exhibit 115: Chart on India - Market size and forecast 2022-2027 ($ million)
      • Exhibit 116: Data Table on India - Market size and forecast 2022-2027 ($ million)
      • Exhibit 117: Chart on India - Year-over-year growth 2022-2027 (%)
      • Exhibit 118: Data Table on India - Year-over-year growth 2022-2027 (%)
    • 9.13 Market opportunity by geography
      • Exhibit 119: Market opportunity by geography ($ million)
      • Exhibit 120: Data Tables on Market opportunity by geography ($ million)

    10 Drivers, Challenges, and Trends

    • 10.1 Market drivers
      • 10.2 Market challenges
        • 10.3 Impact of drivers and challenges
          • Exhibit 121: Impact of drivers and challenges in 2022 and 2027
        • 10.4 Market trends

          11 Vendor Landscape

          • 11.1 Overview
            • 11.2 Vendor landscape
              • Exhibit 122: Overview on Criticality of inputs and Factors of differentiation
            • 11.3 Landscape disruption
              • Exhibit 123: Overview on factors of disruption
            • 11.4 Industry risks
              • Exhibit 124: Impact of key risks on business

            12 Vendor Analysis

            • 12.1 Vendors covered
              • Exhibit 125: Vendors covered
            • 12.2 Market positioning of vendors
              • Exhibit 126: Matrix on vendor position and classification
            • 12.3 Air Liquide SA
              • Exhibit 127: Air Liquide SA - Overview
              • Exhibit 128: Air Liquide SA - Business segments
              • Exhibit 129: Air Liquide SA - Key offerings
              • Exhibit 130: Air Liquide SA - Segment focus
            • 12.4 Air Products and Chemicals Inc.
              • Exhibit 131: Air Products and Chemicals Inc. - Overview
              • Exhibit 132: Air Products and Chemicals Inc. - Business segments
              • Exhibit 133: Air Products and Chemicals Inc. - Key news
              • Exhibit 134: Air Products and Chemicals Inc. - Key offerings
              • Exhibit 135: Air Products and Chemicals Inc. - Segment focus
            • 12.5 Air Water Inc.
              • Exhibit 136: Air Water Inc. - Overview
              • Exhibit 137: Air Water Inc. - Business segments
              • Exhibit 138: Air Water Inc. - Key offerings
              • Exhibit 139: Air Water Inc. - Segment focus
            • 12.6 Gulf Cryo Holding CSC
              • Exhibit 140: Gulf Cryo Holding CSC - Overview
              • Exhibit 141: Gulf Cryo Holding CSC - Product / Service
              • Exhibit 142: Gulf Cryo Holding CSC - Key offerings
            • 12.7 HoSt Holding B.V.
              • Exhibit 143: HoSt Holding B.V. - Overview
              • Exhibit 144: HoSt Holding B.V. - Product / Service
              • Exhibit 145: HoSt Holding B.V. - Key offerings
            • 12.8 Iwatani Corp.
              • Exhibit 146: Iwatani Corp. - Overview
              • Exhibit 147: Iwatani Corp. - Business segments
              • Exhibit 148: Iwatani Corp. - Key offerings
              • Exhibit 149: Iwatani Corp. - Segment focus
            • 12.9 Messer SE and Co. KGaA
              • Exhibit 150: Messer SE and Co. KGaA - Overview
              • Exhibit 151: Messer SE and Co. KGaA - Product / Service
              • Exhibit 152: Messer SE and Co. KGaA - Key offerings
            • 12.10 Mitsubishi Chemical Group Corp.
              • Exhibit 153: Mitsubishi Chemical Group Corp. - Overview
              • Exhibit 154: Mitsubishi Chemical Group Corp. - Business segments
              • Exhibit 155: Mitsubishi Chemical Group Corp. - Key offerings
              • Exhibit 156: Mitsubishi Chemical Group Corp. - Segment focus
            • 12.11 SIG Gases Berhad
              • Exhibit 157: SIG Gases Berhad - Overview
              • Exhibit 158: SIG Gases Berhad - Product / Service
              • Exhibit 159: SIG Gases Berhad - Key offerings
            • 12.12 SOL Spa
              • Exhibit 160: SOL Spa - Overview
              • Exhibit 161: SOL Spa - Product / Service
              • Exhibit 162: SOL Spa - Key offerings
            • 12.13 The Linde Group
              • Exhibit 163: The Linde Group - Overview
              • Exhibit 164: The Linde Group - Business segments
              • Exhibit 165: The Linde Group - Key offerings
              • Exhibit 166: The Linde Group - Segment focus
            • 12.14 Yingde Gas Group Co. Ltd.
              • Exhibit 167: Yingde Gas Group Co. Ltd. - Overview
              • Exhibit 168: Yingde Gas Group Co. Ltd. - Product / Service
              • Exhibit 169: Yingde Gas Group Co. Ltd. - Key offerings

            13 Appendix

            • 13.1 Scope of the report
              • 13.2 Inclusions and exclusions checklist
                • Exhibit 170: Inclusions checklist
                • Exhibit 171: Exclusions checklist
              • 13.3 Currency conversion rates for US$
                • Exhibit 172: Currency conversion rates for US$
              • 13.4 Research methodology
                • Exhibit 173: Research methodology
                • Exhibit 174: Validation techniques employed for market sizing
                • Exhibit 175: Information sources
              • 13.5 List of abbreviations
                • Exhibit 176: List of abbreviations

              Research Methodology

              Technavio presents a detailed picture of the market by way of study, synthesis, and summation of data from multiple sources. The analysts have presented the various facets of the market with a particular focus on identifying the key industry influencers. The data thus presented is comprehensive, reliable, and the result of extensive research, both primary and secondary.

              INFORMATION SOURCES

              Primary sources

              • Manufacturers and suppliers
              • Channel partners
              • Industry experts
              • Strategic decision makers

              Secondary sources

              • Industry journals and periodicals
              • Government data
              • Financial reports of key industry players
              • Historical data
              • Press releases

              DATA ANALYSIS

              Data Synthesis

              • Collation of data
              • Estimation of key figures
              • Analysis of derived insights

              Data Validation

              • Triangulation with data models
              • Reference against proprietary databases
              • Corroboration with industry experts

              REPORT WRITING

              Qualitative

              • Market drivers
              • Market challenges
              • Market trends
              • Five forces analysis

              Quantitative

              • Market size and forecast
              • Market segmentation
              • Geographical insights
              • Competitive landscape

              Interested in this report?

              Get your sample now to see our research methodology and insights!

              Download Now

              Frequently Asked Questions

              Industrial Gasesfor Glass Industry market growth will increase by $ 808.18 mn during 2023-2027.

              The Industrial Gasesfor Glass Industry market is expected to grow at a CAGR of 4.62% during 2023-2027.

              Industrial Gasesfor Glass Industry market is segmented by Distribution Channel( Merchant liquid distribution, Tonnage distribution, Cylinder and packaged distribution) Type( Nitrogen, Oxygen, Hydrogen, Acetylene, Others)

              Air Water Inc., Messer SE and Co. KGaA, Gulf Cryo Holding CSC, HoSt Holding B.V., Iwatani Corp., Mitsubishi Chemical Group Corp., SOL Spa, SIG Gases Berhad, Air Liquide SA, Air Products and Chemicals Inc., The Linde Group, Yingde Gas Group Co. Ltd. are a few of the key vendors in the Industrial Gasesfor Glass Industry market.

              APAC will register the highest growth rate of 61% among the other regions. Therefore, the Industrial Gasesfor Glass Industry market in APAC is expected to garner significant business opportunities for the vendors during the forecast period.

              US, China, Japan, India, Germany

              • Augmented demand for glass from construction industryThe growth of the construction industry is a key driver of the growth of the global industrial gases market for glass industry. Oxygen is the driving factor this market.
              • sulfur dioxide is the driving factor this market.
              • krypton is the driving factor this market.
              • silane is the driving factor this market.
              • carbon dioxide is the driving factor this market.
              • oxides of nitrogen is the driving factor this market.
              • and hydrogen are the major industrial gases that are used in the production of glass is the driving factor this market.
              • which is used in windows for commercial and residential construction. Industrial gases are primarily used for the melting of glass during production. According to the United Nations is the driving factor this market.
              • the global population is anticipated to reach approximately 8.6 billion by 2030 is the driving factor this market.
              • with almost 60% of the population growth arising from Asia. The growth of the population is a key factor that drives the growth of the global construction industry. Key countries that are expected to contribute to the growth of residential construction during the forecast period are India is the driving factor this market.
              • China is the driving factor this market.
              • the US is the driving factor this market.
              • Japan is the driving factor this market.
              • Germany is the driving factor this market.
              • France is the driving factor this market.
              • Italy is the driving factor this market.
              • Russia is the driving factor this market.
              • Brazil is the driving factor this market.
              • Mexico is the driving factor this market.
              • South Korea is the driving factor this market.
              • and Saudi Arabia. The migration of most of the population of Africa and several underdeveloped Asian countries due to the availability of employment opportunities in the above-mentioned countries is a key factor that will drive the growth of residential construction. Apart from residential construction providing major growth prospects for the industrial gases market for glass industry is the driving factor this market.
              • commercial construction also drives the growth of industrial gases. Some commercial construction activities that will lead to the expansion of the industrial gases market include: The construction of the Al Maktoum International Airport is the driving factor this market.
              • Dubai The construction of the Jubail II Industrial City plan in Saudi Arabia is the driving factor this market.
              • which is expected to be completed by 2024 The construction of Dubailand in Dubai is the driving factor this market.
              • which is scheduled to be completed by 2025 The construction of the London Crossrail project The expansion of Beijing Airport is the driving factor this market.
              • which is scheduled for completion by 2025 Therefore is the driving factor this market.
              • the augmented demand for glass from the construction industry is expected to propel the growth of the global industrial gases market for glass industry during the forecast period. is the driving factor this market.

              The Industrial Gasesfor Glass Industry market vendors should focus on grabbing business opportunities from the Merchant liquid distribution segment as it accounted for the largest market share in the base year.
              RIA - Research AI Assistant
              Ask RIA