Industrial Rack and Pinion Market Analysis APAC, Europe, North America, Middle East and Africa, South America - China, US, Germany, India, Canada - Size and Forecast 2024-2028

Industrial Rack and Pinion Market Analysis APAC, Europe, North America, Middle East and Africa, South America - China, US, Germany, India, Canada - Size and Forecast 2024-2028

Published: May 2024 172 Pages SKU: IRTNTR45618

Market Overview at a Glance

$998.6 Mn
Market Opportunity
9.45%
CAGR
8.41
YoY growth 2023-2024(%)

Industrial Rack And Pinion Market Size 2024-2028 

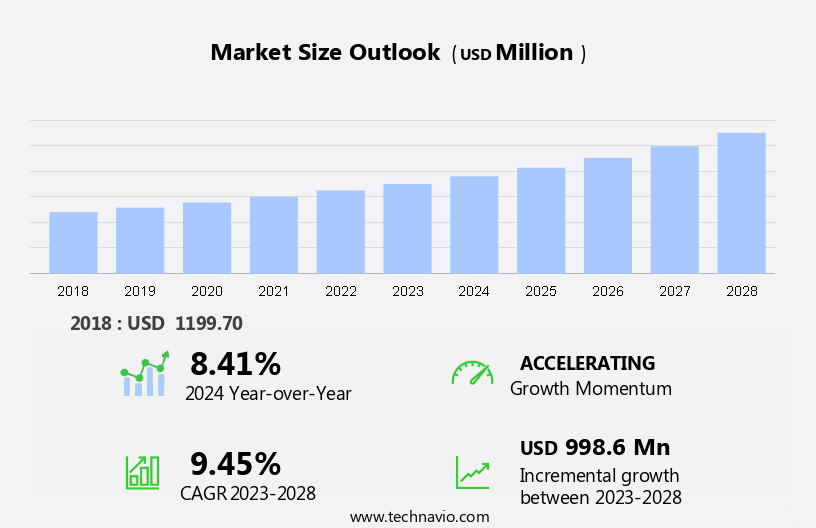
The industrial rack and pinion market size is forecast to increase by USD 998.6 million at a CAGR of 9.45% between 2023 and 2028. The market is driven by the growth of industrial manufacturing, leading to an increase in demand for machine tools. This sector's expansion is fueled by the rising production of automobiles, electronics, and heavy machinery. Additionally, the increasing demand for stairlifts in offices and public buildings is another growth factor. However, the availability of substitutes for rack and pinion systems, such as belt drives and ball screws, poses a challenge to market growth. Despite this, the market is expected to continue its upward trajectory due to the superior efficiency and precision offered by rack and pinion systems. These systems' ability to handle heavy loads and high power density makes them an ideal choice for various industrial applications.

Industrial Rack And Pinion Market Size

 Request Free Sample

The market is witnessing significant growth due to its applications in various sectors, including automobile sales, steering wheels, and stair lifts. Rack and pinion drives provide essential rotational motion for linear actuators, making them vital in industrial machinery, mining equipment, and agricultural machinery. The integration of high-performance gear rack and pinion systems enhances precision machining and CNC machining processes, particularly when utilizing high-strength alloys and advanced materials like composites. Furthermore, the demand for wind turbines and marine applications boosts the need for reliable mechanical components. As industries move towards digital manufacturing and integration with automation, the market for rack and pinions is set to expand rapidly, driving innovation and efficiency.

Market Segmentation

The market research report provides comprehensive data (region-wise segment analysis), with forecasts and estimates in "USD million" for the period 2024-2028, as well as historical data from 2018 - 2022 for the following segments.

  • Product
    • Machine tools
    • Linear actuation and guideways
    • Material handling
  • Type
    • Alloy steel
    • Carbon steel
    • Stainless steel
    • Aluminum alloy
    • Plastic
  • Geography
    • APAC
      • China
      • India
    • Europe
      • Germany
    • North America
      • Canada
      • US
    • Middle East and Africa
    • South America

By Product Insights

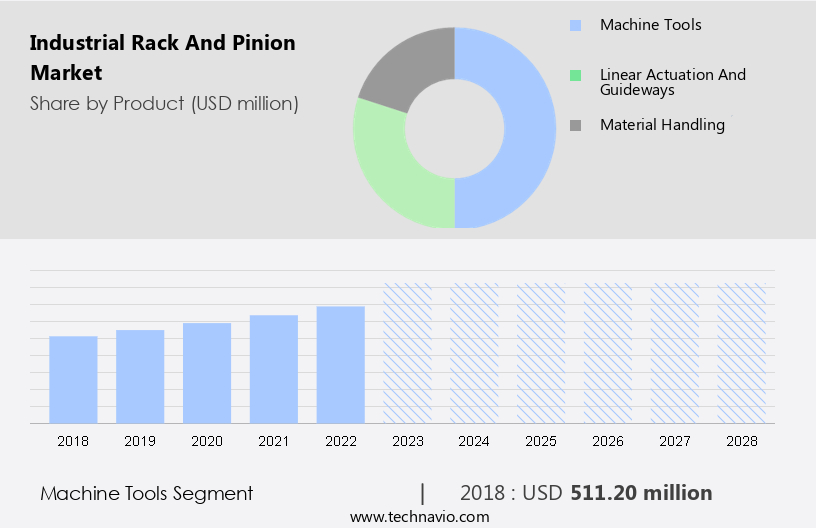
The machine tools segment is estimated to witness significant growth during the forecast period.The market is witnessing significant growth due to its extensive applications in various industries. Machine tools, actuators, and material handling systems are primary end-users of this market. In process industries, rack and pinion systems are utilized for rotary and linear motion in drive trains and motor technology. Stairlifts and offices also make use of this technology for smooth and precise movement. Zero backlash, a crucial feature of rack and pinion systems, ensures accurate positioning in IoT-enabled industrial applications. ZHY Gear, a leading player, offers customized solutions for industries such as wind turbine gearboxes, construction equipment, power plants, and oilfields. Condition monitoring systems integrated with rack and pinion technology enhance system efficiency and reliability. Industrial gears and drive trains benefit from the durability of rack and pinion systems, making them an indispensable component in numerous industries.

Industrial Rack And Pinion Market Size

Get a glance at the market share of various segments Request Free Sample

The machine tools segment was valued at USD 511.20 million in 2018 and showed a gradual increase during the forecast period.

Regional Insights

APAC is estimated to contribute 41% to the growth of the global market during the forecast period. Technavio's analysts have elaborately explained the regional trends and drivers that shape the market during the forecast period.

Industrial Rack And Pinion Market Share by Geography

For more insights on the market share of various regions Request Free Sample

The market is witnessing significant growth due to its extensive applications in various industries. Machine tools, actuators, and material handling systems are major end-users of industrial rack and pinion systems. In process industries, these systems are employed for precise rotary and linear motion in applications such as wind turbine gearboxes, motor technology, and drive trains. Stairlifts and offices also utilize rack and pinion systems for smooth vertical motion. The integration of IoT and condition monitoring technologies enhances the efficiency and reliability of these systems. ZHY Gear, a key player in the industrial gear market, offers zero backlash rack and pinion gears for construction equipment, power plants, oilfields, and other heavy-duty applications. These gears ensure minimal play and accurate positioning, contributing to the overall performance and productivity of the equipment.

Our researchers analyzed the data with 2023 as the base year, along with the key drivers, trends, and challenges. A holistic analysis of drivers will help companies refine their marketing strategies to gain a competitive advantage.

Industrial Rack And Pinion Market Driver

The growth of industrial manufacturing leading to an increase in demand for machine tools is the key driver of the market. In the realm of industrial manufacturing, particularly within discrete sectors, machine tools play a pivotal role in executing various machining processes such as cutting, milling, drilling, and boring on metal, wood, or plastic components. Machine tools employ both manual and automated systems, with the former utilizing handwheels for torque application and the latter, electric motors. To facilitate linear motion in these applications, rack and pinion assemblies are employed as a mechanism for converting rotary motion into linear motion. As the demand for machine tools escalates due to their widespread use in industries like process industries, material handling, offices, and even in specialized applications such as stairlifts and wind turbine gearboxes, the need for rack and pinion assemblies also the demand.

Moreover, these assemblies find application in diverse industries, including motor technology, drive trains, construction equipment, power plants, oilfields, and rotary or linear motion systems. With the advent of IoT and condition monitoring technologies, rack and pinion assemblies are increasingly being integrated with advanced features such as zero backlash and precision gearing, further enhancing their appeal and utility. ZHY Gear, a leading industrial gear manufacturer, offers a comprehensive range of rack and pinion assemblies, catering to various industries and applications.

Industrial Rack And Pinion Market Trends

Increasing demand for stairlifts in offices is the upcoming trend in the market. The market caters to various industries, including Machine Tools, Process industries, and Material handling, providing essential components for actuators and drive trains. These components are integral to motor technology, enabling rotary and linear motion in diverse applications. In Material handling, rack and pinion systems are employed in stairlifts, offering an alternative solution for individuals with mobility challenges due to arthritis, joint stiffness, or injuries. In industries such as Construction equipment, Power plants, Oilfields, and Wind turbine gearboxes, rack and pinion systems ensure zero-backlash and precise movement, contributing to overall efficiency and productivity. With the advent of IoT and condition monitoring, these systems are increasingly being integrated to enhance performance and reduce maintenance costs. ZHY Gear, a leading industrial gear manufacturer, offers high-quality rack and pinion systems, catering to the specific requirements of different industries and applications.

Industrial Rack And Pinion Market Challenge

The availability of substitutes for rack and pinion systems is a key challenge affecting the market growth. Rack and pinion systems are essential components in various industries, including machine tools, process industries, material handling, and construction equipment, for converting rotary motion into linear motion. Actuators that employ rack and pinion mechanisms are widely used in applications such as Stairlifts, Offices, and Zero backlash systems. In the realm of Industry 4.0, IoT and condition monitoring technologies are increasingly integrated into rack and pinion systems for enhanced performance and efficiency. ZHY Gear, a leading industrial gear manufacturer, offers advanced rack and pinion solutions for diverse applications. These include machine tool drives, motor technology, drive trains, and wind turbine gearboxes.

Moreover, in power plants and oilfields, rack and pinion systems are utilized for rotary and linear motion applications, ensuring optimal performance and reliability. Despite the availability of other linear actuation mechanisms like ball screws, lead screws, and linear motors, rack and pinion systems maintain a significant market presence due to their versatility and cost-effectiveness. However, it is crucial to consider the specific application requirements, such as length and speed, when selecting the appropriate linear actuation mechanism. For instance, while ball screw systems offer smooth and almost friction-free movement, they may vibrate or whip when the length of the axis is more, and the ball bearing rotates faster than the critical speed of rotation.

Thus, rack and pinion systems are an optimal choice for applications requiring smooth and friction-free actuation over long lengths or spans.

Exclusive Customer Landscape

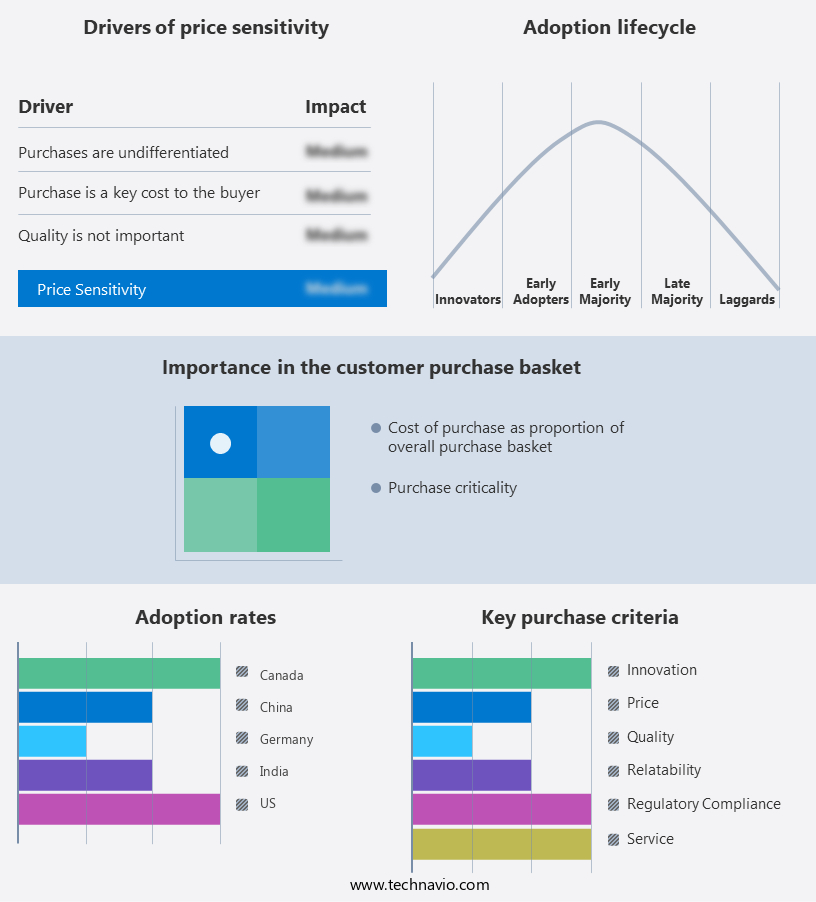
The market forecasting report includes the adoption lifecycle of the market, covering from the innovator's stage to the laggard's stage. It focuses on adoption rates in different regions based on penetration. Furthermore, the report also includes key purchase criteria and drivers of price sensitivity to help companies evaluate and develop their market growth analysis strategies.

Industrial Rack And Pinion Market Share by Geography

 Customer Landscape

Key Companies & Market Insights

Companies are implementing various strategies, such as strategic alliances, partnerships, mergers and acquisitions, geographical expansion, and product/service launches, to enhance their presence in the market.

Apex Dynamics Inc: The company offers industrial racks and pinions such as Precision racks.

The market research and growth report includes detailed analyses of the competitive landscape of the market and information about key companies, including:

  • ATLANTA Antriebssysteme GmbH
  • B and B Manufacturing Inc.
  • Commercial Gear and Sprocket Co. Inc.
  • GAM Enterprises Inc.
  • Gudel Group AG
  • HMK Automation Group Ltd.
  • Kohara Gear Industry Co. Ltd.
  • Lomar Machine and Tool Co.
  • MIJNO PRECISION GEARING SAS
  • Nexen Group Inc.
  • Nidec Corp.
  • P R Components Pvt. Ltd.
  • Pearl Engineers
  • REDEX Group
  • Reliance Precision Ltd.
  • Sati SpA
  • Shri Butbhavani Engineering
  • Statewide Bearings
  • Yuan Yi Chang Machinery Co. Ltd.

Qualitative and quantitative analysis of companies has been conducted to help clients understand the wider business environment as well as the strengths and weaknesses of key market players. Data is qualitatively analyzed to categorize companies as pure play, category-focused, industry-focused, and diversified; it is quantitatively analyzed to categorize companies as dominant, leading, strong, tentative, and weak.

Research Analyst Overview

The linear actuator is a critical component in various applications, including steering wheels for electric vehicles and autonomous vehicles. These devices play a vital role in enhancing infrastructure and industrial automation by providing efficient motion control systems. With advancements in robotics, gear shaping, and precision engineering, modern CNC machines are designed to optimize load capacity and accuracy. In sectors like aerospace and renewable energy, electric actuators and servomotors equipped with advanced sensors and control systems ensure reliable operation. As industries continue to embrace automation systems, engineered materials like engineered plastics are increasingly utilized for their lightweight and durable properties, further driving innovation and efficiency across sectors.

Market Scope

Report Coverage

Details

Page number

172

Base year

2023

Historic period

2018 - 2022

Forecast period

2024-2028

Growth momentum & CAGR

Accelerate at a CAGR of 9.45%

Market Growth 2024-2028

USD 998.6 million

Market structure

Fragmented

YoY growth 2023-2024(%)

8.41

Regional analysis

APAC, Europe, North America, Middle East and Africa, and South America

Performing market contribution

APAC at 41%

Key countries

China, US, Germany, India, and Canada

Competitive landscape

Leading Companies, Market Positioning of Companies, Competitive Strategies, and Industry Risks

Key companies profiled

Apex Dynamics Inc., ATLANTA Antriebssysteme GmbH, B and B Manufacturing Inc., Commercial Gear and Sprocket Co. Inc., GAM Enterprises Inc., Gudel Group AG, HMK Automation Group Ltd., Kohara Gear Industry Co. Ltd., Lomar Machine and Tool Co., MIJNO PRECISION GEARING SAS, Nexen Group Inc., Nidec Corp., P R Components Pvt. Ltd., Pearl Engineers, REDEX Group, Reliance Precision Ltd., Sati SpA, Shri Butbhavani Engineering, Statewide Bearings, and Yuan Yi Chang Machinery Co. Ltd.

Market dynamics

Parent market analysis, market growth inducers and obstacles, market forecast, fast-growing and slow-growing segment analysis, COVID-19 impact and recovery analysis and future consumer dynamics, market condition analysis for the forecast period

Customization purview

If our market report has not included the data that you are looking for, you can reach out to our analysts and get segments customized.

Request Free Sample

What are the Key Data Covered in this Market Research and Growth Report?

  • CAGR of the market during the forecast period
  • Detailed information on factors that will drive the market growth and forecasting between 2024 and 2028
  • Precise estimation of the size of the market  and its contribution of the market in focus to the parent market
  • Accurate predictions about upcoming market growth and trends and changes in consumer behaviour
  • Growth of the market across APAC, Europe, North America, Middle East and Africa, and South America
  • Thorough analysis of the market's competitive landscape and detailed information about companies
  • Comprehensive analysis of factors that will challenge the growth of market companies

We can help! Our analysts can customize this market research report to meet your requirements. Get in touch

1 Executive Summary

  • 1.1 Market overview
    • Executive Summary - Chart on Market Overview
    • Executive Summary - Data Table on Market Overview
    • Executive Summary - Chart on Global Market Characteristics
    • Executive Summary - Chart on Market by Geography
    • Executive Summary - Chart on Market Segmentation by Product
    • Executive Summary - Chart on Market Segmentation by Type
    • Executive Summary - Chart on Incremental Growth
    • Executive Summary - Data Table on Incremental Growth
    • Executive Summary - Chart on Company Market Positioning

2 Market Landscape

  • 2.1 Market ecosystem
    • Parent Market
    • Data Table on - Parent Market
  • 2.2 Market characteristics
    • Market characteristics analysis
  • 2.3 Value chain analysis
    • Value Chain Analysis

3 Market Sizing

  • 3.1 Market definition
    • Offerings of companies included in the market definition
  • 3.2 Market segment analysis
    • Market segments
  • 3.3 Market size 2023
    • 3.4 Market outlook: Forecast for 2023-2028
      • Chart on Global - Market size and forecast 2023-2028 ($ million)
      • Data Table on Global - Market size and forecast 2023-2028 ($ million)
      • Chart on Global Market: Year-over-year growth 2023-2028 (%)
      • Data Table on Global Market: Year-over-year growth 2023-2028 (%)

    4 Historic Market Size

    • 4.1 Global Industrial Rack And Pinion Market 2018 - 2022
      • Historic Market Size - Data Table on Global Industrial Rack And Pinion Market 2018 - 2022 ($ million)
    • 4.2 Product segment analysis 2018 - 2022
      • Historic Market Size - Product Segment 2018 - 2022 ($ million)
    • 4.3 Type segment analysis 2018 - 2022
      • Historic Market Size - Type Segment 2018 - 2022 ($ million)
    • 4.4 Geography segment analysis 2018 - 2022
      • Historic Market Size - Geography Segment 2018 - 2022 ($ million)
    • 4.5 Country segment analysis 2018 - 2022
      • Historic Market Size - Country Segment 2018 - 2022 ($ million)

    5 Five Forces Analysis

    • 5.1 Five forces summary
      • Five forces analysis - Comparison between 2023 and 2028
    • 5.2 Bargaining power of buyers
      • Bargaining power of buyers - Impact of key factors 2023 and 2028
    • 5.3 Bargaining power of suppliers
      • Bargaining power of suppliers - Impact of key factors in 2023 and 2028
    • 5.4 Threat of new entrants
      • Threat of new entrants - Impact of key factors in 2023 and 2028
    • 5.5 Threat of substitutes
      • Threat of substitutes - Impact of key factors in 2023 and 2028
    • 5.6 Threat of rivalry
      • Threat of rivalry - Impact of key factors in 2023 and 2028
    • 5.7 Market condition
      • Chart on Market condition - Five forces 2023 and 2028

    6 Market Segmentation by Product

    • 6.1 Market segments
      • Chart on Product - Market share 2023-2028 (%)
      • Data Table on Product - Market share 2023-2028 (%)
    • 6.2 Comparison by Product
      • Chart on Comparison by Product
      • Data Table on Comparison by Product
    • 6.3 Machine tools - Market size and forecast 2023-2028
      • Chart on Machine tools - Market size and forecast 2023-2028 ($ million)
      • Data Table on Machine tools - Market size and forecast 2023-2028 ($ million)
      • Chart on Machine tools - Year-over-year growth 2023-2028 (%)
      • Data Table on Machine tools - Year-over-year growth 2023-2028 (%)
    • 6.4 Linear actuation and guideways - Market size and forecast 2023-2028
      • Chart on Linear actuation and guideways - Market size and forecast 2023-2028 ($ million)
      • Data Table on Linear actuation and guideways - Market size and forecast 2023-2028 ($ million)
      • Chart on Linear actuation and guideways - Year-over-year growth 2023-2028 (%)
      • Data Table on Linear actuation and guideways - Year-over-year growth 2023-2028 (%)
    • 6.5 Material handling - Market size and forecast 2023-2028
      • Chart on Material handling - Market size and forecast 2023-2028 ($ million)
      • Data Table on Material handling - Market size and forecast 2023-2028 ($ million)
      • Chart on Material handling - Year-over-year growth 2023-2028 (%)
      • Data Table on Material handling - Year-over-year growth 2023-2028 (%)
    • 6.6 Market opportunity by Product
      • Market opportunity by Product ($ million)
      • Data Table on Market opportunity by Product ($ million)

    7 Market Segmentation by Type

    • 7.1 Market segments
      • Chart on Type - Market share 2023-2028 (%)
      • Data Table on Type - Market share 2023-2028 (%)
    • 7.2 Comparison by Type
      • Chart on Comparison by Type
      • Data Table on Comparison by Type
    • 7.3 Alloy steel - Market size and forecast 2023-2028
      • Chart on Alloy steel - Market size and forecast 2023-2028 ($ million)
      • Data Table on Alloy steel - Market size and forecast 2023-2028 ($ million)
      • Chart on Alloy steel - Year-over-year growth 2023-2028 (%)
      • Data Table on Alloy steel - Year-over-year growth 2023-2028 (%)
    • 7.4 Carbon steel - Market size and forecast 2023-2028
      • Chart on Carbon steel - Market size and forecast 2023-2028 ($ million)
      • Data Table on Carbon steel - Market size and forecast 2023-2028 ($ million)
      • Chart on Carbon steel - Year-over-year growth 2023-2028 (%)
      • Data Table on Carbon steel - Year-over-year growth 2023-2028 (%)
    • 7.5 Stainless steel - Market size and forecast 2023-2028
      • Chart on Stainless steel - Market size and forecast 2023-2028 ($ million)
      • Data Table on Stainless steel - Market size and forecast 2023-2028 ($ million)
      • Chart on Stainless steel - Year-over-year growth 2023-2028 (%)
      • Data Table on Stainless steel - Year-over-year growth 2023-2028 (%)
    • 7.6 Aluminum alloy - Market size and forecast 2023-2028
      • Chart on Aluminum alloy - Market size and forecast 2023-2028 ($ million)
      • Data Table on Aluminum alloy - Market size and forecast 2023-2028 ($ million)
      • Chart on Aluminum alloy - Year-over-year growth 2023-2028 (%)
      • Data Table on Aluminum alloy - Year-over-year growth 2023-2028 (%)
    • 7.7 Plastic - Market size and forecast 2023-2028
      • Chart on Plastic - Market size and forecast 2023-2028 ($ million)
      • Data Table on Plastic - Market size and forecast 2023-2028 ($ million)
      • Chart on Plastic - Year-over-year growth 2023-2028 (%)
      • Data Table on Plastic - Year-over-year growth 2023-2028 (%)
    • 7.8 Market opportunity by Type
      • Market opportunity by Type ($ million)
      • Data Table on Market opportunity by Type ($ million)

    8 Customer Landscape

    • 8.1 Customer landscape overview
      • Analysis of price sensitivity, lifecycle, customer purchase basket, adoption rates, and purchase criteria

    9 Geographic Landscape

    • 9.1 Geographic segmentation
      • Chart on Market share by geography 2023-2028 (%)
      • Data Table on Market share by geography 2023-2028 (%)
    • 9.2 Geographic comparison
      • Chart on Geographic comparison
      • Data Table on Geographic comparison
    • 9.3 APAC - Market size and forecast 2023-2028
      • Chart on APAC - Market size and forecast 2023-2028 ($ million)
      • Data Table on APAC - Market size and forecast 2023-2028 ($ million)
      • Chart on APAC - Year-over-year growth 2023-2028 (%)
      • Data Table on APAC - Year-over-year growth 2023-2028 (%)
    • 9.4 Europe - Market size and forecast 2023-2028
      • Chart on Europe - Market size and forecast 2023-2028 ($ million)
      • Data Table on Europe - Market size and forecast 2023-2028 ($ million)
      • Chart on Europe - Year-over-year growth 2023-2028 (%)
      • Data Table on Europe - Year-over-year growth 2023-2028 (%)
    • 9.5 North America - Market size and forecast 2023-2028
      • Chart on North America - Market size and forecast 2023-2028 ($ million)
      • Data Table on North America - Market size and forecast 2023-2028 ($ million)
      • Chart on North America - Year-over-year growth 2023-2028 (%)
      • Data Table on North America - Year-over-year growth 2023-2028 (%)
    • 9.6 Middle East and Africa - Market size and forecast 2023-2028
      • Chart on Middle East and Africa - Market size and forecast 2023-2028 ($ million)
      • Data Table on Middle East and Africa - Market size and forecast 2023-2028 ($ million)
      • Chart on Middle East and Africa - Year-over-year growth 2023-2028 (%)
      • Data Table on Middle East and Africa - Year-over-year growth 2023-2028 (%)
    • 9.7 South America - Market size and forecast 2023-2028
      • Chart on South America - Market size and forecast 2023-2028 ($ million)
      • Data Table on South America - Market size and forecast 2023-2028 ($ million)
      • Chart on South America - Year-over-year growth 2023-2028 (%)
      • Data Table on South America - Year-over-year growth 2023-2028 (%)
    • 9.8 China - Market size and forecast 2023-2028
      • Chart on China - Market size and forecast 2023-2028 ($ million)
      • Data Table on China - Market size and forecast 2023-2028 ($ million)
      • Chart on China - Year-over-year growth 2023-2028 (%)
      • Data Table on China - Year-over-year growth 2023-2028 (%)
    • 9.9 US - Market size and forecast 2023-2028
      • Chart on US - Market size and forecast 2023-2028 ($ million)
      • Data Table on US - Market size and forecast 2023-2028 ($ million)
      • Chart on US - Year-over-year growth 2023-2028 (%)
      • Data Table on US - Year-over-year growth 2023-2028 (%)
    • 9.10 Germany - Market size and forecast 2023-2028
      • Chart on Germany - Market size and forecast 2023-2028 ($ million)
      • Data Table on Germany - Market size and forecast 2023-2028 ($ million)
      • Chart on Germany - Year-over-year growth 2023-2028 (%)
      • Data Table on Germany - Year-over-year growth 2023-2028 (%)
    • 9.11 India - Market size and forecast 2023-2028
      • Chart on India - Market size and forecast 2023-2028 ($ million)
      • Data Table on India - Market size and forecast 2023-2028 ($ million)
      • Chart on India - Year-over-year growth 2023-2028 (%)
      • Data Table on India - Year-over-year growth 2023-2028 (%)
    • 9.12 Canada - Market size and forecast 2023-2028
      • Chart on Canada - Market size and forecast 2023-2028 ($ million)
      • Data Table on Canada - Market size and forecast 2023-2028 ($ million)
      • Chart on Canada - Year-over-year growth 2023-2028 (%)
      • Data Table on Canada - Year-over-year growth 2023-2028 (%)
    • 9.13 Market opportunity by geography
      • Market opportunity by geography ($ million)
      • Data Tables on Market opportunity by geography ($ million)

    10 Drivers, Challenges, and Opportunity/Restraints

    • 10.1 Market drivers
      • 10.2 Market challenges
        • 10.3 Impact of drivers and challenges
          • Impact of drivers and challenges in 2023 and 2028
        • 10.4 Market opportunities/restraints

          11 Competitive Landscape

          • 11.1 Overview
            • 11.2 Competitive Landscape
              • Overview on criticality of inputs and factors of differentiation
            • 11.3 Landscape disruption
              • Overview on factors of disruption
            • 11.4 Industry risks
              • Impact of key risks on business

            12 Competitive Analysis

            • 12.1 Companies profiled
              • Companies covered
            • 12.2 Market positioning of companies
              • Matrix on companies position and classification
            • 12.3 Apex Dynamics Inc.
              • Apex Dynamics Inc. - Overview
              • Apex Dynamics Inc. - Product / Service
              • Apex Dynamics Inc. - Key offerings
            • 12.4 ATLANTA Antriebssysteme GmbH
              • ATLANTA Antriebssysteme GmbH - Overview
              • ATLANTA Antriebssysteme GmbH - Product / Service
              • ATLANTA Antriebssysteme GmbH - Key offerings
            • 12.5 B and B Manufacturing Inc.
              • B and B Manufacturing Inc. - Overview
              • B and B Manufacturing Inc. - Product / Service
              • B and B Manufacturing Inc. - Key offerings
            • 12.6 Commercial Gear and Sprocket Co. Inc.
              • Commercial Gear and Sprocket Co. Inc. - Overview
              • Commercial Gear and Sprocket Co. Inc. - Product / Service
              • Commercial Gear and Sprocket Co. Inc. - Key offerings
            • 12.7 GAM Enterprises Inc.
              • GAM Enterprises Inc. - Overview
              • GAM Enterprises Inc. - Product / Service
              • GAM Enterprises Inc. - Key offerings
            • 12.8 Gudel Group AG
              • Gudel Group AG - Overview
              • Gudel Group AG - Product / Service
              • Gudel Group AG - Key offerings
            • 12.9 HMK Automation Group Ltd.
              • HMK Automation Group Ltd. - Overview
              • HMK Automation Group Ltd. - Product / Service
              • HMK Automation Group Ltd. - Key offerings
            • 12.10 Kohara Gear Industry Co. Ltd.
              • Kohara Gear Industry Co. Ltd. - Overview
              • Kohara Gear Industry Co. Ltd. - Product / Service
              • Kohara Gear Industry Co. Ltd. - Key offerings
            • 12.11 Lomar Machine and Tool Co.
              • Lomar Machine and Tool Co. - Overview
              • Lomar Machine and Tool Co. - Product / Service
              • Lomar Machine and Tool Co. - Key offerings
            • 12.12 MIJNO PRECISION GEARING SAS
              • MIJNO PRECISION GEARING SAS - Overview
              • MIJNO PRECISION GEARING SAS - Product / Service
              • MIJNO PRECISION GEARING SAS - Key offerings
            • 12.13 Nexen Group Inc.
              • Nexen Group Inc. - Overview
              • Nexen Group Inc. - Product / Service
              • Nexen Group Inc. - Key offerings
            • 12.14 Nidec Corp.
              • Nidec Corp. - Overview
              • Nidec Corp. - Business segments
              • Nidec Corp. - Key offerings
              • Nidec Corp. - Segment focus
            • 12.15 REDEX Group
              • REDEX Group - Overview
              • REDEX Group - Product / Service
              • REDEX Group - Key offerings
            • 12.16 Reliance Precision Ltd.
              • Reliance Precision Ltd. - Overview
              • Reliance Precision Ltd. - Product / Service
              • Reliance Precision Ltd. - Key offerings
            • 12.17 Sati SpA
              • Sati SpA - Overview
              • Sati SpA - Product / Service
              • Sati SpA - Key offerings

            13 Appendix

            • 13.1 Scope of the report
              • 13.2 Inclusions and exclusions checklist
                • Inclusions checklist
                • Exclusions checklist
              • 13.3 Currency conversion rates for US$
                • Currency conversion rates for US$
              • 13.4 Research methodology
                • Research methodology
              • 13.5 Data procurement
                • Information sources
              • 13.6 Data validation
                • Data validation
              • 13.7 Validation techniques employed for market sizing
                • Validation techniques employed for market sizing
              • 13.8 Data synthesis
                • Data synthesis
              • 13.9 360 degree market analysis
                • 360 degree market analysis
              • 13.10 List of abbreviations
                • List of abbreviations

              Research Methodology

              Technavio presents a detailed picture of the market by way of study, synthesis, and summation of data from multiple sources. The analysts have presented the various facets of the market with a particular focus on identifying the key industry influencers. The data thus presented is comprehensive, reliable, and the result of extensive research, both primary and secondary.

              INFORMATION SOURCES

              Primary sources

              • Manufacturers and suppliers
              • Channel partners
              • Industry experts
              • Strategic decision makers

              Secondary sources

              • Industry journals and periodicals
              • Government data
              • Financial reports of key industry players
              • Historical data
              • Press releases

              DATA ANALYSIS

              Data Synthesis

              • Collation of data
              • Estimation of key figures
              • Analysis of derived insights

              Data Validation

              • Triangulation with data models
              • Reference against proprietary databases
              • Corroboration with industry experts

              REPORT WRITING

              Qualitative

              • Market drivers
              • Market challenges
              • Market trends
              • Five forces analysis

              Quantitative

              • Market size and forecast
              • Market segmentation
              • Geographical insights
              • Competitive landscape

              Interested in this report?

              Get your sample now to see our research methodology and insights!

              Download Now

              Frequently Asked Questions

              Industrial Rack And Pinion market growth will increase by $ 998.6 mn during 2024-2028 .

              The Industrial Rack And Pinion market is expected to grow at a CAGR of 9.45% during 2024-2028 .

              Industrial Rack And Pinion market is segmented by Product( Machine tools, Linear actuation and guideways, Material handling) Type( Alloy steel, Carbon steel, Stainless steel, Aluminum alloy, Plastic)

              Apex Dynamics Inc., ATLANTA Antriebssysteme GmbH, B and B Manufacturing Inc., Commercial Gear and Sprocket Co. Inc., GAM Enterprises Inc., Gudel Group AG, HMK Automation Group Ltd., Kohara Gear Industry Co. Ltd., Lomar Machine and Tool Co., MIJNO PRECISION GEARING SAS, Nexen Group Inc., Nidec Corp., P R Components Pvt. Ltd., Pearl Engineers, REDEX Group, Reliance Precision Ltd., Sati SpA, Shri Butbhavani Engineering, Statewide Bearings, Yuan Yi Chang Machinery Co. Ltd. are a few of the key vendors in the Industrial Rack And Pinion market.

              APAC will register the highest growth rate of 41% among the other regions. Therefore, the Industrial Rack And Pinion market in APAC is expected to garner significant business opportunities for the vendors during the forecast period.

              China, US, Germany, India, Canada

              • Growth of industrial manufacturing leading to increase in demand for machine toolsIndustrial manufacturing is the driving factor this market.
              • especially discrete manufacturing is the driving factor this market.
              • requires several machining activities such as cutting is the driving factor this market.
              • milling is the driving factor this market.
              • drilling is the driving factor this market.
              • and boring to be performed on a range of metal is the driving factor this market.
              • wood is the driving factor this market.
              • or plastic components. These operations are performed using manual or automatic machine tools. Objects that require machining is the driving factor this market.
              • tool posts or carriages need to be moved in a linear direction. However is the driving factor this market.
              • usually is the driving factor this market.
              • torque is applied either manually by a handwheel or by an electric motor. A rack and pinion assembly is one of the linear actuation mechanisms that are used in machine tools to convert rotary motion into linear motion. Thus is the driving factor this market.
              • as the unit sales of machine tools increase is the driving factor this market.
              • the demand for rack and pinion assemblies for machine tool applications also increases.The growing production of large machinery for building and construction is the driving factor this market.
              • coupled with an uptick in infrastructure development projects is the driving factor this market.
              • is anticipated to expand opportunities within the industrial gears sector. In a recent development is the driving factor this market.
              • Mammoet is the driving factor this market.
              • a prominent provider of heavy lifting solutions is the driving factor this market.
              • has committed to constructing the world's largest ring crane boasting a capacity of 6 is the driving factor this market.
              • 000 tons. The delivery of this colossal crane is slated for 2024. This investment underscores the industry's response to escalating demands for heavy-duty equipment to support ambitious construction endeavors globally.Furthermore is the driving factor this market.
              • the global demand for aerospace and defense equipment continues to grow. The demand for civilian aircraft is increasing rapidly in developing countries due to the consistent increase in air passenger traffic is the driving factor this market.
              • improved air connectivity is the driving factor this market.
              • and increasing passenger load factor. Moreover is the driving factor this market.
              • the demand for natural gas is increasing in power generation is the driving factor this market.
              • industrial furnaces is the driving factor this market.
              • petrochemical production is the driving factor this market.
              • as well as commercial and residential building heating applications. This is driving investments in natural gas processing plants is the driving factor this market.
              • petrochemicals complexes is the driving factor this market.
              • and supply and distribution networks. This is increasing the demand for industrial machinery is the driving factor this market.
              • such as turbines is the driving factor this market.
              • compressors is the driving factor this market.
              • engines is the driving factor this market.
              • motors is the driving factor this market.
              • and pumps.  Thus is the driving factor this market.
              • the growth of industrial manufacturing leading to increase in demand for machine tools fosters the growth of the global industrial rack and pinion market during the forecast period. is the driving factor this market.

              The Industrial Rack And Pinion market vendors should focus on grabbing business opportunities from the Machine tools segment as it accounted for the largest market share in the base year.