Inotropic Agents Market Analysis, Size, and Forecast 2025-2029: North America (US, Canada, and Mexico), Europe (Germany, UK, and France), APAC (China, Japan, and India), South America (Brazil), Middle East and Africa (Turkey, Saudi Arabia, and South Africa), Asia, Rest of World (ROW)

Inotropic Agents Market Analysis, Size, and Forecast 2025-2029:
North America (US, Canada, and Mexico), Europe (Germany, UK, and France), APAC (China, Japan, and India), South America (Brazil), Middle East and Africa (Turkey, Saudi Arabia, and South Africa), Asia, Rest of World (ROW)

Published: Dec 2025 303 Pages SKU: IRTNTR81147

Market Overview at a Glance

$1.96 B
Market Opportunity
12%
CAGR 2024 - 2029
39.6%
North America Growth
$1.49 B
Parenteral segment 2023

Inotropic Agents Market Size 2025-2029

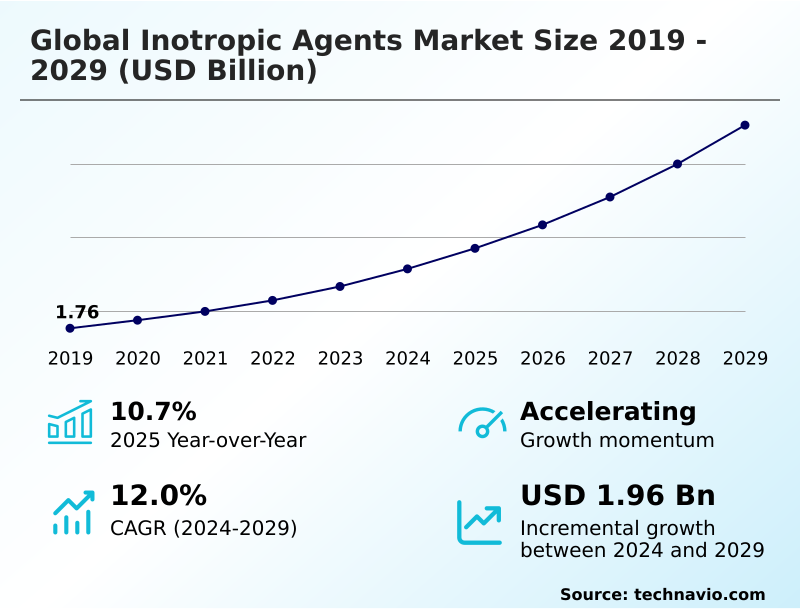
The inotropic agents market size is valued to increase by USD 1.96 billion, at a CAGR of 12% from 2024 to 2029. Increasing prevalence of cardiovascular diseases will drive the inotropic agents market.

Major Market Trends & Insights

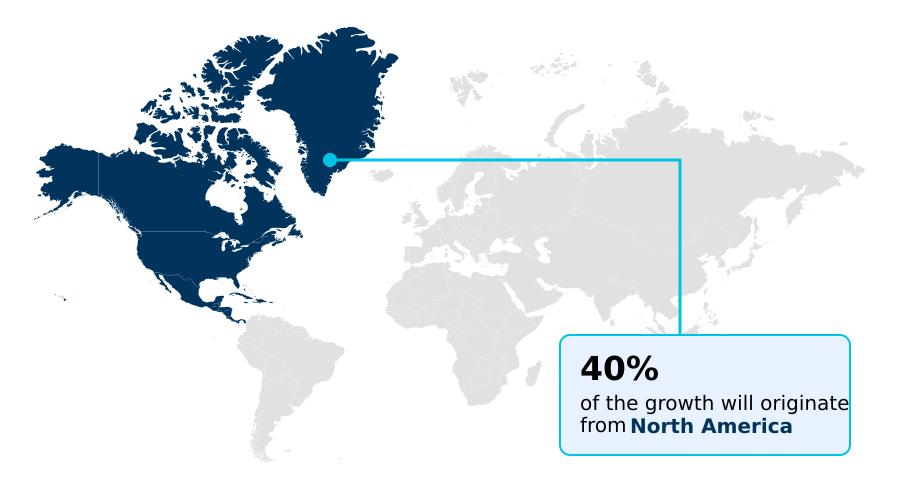
  • North America dominated the market and accounted for a 39.6% growth during the forecast period.
  • By Route of Administration - Parenteral segment was valued at USD 1.49 billion in 2023
  • By Type - Positive inotropic drugs segment accounted for the largest market revenue share in 2023

Market Size & Forecast

  • Market Opportunities: USD 2.77 billion
  • Market Future Opportunities: USD 1.96 billion
  • CAGR from 2024 to 2029 : 12%

Market Summary

  • The inotropic agents market is shaped by the pressing need for effective therapies to manage cardiac contractility in patients with cardiovascular diseases. The market is primarily driven by the increasing prevalence of heart failure and an aging global population, which expands the patient base requiring hemodynamic support.
  • These agents are crucial in both acute settings, for conditions like cardiogenic shock management, and in chronic care. However, the use of traditional positive inotropic drugs and phosphodiesterase inhibitors is often limited by safety concerns, such as increased myocardial oxygen consumption and the risk of ventricular arrhythmias.
  • This has spurred a significant trend toward developing novel oral inotropes and cardiac myosin activators with more favorable safety profiles. For instance, a hospital system could implement a protocol for transitioning patients from parenteral inotropes to a new oral agent, aiming to reduce readmission rates and the overall cost of care.
  • This shift toward safer, long-term solutions, including outpatient inotropic therapy, is a key dynamic, balanced against competition from non-pharmacological interventions like mechanical circulatory support.

What will be the Size of the Inotropic Agents Market during the forecast period?

Get Key Insights on Market Forecast (PDF) Request Free Sample

How is the Inotropic Agents Market Segmented?

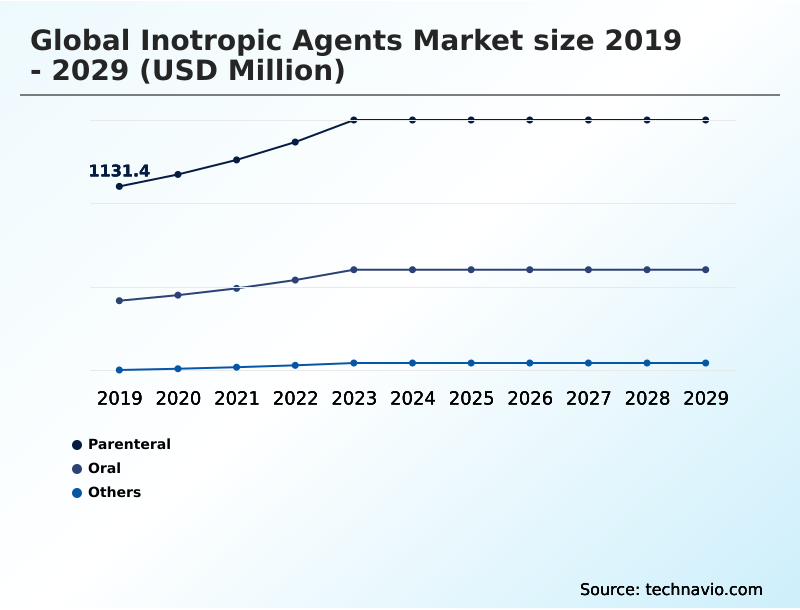
The inotropic agents industry research report provides comprehensive data (region-wise segment analysis), with forecasts and estimates in "USD million" for the period 2025-2029, as well as historical data from 2019-2023 for the following segments.

  • Route of administration
    • Parenteral
    • Oral
    • Others
  • Type
    • Positive inotropic drugs
    • Negative inotropic drugs
    • Others
  • End-user
    • Hospitals
    • Homecare
    • Specialty centers
    • Others
  • Geography
    • North America
      • US
      • Canada
      • Mexico
    • Europe
      • Germany
      • UK
      • France
    • Asia
    • Rest of World (ROW)

By Route of Administration Insights

The parenteral segment is estimated to witness significant growth during the forecast period.

The parenteral route of administration is central to acute and critical care, where intravenous delivery of parenteral inotropes is indispensable for managing life-threatening conditions.

This method allows for immediate hemodynamic support in cases of cardiogenic shock management and acute decompensated heart failure, where rapid onset and precise dose titration are critical.

Evidence-based treatment protocols guide the use of these potent agents to augment cardiac function while navigating the risk of ventricular arrhythmias.

The clinical necessity for immediate intervention ensures this segment's dominance, with ongoing research focused on novel compounds that offer safer profiles.

For instance, new agents are being developed to improve cardiac efficiency, increasing pumping function by over 15% without a corresponding surge in oxygen demand. This innovation is critical for achieving regulatory approval for cardiovascular drugs in a cautious market.

Request Free Sample

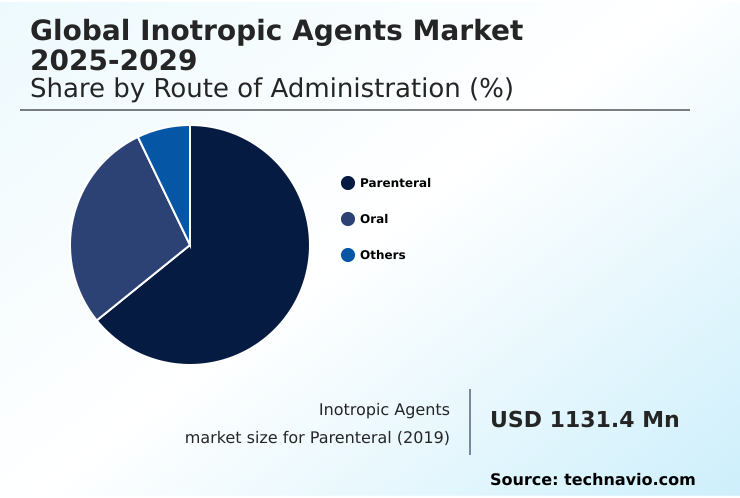
The Parenteral segment was valued at USD 1.49 billion in 2023 and showed a gradual increase during the forecast period.

Request Free Sample

Regional Analysis

North America is estimated to contribute 39.6% to the growth of the global market during the forecast period.Technavio’s analysts have elaborately explained the regional trends and drivers that shape the market during the forecast period.

See How Inotropic Agents Market Demand is Rising in North America Request Free Sample

The geographic landscape of the inotropic agents market is dominated by North America, which accounts for over 39% of the market's incremental growth, driven by high healthcare spending and a sophisticated research ecosystem.

The region's focus is on developing therapies for conditions like hypertrophic cardiomyopathy and improving long-term cardiovascular outcomes. Meanwhile, APAC is the fastest-growing region, fueled by an increasing prevalence of cardiovascular disease and modernizing healthcare infrastructure.

This growth is creating a significant need for effective management of cardiac contractility. In Europe, the market is mature, with a strong emphasis on personalized heart failure management and adherence to stringent clinical trial endpoints for heart failure.

The development of drug-device combination products and subcutaneous infusion systems is a global trend, with neurohormonal antagonists forming a key part of treatment regimens worldwide.

Market Dynamics

Our researchers analyzed the data with 2024 as the base year, along with the key drivers, trends, and challenges. A holistic analysis of drivers will help companies refine their marketing strategies to gain a competitive advantage.

  • A critical consideration in the inotropic agents market is the evaluation of safety profiles of novel inotropic agents. Clinicians and healthcare providers must weigh the benefits of new therapies against the potential for adverse events, such as managing arrhythmias from inotropic drugs.
  • This is particularly relevant when comparing the role of inotropic agents versus mechanical circulatory support, where the latter may offer better long-term outcomes for specific patient populations despite higher initial costs.
  • The development of oral inotropes for chronic heart failure aims to shift the treatment paradigm, potentially reducing the high cost of long-term inotropic therapy, which is often administered in inpatient or specialized homecare settings. For pharmaceutical companies, the challenge is not only demonstrating efficacy but also proving cost-effectiveness to secure favorable reimbursement and market access.
  • Strategies focused on reducing mortality with combination therapies are gaining traction, as they can lead to better overall patient outcomes and a stronger value proposition. From a supply chain perspective, a successful oral agent could reduce the logistical complexity associated with infusion therapies by a significant margin, streamlining distribution and patient management.

What are the key market drivers leading to the rise in the adoption of Inotropic Agents Industry?

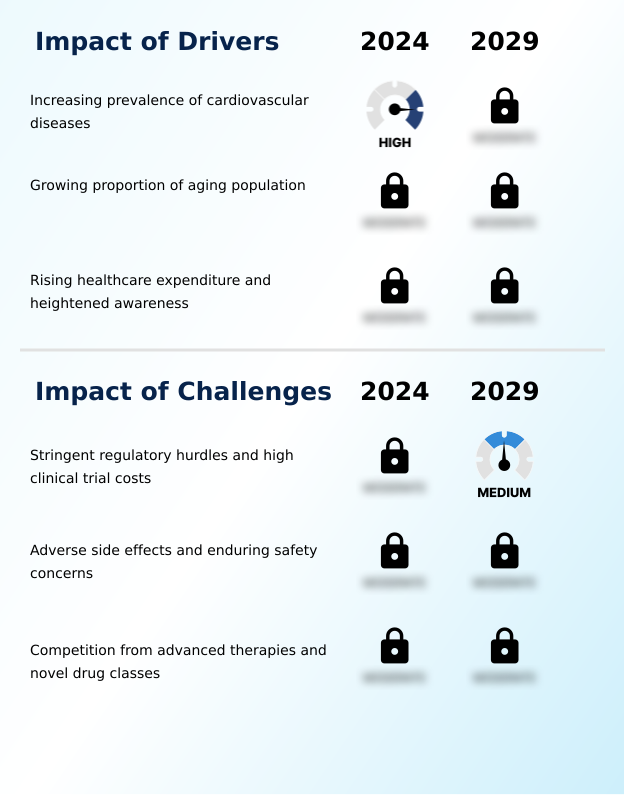
  • The increasing prevalence of cardiovascular diseases, particularly heart failure, is a key driver for the inotropic agents market.

  • The inotropic agents market is primarily driven by the increasing global prevalence of cardiovascular diseases, especially heart failure.
  • The number of Americans with heart failure is projected to increase to 8.7 million by 2030, creating sustained demand for advanced heart failure treatment.
  • This is compounded by a growing aging population, which is more susceptible to conditions requiring cardiac support. Increased healthcare expenditure worldwide is improving access to therapies, including positive inotropic drugs and cardiac glycosides.
  • The growing awareness and proactive management of heart failure, supported by the integration of sodium-glucose cotransporter-2 inhibitors and angiotensin receptor-neprilysin inhibitors, are expanding the number of patients under active care.
  • This creates opportunities for both acute interventions and long-term palliative care for heart failure, aligning with a push toward patient-centered cardiac care.

What are the market trends shaping the Inotropic Agents Industry?

  • A paradigm shift toward novel inotropic agents with improved safety profiles is a key market trend. This is driven by the clinical need to mitigate adverse effects associated with traditional therapies.

  • The inotropic agents market is trending toward innovation focused on improving safety and patient convenience. There is a significant push to develop novel agents like cardiac myosin activators and calcium sensitizers that provide therapeutic benefits without the adverse effects of older drugs. This includes the development of ino-lusitropic agents and SERCA2a stimulators, which offer more targeted mechanisms.
  • For instance, optimized combination therapy for heart failure has been shown to reduce mortality risk by up to 60%. Another major trend is the shift toward outpatient inotropic therapy and home-based inotropic infusion, facilitated by advanced portable pump technology. This approach improves quality of life and reduces healthcare costs.
  • The development of effective oral inotropes remains a key goal, aiming to provide a convenient long-term management option for chronic heart failure patients.

What challenges does the Inotropic Agents Industry face during its growth?

  • Stringent regulatory hurdles and the high costs associated with clinical trials present a key challenge affecting industry growth.

  • Significant challenges restrain the inotropic agents market, led by stringent regulatory requirements and the high cost of clinical development. The risk-benefit profile assessment for new cardiovascular drugs is rigorous, a legacy of safety concerns with traditional agents like phosphodiesterase inhibitors, which can increase myocardial oxygen consumption. This clinical conservatism creates a high barrier for new entrants.
  • For example, thorough pharmacovigilance of cardiovascular drugs is standard practice. Furthermore, there is strong competition from alternative treatments. Advanced mechanical circulatory support, such as left ventricular assist devices, now shows a five-year survival rate of nearly 60% in some trials, presenting a viable alternative to long-term drug therapy.
  • The high cost-effectiveness of cardiac therapies is a major consideration for payers, adding another layer of complexity to market access for new, expensive negative inotropic drugs and other agents.

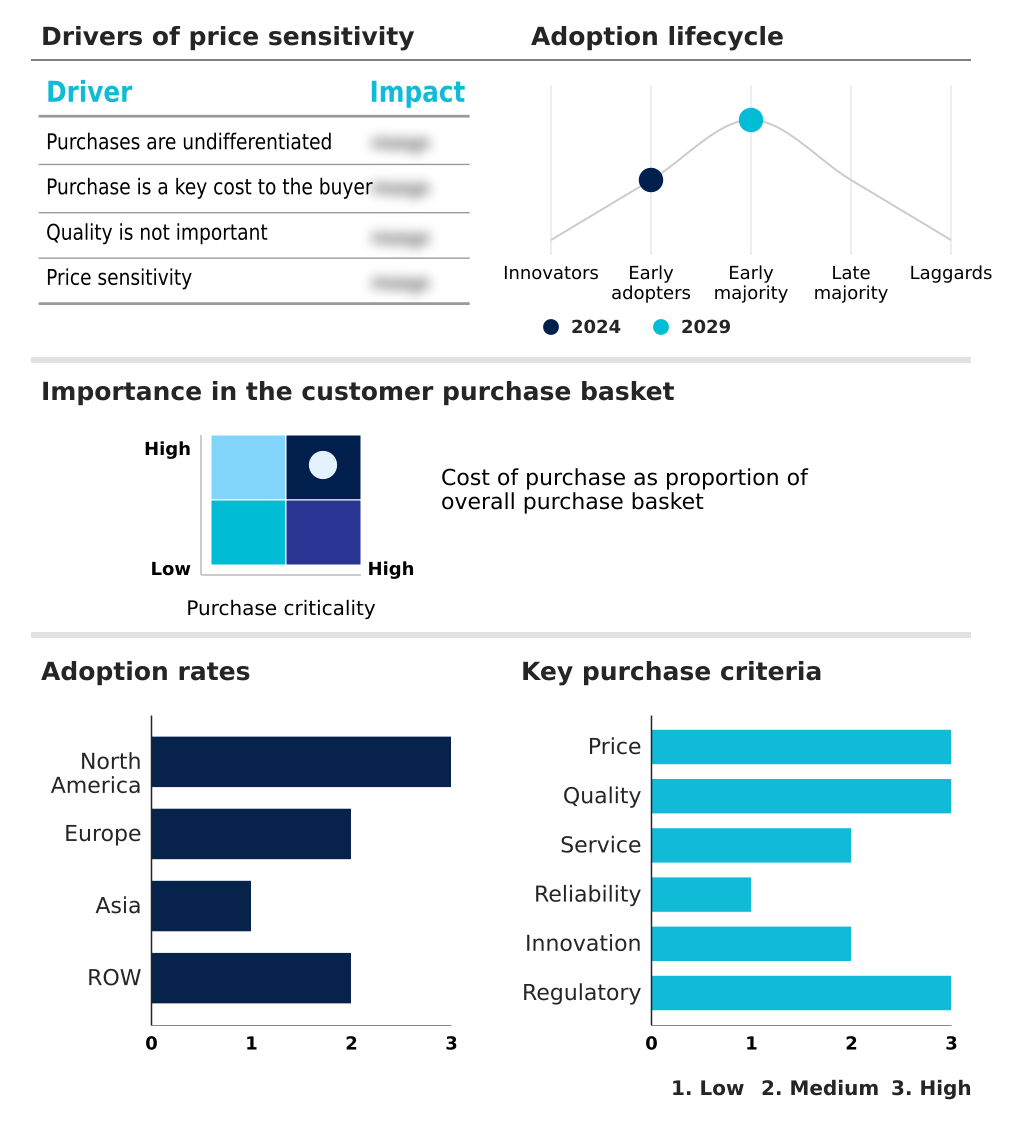
Exclusive Technavio Analysis on Customer Landscape

The inotropic agents market forecasting report includes the adoption lifecycle of the market, covering from the innovator’s stage to the laggard’s stage. It focuses on adoption rates in different regions based on penetration. Furthermore, the inotropic agents market report also includes key purchase criteria and drivers of price sensitivity to help companies evaluate and develop their market growth analysis strategies.

Customer Landscape of Inotropic Agents Industry

Competitive Landscape

Companies are implementing various strategies, such as strategic alliances, inotropic agents market forecast, partnerships, mergers and acquisitions, geographical expansion, and product/service launches, to enhance their presence in the industry.

AbbVie Inc. - Provides formulations to enhance cardiac output and manage hemodynamic instability in severe heart failure, addressing critical care needs.

The industry research and growth report includes detailed analyses of the competitive landscape of the market and information about key companies, including:

  • AbbVie Inc.
  • Amgen Inc.
  • AstraZeneca Plc
  • Aurobindo Pharma Ltd.
  • Baxter International Inc.
  • Bayer AG
  • Boehringer Ingelheim GmbH
  • Bristol Myers Squibb Co.
  • Cadila Pharmaceuticals Ltd.
  • Cipla Inc.
  • Eli Lilly and Co.
  • GlaxoSmithKline Plc
  • Hikma Pharmaceuticals Plc
  • Johnson and Johnson Services
  • Lupin Ltd.
  • Merck and Co. Inc.
  • Novartis AG
  • Pfizer Inc.
  • Sanofi SA
  • Viatris Inc.

Qualitative and quantitative analysis of companies has been conducted to help clients understand the wider business environment as well as the strengths and weaknesses of key industry players. Data is qualitatively analyzed to categorize companies as pure play, category-focused, industry-focused, and diversified; it is quantitatively analyzed to categorize companies as dominant, leading, strong, tentative, and weak.

Recent Development and News in Inotropic agents market

  • In August 2024, Eli Lilly and Co. announced that its drug tirzepatide significantly reduced the risk of worsening heart failure events in adults with heart failure with preserved ejection fraction and obesity.
  • In August 2024, Novo Nordisk announced the withdrawal of its FDA filing for Wegovy for heart failure, with plans to resubmit in early 2025 with additional data to support its application.
  • In August 2024, Cytokinetics announced its plan to submit a New Drug Application to the FDA for aficamten for symptomatic obstructive hypertrophic cardiomyopathy in the fourth quarter of 2024, following positive trial results.
  • In November 2024, the Food and Drug Administration approved BridgeBio Pharma's acoramidis for the treatment of transthyretin amyloid cardiomyopathy, a progressive and fatal heart disease.

Dive into Technavio’s robust research methodology, blending expert interviews, extensive data synthesis, and validated models for unparalleled Inotropic Agents Market insights. See full methodology.

Market Scope
Page number 303
Base year 2024
Historic period 2019-2023
Forecast period 2025-2029
Growth momentum & CAGR Accelerate at a CAGR of 12%
Market growth 2025-2029 USD 1961.6 million
Market structure Fragmented
YoY growth 2024-2025(%) 10.7%
Key countries US, Canada, Mexico, Germany, UK, France, Russia, Italy, Spain, The Netherlands, China, Japan, India, South Korea, Singapore, Thailand, Indonesia, Brazil, Turkey, Saudi Arabia, South Africa, Australia and UAE
Competitive landscape Leading Companies, Market Positioning of Companies, Competitive Strategies, and Industry Risks

Request Free Sample

Research Analyst Overview

  • The inotropic agents market is undergoing a significant transformation, moving beyond traditional catecholamines and cardiac glycosides. A key boardroom focus is the strategic investment in novel compounds like cardiac myosin activators and SERCA2a stimulators, which promise enhanced cardiac contractility with lower myocardial oxygen consumption.
  • The development of these next-generation parenteral inotropes and oral inotropes is critical, as they aim to provide effective hemodynamic support while minimizing the risk of ventricular arrhythmias. This shift addresses the historical limitations of phosphodiesterase inhibitors and older positive inotropic drugs.
  • For instance, clinical trials for ino-lusitropic agents are demonstrating the potential to improve both systolic and diastolic function, a dual benefit that could reduce rehospitalization rates for acute decompensated heart failure by over 20%. The market is also seeing targeted therapies for specific conditions like hypertrophic cardiomyopathy and heart failure with preserved ejection fraction.
  • The integration of these agents with foundational therapies, including sodium-glucose cotransporter-2 inhibitors, angiotensin receptor-neprilysin inhibitors, and neurohormonal antagonists, is redefining a complex treatment landscape shaped by competition from mechanical circulatory support and negative inotropic drugs.

What are the Key Data Covered in this Inotropic Agents Market Research and Growth Report?

  • What is the expected growth of the Inotropic Agents Market between 2025 and 2029?

    • USD 1.96 billion, at a CAGR of 12%

  • What segmentation does the market report cover?

    • The report is segmented by Route of Administration (Parenteral, Oral, and Others), Type (Positive inotropic drugs, Negative inotropic drugs, and Others), End-user (Hospitals, Homecare, Specialty centers, and Others) and Geography (North America, Europe, Asia, Rest of World (ROW))

  • Which regions are analyzed in the report?

    • North America, Europe, Asia and Rest of World (ROW)

  • What are the key growth drivers and market challenges?

    • Increasing prevalence of cardiovascular diseases, Stringent regulatory hurdles and high clinical trial costs

  • Who are the major players in the Inotropic Agents Market?

    • AbbVie Inc., Amgen Inc., AstraZeneca Plc, Aurobindo Pharma Ltd., Baxter International Inc., Bayer AG, Boehringer Ingelheim GmbH, Bristol Myers Squibb Co., Cadila Pharmaceuticals Ltd., Cipla Inc., Eli Lilly and Co., GlaxoSmithKline Plc, Hikma Pharmaceuticals Plc, Johnson and Johnson Services, Lupin Ltd., Merck and Co. Inc., Novartis AG, Pfizer Inc., Sanofi SA and Viatris Inc.

Market Research Insights

  • The inotropic agents market is shaped by a complex interplay of clinical needs and therapeutic advancements. While the rising incidence of heart failure drives demand, the adoption of new treatments is influenced by their demonstrated value.
  • For example, optimized combination therapy for heart failure has been shown to reduce mortality risk by up to 60%, creating a high benchmark for new entrants. Furthermore, advanced heart failure treatment is shifting, with some mechanical circulatory support devices showing a five-year survival rate of nearly 60%, rivaling heart transplantation outcomes.
  • This competition pushes the focus toward patient-centered cardiac care and the cost-effectiveness of cardiac therapies, especially for palliative care for heart failure. The development of subcutaneous infusion systems and drug-device combination products reflects a move toward improving quality of life and facilitating home-based inotropic infusion, aligning with modern healthcare's value-based objectives.

We can help! Our analysts can customize this inotropic agents market research report to meet your requirements.

Get in touch

1. Executive Summary

1.1 Market overview

Executive Summary - Chart on Market Overview
Executive Summary - Data Table on Market Overview
Executive Summary - Chart on Global Market Characteristics
Executive Summary - Chart on Market by Geography
Executive Summary - Chart on Market Segmentation by Route of Administration
Executive Summary - Chart on Market Segmentation by Type
Executive Summary - Chart on Market Segmentation by End-user
Executive Summary - Chart on Incremental Growth
Executive Summary - Data Table on Incremental Growth
Executive Summary - Chart on Company Market Positioning

2. Technavio Analysis

2.1 Analysis of price sensitivity, lifecycle, customer purchase basket, adoption rates, and purchase criteria

2.2 Criticality of inputs and Factors of differentiation

Chart on Overview on criticality of inputs and factors of differentiation

2.3 Factors of disruption

Chart on Overview on factors of disruption

2.4 Impact of drivers and challenges

Chart on Impact of drivers and challenges in 2024 and 2029

3. Market Landscape

3.1 Market ecosystem

Chart on Parent Market
Data Table on - Parent Market

3.2 Market characteristics

Chart on Market characteristics analysis

3.3 Value chain analysis

Chart on Value chain analysis

4. Market Sizing

4.1 Market definition

Data Table on Offerings of companies included in the market definition

4.2 Market segment analysis

Market segments

4.3 Market size 2024

4.4 Market outlook: Forecast for 2024-2029

Chart on Global - Market size and forecast 2024-2029 ($ million)
Data Table on Global - Market size and forecast 2024-2029 ($ million)
Chart on Global Market: Year-over-year growth 2024-2029 (%)
Data Table on Global Market: Year-over-year growth 2024-2029 (%)

5. Historic Market Size

5.1 Global Inotropic Agents Market 2019 - 2023

Historic Market Size - Data Table on Global Inotropic Agents Market 2019 - 2023 ($ million)

5.2 Route of Administration segment analysis 2019 - 2023

Historic Market Size - Route of Administration Segment 2019 - 2023 ($ million)

5.3 Type segment analysis 2019 - 2023

Historic Market Size - Type Segment 2019 - 2023 ($ million)

5.4 End-user segment analysis 2019 - 2023

Historic Market Size - End-user Segment 2019 - 2023 ($ million)

5.5 Geography segment analysis 2019 - 2023

Historic Market Size - Geography Segment 2019 - 2023 ($ million)

5.6 Country segment analysis 2019 - 2023

Historic Market Size - Country Segment 2019 - 2023 ($ million)

6. Qualitative Analysis

6.1 Impact of AI in global inotropic agents market

7. Five Forces Analysis

7.1 Five forces summary

Five forces analysis - Comparison between 2024 and 2029

7.2 Bargaining power of buyers

Bargaining power of buyers - Impact of key factors 2024 and 2029

7.3 Bargaining power of suppliers

Bargaining power of suppliers - Impact of key factors in 2024 and 2029

7.4 Threat of new entrants

Threat of new entrants - Impact of key factors in 2024 and 2029

7.5 Threat of substitutes

Threat of substitutes - Impact of key factors in 2024 and 2029

7.6 Threat of rivalry

Threat of rivalry - Impact of key factors in 2024 and 2029

7.7 Market condition

Chart on Market condition - Five forces 2024 and 2029

8. Market Segmentation by Route of Administration

8.1 Market segments

Chart on Route of Administration - Market share 2024-2029 (%)
Data Table on Route of Administration - Market share 2024-2029 (%)

8.2 Comparison by Route of Administration

Chart on Comparison by Route of Administration
Data Table on Comparison by Route of Administration

8.3 Parenteral - Market size and forecast 2024-2029

Chart on Parenteral - Market size and forecast 2024-2029 ($ million)
Data Table on Parenteral - Market size and forecast 2024-2029 ($ million)
Chart on Parenteral - Year-over-year growth 2024-2029 (%)
Data Table on Parenteral - Year-over-year growth 2024-2029 (%)

8.4 Oral - Market size and forecast 2024-2029

Chart on Oral - Market size and forecast 2024-2029 ($ million)
Data Table on Oral - Market size and forecast 2024-2029 ($ million)
Chart on Oral - Year-over-year growth 2024-2029 (%)
Data Table on Oral - Year-over-year growth 2024-2029 (%)

8.5 Others - Market size and forecast 2024-2029

Chart on Others - Market size and forecast 2024-2029 ($ million)
Data Table on Others - Market size and forecast 2024-2029 ($ million)
Chart on Others - Year-over-year growth 2024-2029 (%)
Data Table on Others - Year-over-year growth 2024-2029 (%)

8.6 Market opportunity by Route of Administration

Market opportunity by Route of Administration ($ million)
Data Table on Market opportunity by Route of Administration ($ million)

9. Market Segmentation by Type

9.1 Market segments

Chart on Type - Market share 2024-2029 (%)
Data Table on Type - Market share 2024-2029 (%)

9.2 Comparison by Type

Chart on Comparison by Type
Data Table on Comparison by Type

9.3 Positive inotropic drugs - Market size and forecast 2024-2029

Chart on Positive inotropic drugs - Market size and forecast 2024-2029 ($ million)
Data Table on Positive inotropic drugs - Market size and forecast 2024-2029 ($ million)
Chart on Positive inotropic drugs - Year-over-year growth 2024-2029 (%)
Data Table on Positive inotropic drugs - Year-over-year growth 2024-2029 (%)

9.4 Negative inotropic drugs - Market size and forecast 2024-2029

Chart on Negative inotropic drugs - Market size and forecast 2024-2029 ($ million)
Data Table on Negative inotropic drugs - Market size and forecast 2024-2029 ($ million)
Chart on Negative inotropic drugs - Year-over-year growth 2024-2029 (%)
Data Table on Negative inotropic drugs - Year-over-year growth 2024-2029 (%)

9.5 Others - Market size and forecast 2024-2029

Chart on Others - Market size and forecast 2024-2029 ($ million)
Data Table on Others - Market size and forecast 2024-2029 ($ million)
Chart on Others - Year-over-year growth 2024-2029 (%)
Data Table on Others - Year-over-year growth 2024-2029 (%)

9.6 Market opportunity by Type

Market opportunity by Type ($ million)
Data Table on Market opportunity by Type ($ million)

10. Market Segmentation by End-user

10.1 Market segments

Chart on End-user - Market share 2024-2029 (%)
Data Table on End-user - Market share 2024-2029 (%)

10.2 Comparison by End-user

Chart on Comparison by End-user
Data Table on Comparison by End-user

10.3 Hospitals - Market size and forecast 2024-2029

Chart on Hospitals - Market size and forecast 2024-2029 ($ million)
Data Table on Hospitals - Market size and forecast 2024-2029 ($ million)
Chart on Hospitals - Year-over-year growth 2024-2029 (%)
Data Table on Hospitals - Year-over-year growth 2024-2029 (%)

10.4 Homecare - Market size and forecast 2024-2029

Chart on Homecare - Market size and forecast 2024-2029 ($ million)
Data Table on Homecare - Market size and forecast 2024-2029 ($ million)
Chart on Homecare - Year-over-year growth 2024-2029 (%)
Data Table on Homecare - Year-over-year growth 2024-2029 (%)

10.5 Specialty centers - Market size and forecast 2024-2029

Chart on Specialty centers - Market size and forecast 2024-2029 ($ million)
Data Table on Specialty centers - Market size and forecast 2024-2029 ($ million)
Chart on Specialty centers - Year-over-year growth 2024-2029 (%)
Data Table on Specialty centers - Year-over-year growth 2024-2029 (%)

10.6 Others - Market size and forecast 2024-2029

Chart on Others - Market size and forecast 2024-2029 ($ million)
Data Table on Others - Market size and forecast 2024-2029 ($ million)
Chart on Others - Year-over-year growth 2024-2029 (%)
Data Table on Others - Year-over-year growth 2024-2029 (%)

10.7 Market opportunity by End-user

Market opportunity by End-user ($ million)
Data Table on Market opportunity by End-user ($ million)

11. Customer Landscape

11.1 Customer landscape overview

Analysis of price sensitivity, lifecycle, customer purchase basket, adoption rates, and purchase criteria

12. Geographic Landscape

12.1 Geographic segmentation

Chart on Market share by geography 2024-2029 (%)
Data Table on Market share by geography 2024-2029 (%)

12.2 Geographic comparison

Chart on Geographic comparison
Data Table on Geographic comparison

12.3 North America - Market size and forecast 2024-2029

Chart on North America - Market size and forecast 2024-2029 ($ million)
Data Table on North America - Market size and forecast 2024-2029 ($ million)
Chart on North America - Year-over-year growth 2024-2029 (%)
Data Table on North America - Year-over-year growth 2024-2029 (%)
Chart on Regional Comparison - North America
Data Table on Regional Comparison - North America

12.3.1 US - Market size and forecast 2024-2029

Chart on US - Market size and forecast 2024-2029 ($ million)
Data Table on US - Market size and forecast 2024-2029 ($ million)
Chart on US - Year-over-year growth 2024-2029 (%)
Data Table on US - Year-over-year growth 2024-2029 (%)

12.3.2 Canada - Market size and forecast 2024-2029

Chart on Canada - Market size and forecast 2024-2029 ($ million)
Data Table on Canada - Market size and forecast 2024-2029 ($ million)
Chart on Canada - Year-over-year growth 2024-2029 (%)
Data Table on Canada - Year-over-year growth 2024-2029 (%)

12.3.3 Mexico - Market size and forecast 2024-2029

Chart on Mexico - Market size and forecast 2024-2029 ($ million)
Data Table on Mexico - Market size and forecast 2024-2029 ($ million)
Chart on Mexico - Year-over-year growth 2024-2029 (%)
Data Table on Mexico - Year-over-year growth 2024-2029 (%)

12.4 Europe - Market size and forecast 2024-2029

Chart on Europe - Market size and forecast 2024-2029 ($ million)
Data Table on Europe - Market size and forecast 2024-2029 ($ million)
Chart on Europe - Year-over-year growth 2024-2029 (%)
Data Table on Europe - Year-over-year growth 2024-2029 (%)
Chart on Regional Comparison - Europe
Data Table on Regional Comparison - Europe

12.4.1 Germany - Market size and forecast 2024-2029

Chart on Germany - Market size and forecast 2024-2029 ($ million)
Data Table on Germany - Market size and forecast 2024-2029 ($ million)
Chart on Germany - Year-over-year growth 2024-2029 (%)
Data Table on Germany - Year-over-year growth 2024-2029 (%)

12.4.2 UK - Market size and forecast 2024-2029

Chart on UK - Market size and forecast 2024-2029 ($ million)
Data Table on UK - Market size and forecast 2024-2029 ($ million)
Chart on UK - Year-over-year growth 2024-2029 (%)
Data Table on UK - Year-over-year growth 2024-2029 (%)

12.4.3 France - Market size and forecast 2024-2029

Chart on France - Market size and forecast 2024-2029 ($ million)
Data Table on France - Market size and forecast 2024-2029 ($ million)
Chart on France - Year-over-year growth 2024-2029 (%)
Data Table on France - Year-over-year growth 2024-2029 (%)

12.4.4 Russia - Market size and forecast 2024-2029

Chart on Russia - Market size and forecast 2024-2029 ($ million)
Data Table on Russia - Market size and forecast 2024-2029 ($ million)
Chart on Russia - Year-over-year growth 2024-2029 (%)
Data Table on Russia - Year-over-year growth 2024-2029 (%)

12.4.5 Italy - Market size and forecast 2024-2029

Chart on Italy - Market size and forecast 2024-2029 ($ million)
Data Table on Italy - Market size and forecast 2024-2029 ($ million)
Chart on Italy - Year-over-year growth 2024-2029 (%)
Data Table on Italy - Year-over-year growth 2024-2029 (%)

12.4.6 Spain - Market size and forecast 2024-2029

Chart on Spain - Market size and forecast 2024-2029 ($ million)
Data Table on Spain - Market size and forecast 2024-2029 ($ million)
Chart on Spain - Year-over-year growth 2024-2029 (%)
Data Table on Spain - Year-over-year growth 2024-2029 (%)

12.4.7 The Netherlands - Market size and forecast 2024-2029

Chart on The Netherlands - Market size and forecast 2024-2029 ($ million)
Data Table on The Netherlands - Market size and forecast 2024-2029 ($ million)
Chart on The Netherlands - Year-over-year growth 2024-2029 (%)
Data Table on The Netherlands - Year-over-year growth 2024-2029 (%)

12.5 Asia - Market size and forecast 2024-2029

Chart on Asia - Market size and forecast 2024-2029 ($ million)
Data Table on Asia - Market size and forecast 2024-2029 ($ million)
Chart on Asia - Year-over-year growth 2024-2029 (%)
Data Table on Asia - Year-over-year growth 2024-2029 (%)
Chart on Regional Comparison - Asia
Data Table on Regional Comparison - Asia

12.5.1 China - Market size and forecast 2024-2029

Chart on China - Market size and forecast 2024-2029 ($ million)
Data Table on China - Market size and forecast 2024-2029 ($ million)
Chart on China - Year-over-year growth 2024-2029 (%)
Data Table on China - Year-over-year growth 2024-2029 (%)

12.5.2 Japan - Market size and forecast 2024-2029

Chart on Japan - Market size and forecast 2024-2029 ($ million)
Data Table on Japan - Market size and forecast 2024-2029 ($ million)
Chart on Japan - Year-over-year growth 2024-2029 (%)
Data Table on Japan - Year-over-year growth 2024-2029 (%)

12.5.3 India - Market size and forecast 2024-2029

Chart on India - Market size and forecast 2024-2029 ($ million)
Data Table on India - Market size and forecast 2024-2029 ($ million)
Chart on India - Year-over-year growth 2024-2029 (%)
Data Table on India - Year-over-year growth 2024-2029 (%)

12.5.4 South Korea - Market size and forecast 2024-2029

Chart on South Korea - Market size and forecast 2024-2029 ($ million)
Data Table on South Korea - Market size and forecast 2024-2029 ($ million)
Chart on South Korea - Year-over-year growth 2024-2029 (%)
Data Table on South Korea - Year-over-year growth 2024-2029 (%)

12.5.5 Singapore - Market size and forecast 2024-2029

Chart on Singapore - Market size and forecast 2024-2029 ($ million)
Data Table on Singapore - Market size and forecast 2024-2029 ($ million)
Chart on Singapore - Year-over-year growth 2024-2029 (%)
Data Table on Singapore - Year-over-year growth 2024-2029 (%)

12.5.6 Thailand - Market size and forecast 2024-2029

Chart on Thailand - Market size and forecast 2024-2029 ($ million)
Data Table on Thailand - Market size and forecast 2024-2029 ($ million)
Chart on Thailand - Year-over-year growth 2024-2029 (%)
Data Table on Thailand - Year-over-year growth 2024-2029 (%)

12.5.7 Indonesia - Market size and forecast 2024-2029

Chart on Indonesia - Market size and forecast 2024-2029 ($ million)
Data Table on Indonesia - Market size and forecast 2024-2029 ($ million)
Chart on Indonesia - Year-over-year growth 2024-2029 (%)
Data Table on Indonesia - Year-over-year growth 2024-2029 (%)

12.6 Rest of World (ROW) - Market size and forecast 2024-2029

Chart on Rest of World (ROW) - Market size and forecast 2024-2029 ($ million)
Data Table on Rest of World (ROW) - Market size and forecast 2024-2029 ($ million)
Chart on Rest of World (ROW) - Year-over-year growth 2024-2029 (%)
Data Table on Rest of World (ROW) - Year-over-year growth 2024-2029 (%)
Chart on Regional Comparison - Rest of World (ROW)
Data Table on Regional Comparison - Rest of World (ROW)

12.6.1 Brazil - Market size and forecast 2024-2029

Chart on Brazil - Market size and forecast 2024-2029 ($ million)
Data Table on Brazil - Market size and forecast 2024-2029 ($ million)
Chart on Brazil - Year-over-year growth 2024-2029 (%)
Data Table on Brazil - Year-over-year growth 2024-2029 (%)

12.6.2 Turkey - Market size and forecast 2024-2029

Chart on Turkey - Market size and forecast 2024-2029 ($ million)
Data Table on Turkey - Market size and forecast 2024-2029 ($ million)
Chart on Turkey - Year-over-year growth 2024-2029 (%)
Data Table on Turkey - Year-over-year growth 2024-2029 (%)

12.6.3 Saudi Arabia - Market size and forecast 2024-2029

Chart on Saudi Arabia - Market size and forecast 2024-2029 ($ million)
Data Table on Saudi Arabia - Market size and forecast 2024-2029 ($ million)
Chart on Saudi Arabia - Year-over-year growth 2024-2029 (%)
Data Table on Saudi Arabia - Year-over-year growth 2024-2029 (%)

12.6.4 South Africa - Market size and forecast 2024-2029

Chart on South Africa - Market size and forecast 2024-2029 ($ million)
Data Table on South Africa - Market size and forecast 2024-2029 ($ million)
Chart on South Africa - Year-over-year growth 2024-2029 (%)
Data Table on South Africa - Year-over-year growth 2024-2029 (%)

12.6.5 Australia - Market size and forecast 2024-2029

Chart on Australia - Market size and forecast 2024-2029 ($ million)
Data Table on Australia - Market size and forecast 2024-2029 ($ million)
Chart on Australia - Year-over-year growth 2024-2029 (%)
Data Table on Australia - Year-over-year growth 2024-2029 (%)

12.6.6 UAE - Market size and forecast 2024-2029

Chart on UAE - Market size and forecast 2024-2029 ($ million)
Data Table on UAE - Market size and forecast 2024-2029 ($ million)
Chart on UAE - Year-over-year growth 2024-2029 (%)
Data Table on UAE - Year-over-year growth 2024-2029 (%)

12.7 Market opportunity by geography

Market opportunity by geography ($ million)
Data Tables on Market opportunity by geography ($ million)

13. Drivers, Challenges, and Opportunity

13.1 Market drivers

Increasing prevalence of cardiovascular diseases
Growing proportion of aging population
Rising healthcare expenditure and heightened awareness

13.2 Market challenges

Stringent regulatory hurdles and high clinical trial costs
Adverse side effects and enduring safety concerns
Competition from advanced therapies and novel drug classes

13.3 Impact of drivers and challenges

Impact of drivers and challenges in 2024 and 2029

13.4 Market opportunities

Paradigm shift towards novel inotropic agents with improved safety profiles
Increasing adoption of outpatient and home-based inotropic therapy
Strategic implementation of combination therapies

14. Competitive Landscape

14.1 Overview

14.2

Overview on criticality of inputs and factors of differentiation

14.3 Landscape disruption

Overview on factors of disruption

14.4 Industry risks

Impact of key risks on business

15. Competitive Analysis

15.1 Companies profiled

Companies covered

15.2 Company ranking index

15.3 Market positioning of companies

Matrix on companies position and classification

15.4 AbbVie Inc.

AbbVie Inc. - Overview
AbbVie Inc. - Product / Service
AbbVie Inc. - Key news
AbbVie Inc. - Key offerings
SWOT

15.5 Amgen Inc.

Amgen Inc. - Overview
Amgen Inc. - Product / Service
Amgen Inc. - Key news
Amgen Inc. - Key offerings
SWOT

15.6 AstraZeneca Plc

AstraZeneca Plc - Overview
AstraZeneca Plc - Product / Service
AstraZeneca Plc - Key news
AstraZeneca Plc - Key offerings
SWOT

15.7 Baxter International Inc.

Baxter International Inc. - Overview
Baxter International Inc. - Business segments
Baxter International Inc. - Key news
Baxter International Inc. - Key offerings
Baxter International Inc. - Segment focus
SWOT

15.8 Bayer AG

Bayer AG - Overview
Bayer AG - Business segments
Bayer AG - Key news
Bayer AG - Key offerings
Bayer AG - Segment focus
SWOT

15.9 Boehringer Ingelheim GmbH

Boehringer Ingelheim GmbH - Overview
Boehringer Ingelheim GmbH - Product / Service
Boehringer Ingelheim GmbH - Key news
Boehringer Ingelheim GmbH - Key offerings
SWOT

15.10 Bristol Myers Squibb Co.

Bristol Myers Squibb Co. - Overview
Bristol Myers Squibb Co. - Product / Service
Bristol Myers Squibb Co. - Key news
Bristol Myers Squibb Co. - Key offerings
SWOT

15.11 Eli Lilly and Co.

Eli Lilly and Co. - Overview
Eli Lilly and Co. - Product / Service
Eli Lilly and Co. - Key offerings
SWOT

15.12 GlaxoSmithKline Plc

GlaxoSmithKline Plc - Overview
GlaxoSmithKline Plc - Business segments
GlaxoSmithKline Plc - Key news
GlaxoSmithKline Plc - Key offerings
GlaxoSmithKline Plc - Segment focus
SWOT

15.13 Hikma Pharmaceuticals Plc

Hikma Pharmaceuticals Plc - Overview
Hikma Pharmaceuticals Plc - Business segments
Hikma Pharmaceuticals Plc - Key news
Hikma Pharmaceuticals Plc - Key offerings
Hikma Pharmaceuticals Plc - Segment focus
SWOT

15.14 Johnson and Johnson Services

Johnson and Johnson Services - Overview
Johnson and Johnson Services - Business segments
Johnson and Johnson Services - Key news
Johnson and Johnson Services - Key offerings
Johnson and Johnson Services - Segment focus
SWOT

15.15 Merck and Co. Inc.

Merck and Co. Inc. - Overview
Merck and Co. Inc. - Business segments
Merck and Co. Inc. - Key news
Merck and Co. Inc. - Key offerings
Merck and Co. Inc. - Segment focus
SWOT

15.16 Novartis AG

Novartis AG - Overview
Novartis AG - Business segments
Novartis AG - Key news
Novartis AG - Key offerings
Novartis AG - Segment focus
SWOT

15.17 Pfizer Inc.

Pfizer Inc. - Overview
Pfizer Inc. - Product / Service
Pfizer Inc. - Key news
Pfizer Inc. - Key offerings
SWOT

15.18 Sanofi SA

Sanofi SA - Overview
Sanofi SA - Business segments
Sanofi SA - Key news
Sanofi SA - Key offerings
Sanofi SA - Segment focus
SWOT

16. Appendix

16.1 Scope of the report

Market definition
Objectives
Notes and caveats

16.2 Inclusions and exclusions checklist

Inclusions checklist
Exclusions checklist

16.3 Currency conversion rates for US$

16.4 Research methodology

16.5 Data procurement

Information sources

16.6 Data validation

16.7 Validation techniques employed for market sizing

16.8 Data synthesis

16.9 360 degree market analysis

16.10 List of abbreviations

Research Methodology

Technavio presents a detailed picture of the market by way of study, synthesis, and summation of data from multiple sources. The analysts have presented the various facets of the market with a particular focus on identifying the key industry influencers. The data thus presented is comprehensive, reliable, and the result of extensive research, both primary and secondary.

INFORMATION SOURCES

Primary sources

  • Manufacturers and suppliers
  • Channel partners
  • Industry experts
  • Strategic decision makers

Secondary sources

  • Industry journals and periodicals
  • Government data
  • Financial reports of key industry players
  • Historical data
  • Press releases

DATA ANALYSIS

Data Synthesis

  • Collation of data
  • Estimation of key figures
  • Analysis of derived insights

Data Validation

  • Triangulation with data models
  • Reference against proprietary databases
  • Corroboration with industry experts

REPORT WRITING

Qualitative

  • Market drivers
  • Market challenges
  • Market trends
  • Five forces analysis

Quantitative

  • Market size and forecast
  • Market segmentation
  • Geographical insights
  • Competitive landscape

Interested in this report?

Get your sample now to see our research methodology and insights!

Download Now

Frequently Asked Questions

Inotropic Agents market growth will increase by USD 1961.6 million during 2025-2029 .

The Inotropic Agents market is expected to grow at a CAGR of 12% during 2025-2029 .

Inotropic Agents market is segmented by Route of administration (Parenteral, Oral, Others) Type (Positive inotropic drugs, Negative inotropic drugs, Others) End-user (Hospitals, Homecare, Specialty centers, Others)

AbbVie Inc., Amgen Inc., AstraZeneca Plc, Aurobindo Pharma Ltd., Baxter International Inc., Bayer AG, Boehringer Ingelheim GmbH, Bristol Myers Squibb Co., Cadila Pharmaceuticals Ltd., Cipla Inc., Eli Lilly and Co., GlaxoSmithKline Plc, Hikma Pharmaceuticals Plc, Johnson and Johnson Services, Lupin Ltd., Merck and Co. Inc., Novartis AG, Pfizer Inc., Sanofi SA, Viatris Inc. are a few of the key vendors in the Inotropic Agents market.

North America will register the highest growth rate of 39.6% among the other regions. Therefore, the Inotropic Agents market in North America is expected to garner significant business opportunities for the vendors during the forecast period.

US, Canada, Mexico, Germany, UK, France, Russia, Italy, Spain, The Netherlands, China, Japan, India, South Korea, Singapore, Thailand, Indonesia, Brazil, Turkey, Saudi Arabia, South Africa, Australia, UAE

  • Increasing prevalence of cardiovascular diseases is the driving factor this market.

The Inotropic Agents market vendors should focus on grabbing business opportunities from the Route of administration segment as it accounted for the largest market share in the base year.