Instant Shipping Market Analysis, Size, and Forecast 2026-2030: North America (US, Canada, and Mexico), Europe (Germany, UK, and France), APAC (China, Japan, and India), Middle East and Africa (Saudi Arabia, UAE, and South Africa), South America (Brazil and Argentina), and Rest of World (ROW)

Instant Shipping Market Analysis, Size, and Forecast 2026-2030:
North America (US, Canada, and Mexico), Europe (Germany, UK, and France), APAC (China, Japan, and India), Middle East and Africa (Saudi Arabia, UAE, and South Africa), South America (Brazil and Argentina), and Rest of World (ROW)

Published: Dec 2025 301 Pages SKU: IRTNTR80136

Market Overview at a Glance

$52.99 B
Market Opportunity
8.5%
CAGR 2025 - 2030
39%
North America Growth
$38.17 B
E-commerce segment 2024

Instant Shipping Market Size 2026-2030

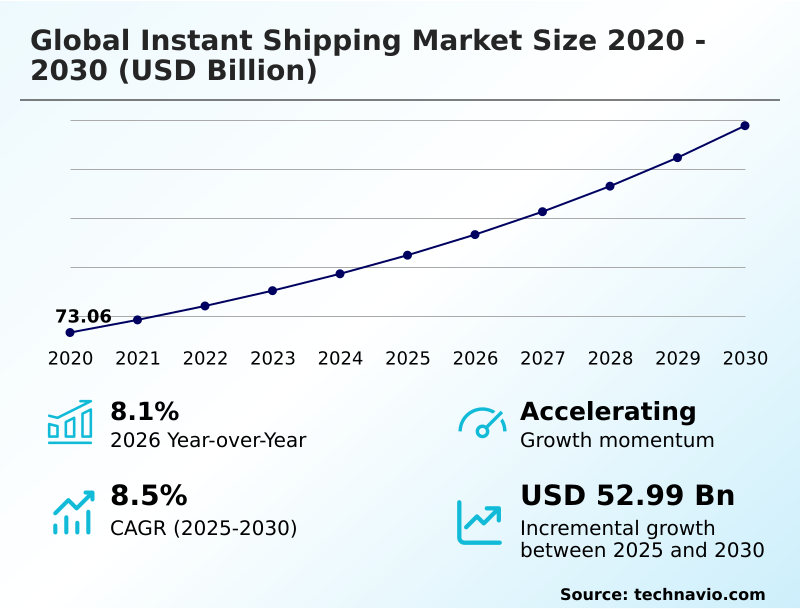
The instant shipping market size is valued to increase by USD 52.99 billion, at a CAGR of 8.5% from 2025 to 2030. Growth in international trade will drive the instant shipping market.

Major Market Trends & Insights

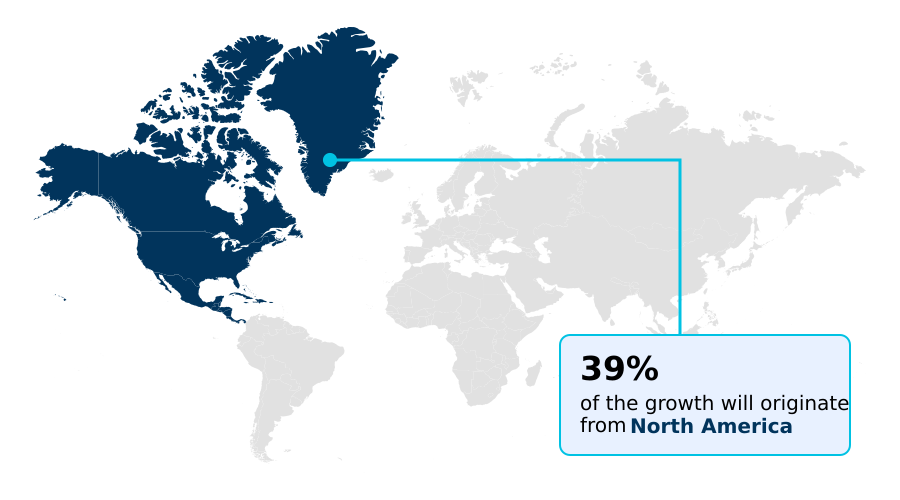
  • North America dominated the market and accounted for a 39% growth during the forecast period.
  • By End-user - E-commerce segment was valued at USD 38.17 billion in 2024
  • By Customer Type - Business to customer segment accounted for the largest market revenue share in 2024

Market Size & Forecast

  • Market Opportunities: USD 84.62 billion
  • Market Future Opportunities: USD 52.99 billion
  • CAGR from 2025 to 2030 : 8.5%

Market Summary

What will be the Size of the Instant Shipping Market during the forecast period?

Get Key Insights on Market Forecast (PDF) Request Free Sample

How is the Instant Shipping Market Segmented?

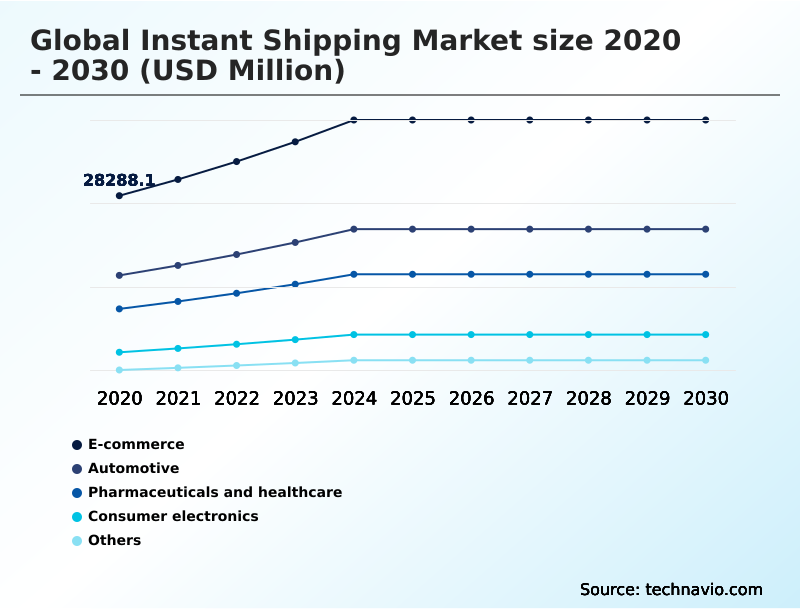
The instant shipping industry research report provides comprehensive data (region-wise segment analysis), with forecasts and estimates in "USD million" for the period 2026-2030, as well as historical data from 2020-2024 for the following segments.

  • End-user
    • E-commerce
    • Automotive
    • Pharmaceuticals and healthcare
    • Consumer electronics
    • Others
  • Customer type
    • Business to customer
    • Business to business
  • Application
    • Next-day delivery
    • Same-day delivery
    • Scheduled delivery
  • Geography
    • North America
      • US
      • Canada
      • Mexico
    • Europe
      • Germany
      • UK
      • France
    • APAC
      • China
      • Japan
      • India
    • Middle East and Africa
      • Saudi Arabia
      • UAE
      • South Africa
    • South America
      • Brazil
      • Argentina
    • Rest of World (ROW)

By End-user Insights

The e-commerce segment is estimated to witness significant growth during the forecast period.

Request Free Sample

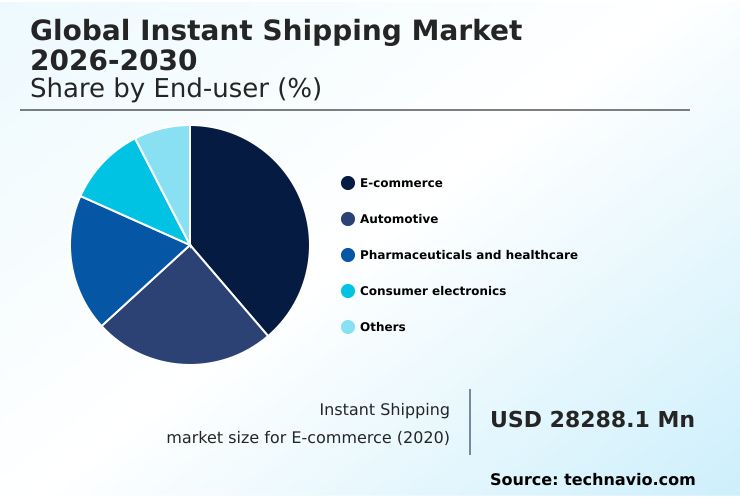
The E-commerce segment was valued at USD 38.17 billion in 2024 and showed a gradual increase during the forecast period.

Request Free Sample

Regional Analysis

North America is estimated to contribute 39% to the growth of the global market during the forecast period.Technavio’s analysts have elaborately explained the regional trends and drivers that shape the market during the forecast period.

See How Instant Shipping Market Demand is Rising in North America Request Free Sample

Market Dynamics

Our researchers analyzed the data with 2025 as the base year, along with the key drivers, trends, and challenges. A holistic analysis of drivers will help companies refine their marketing strategies to gain a competitive advantage.

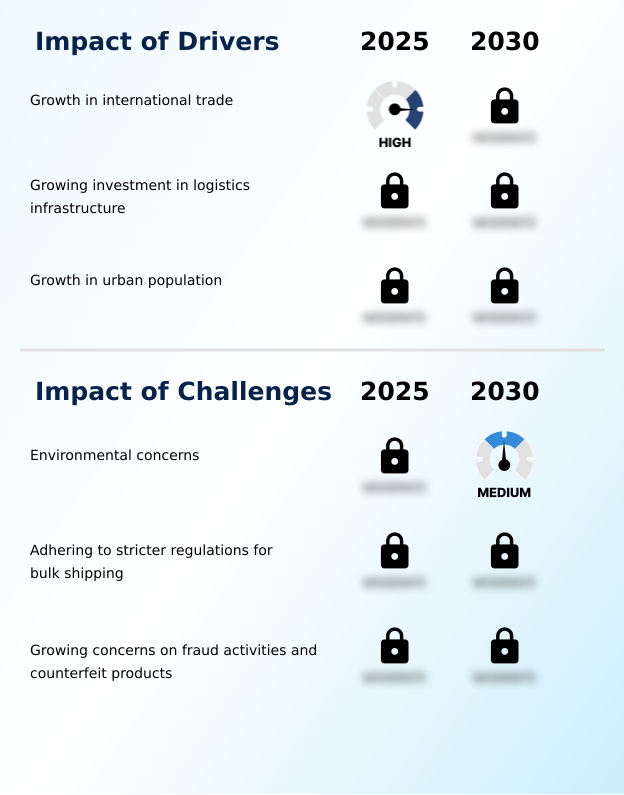
What are the key market drivers leading to the rise in the adoption of Instant Shipping Industry?

What are the market trends shaping the Instant Shipping Industry?

What challenges does the Instant Shipping Industry face during its growth?

Exclusive Technavio Analysis on Customer Landscape

The instant shipping market forecasting report includes the adoption lifecycle of the market, covering from the innovator’s stage to the laggard’s stage. It focuses on adoption rates in different regions based on penetration. Furthermore, the instant shipping market report also includes key purchase criteria and drivers of price sensitivity to help companies evaluate and develop their market growth analysis strategies.

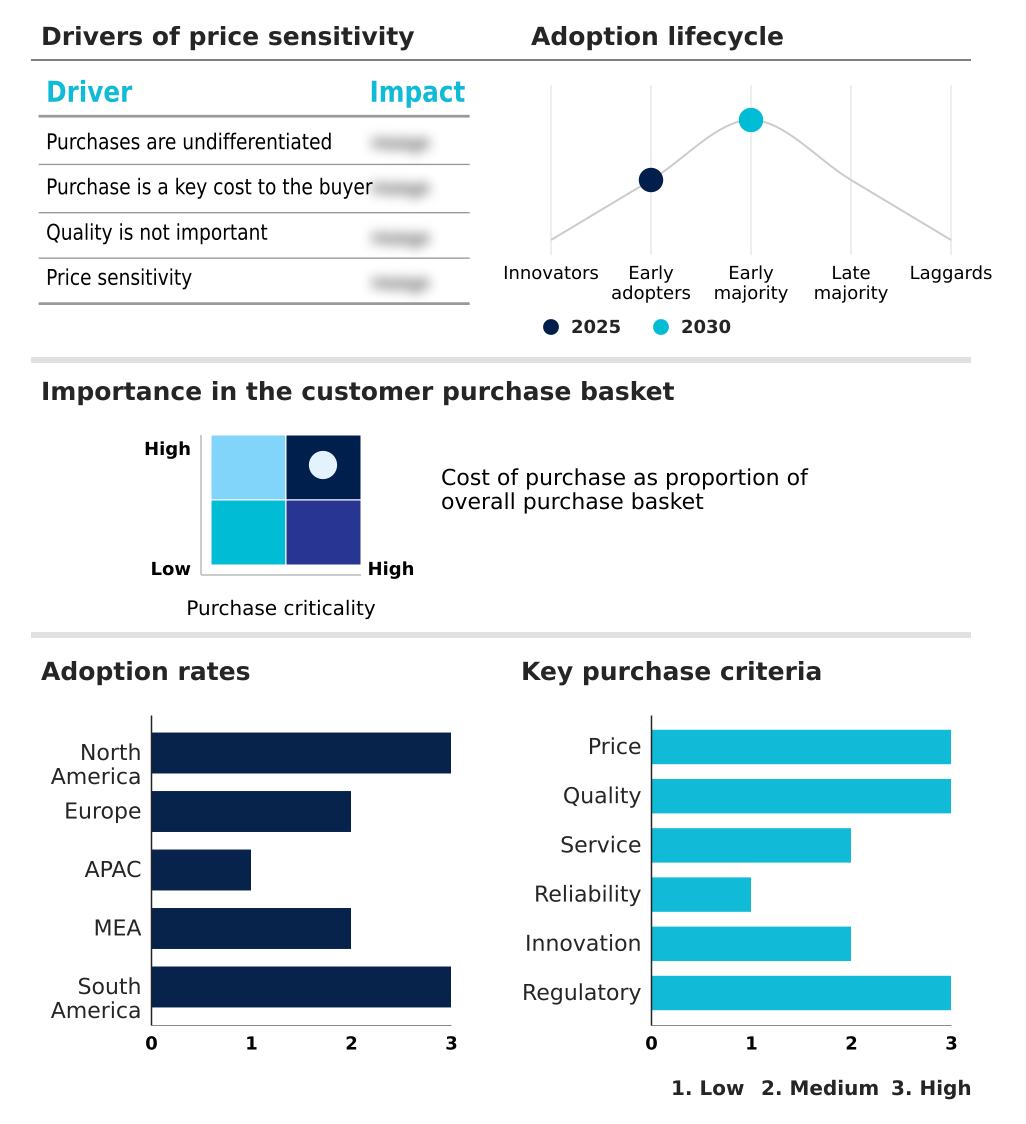
Customer Landscape of Instant Shipping Industry

Competitive Landscape

Companies are implementing various strategies, such as strategic alliances, instant shipping market forecast, partnerships, mergers and acquisitions, geographical expansion, and product/service launches, to enhance their presence in the industry.

Amazon.com Inc. -

The industry research and growth report includes detailed analyses of the competitive landscape of the market and information about key companies, including:

  • Amazon.com Inc.
  • AP Moller Maersk AS
  • Aramex International LLC
  • CMA CGM Group
  • COSCO Shipping Ports Ltd.
  • Deutsche Post AG
  • DPD Deutschland GmbH
  • FedEx Corp.
  • Hapag Lloyd AG
  • Japan Post Holdings Co. Ltd.
  • JD.com Inc.
  • Kuehne Nagel Management AG
  • Nippon Express Holdings Inc.
  • Royal Mail Group Ltd.
  • Schenker AG
  • SEKO Logistics
  • Swissport International AG
  • United Parcel Service Inc.
  • XPO Inc.
  • Yamato Holdings Co. Ltd.

Qualitative and quantitative analysis of companies has been conducted to help clients understand the wider business environment as well as the strengths and weaknesses of key industry players. Data is qualitatively analyzed to categorize companies as pure play, category-focused, industry-focused, and diversified; it is quantitatively analyzed to categorize companies as dominant, leading, strong, tentative, and weak.

Recent Development and News in Instant shipping market

Dive into Technavio’s robust research methodology, blending expert interviews, extensive data synthesis, and validated models for unparalleled Instant Shipping Market insights. See full methodology.

Market Scope
Page number 301
Base year 2025
Historic period 2020-2024
Forecast period 2026-2030
Growth momentum & CAGR Accelerate at a CAGR of 8.5%
Market growth 2026-2030 USD 52987.0 million
Market structure Fragmented
YoY growth 2025-2026(%) 8.1%
Key countries US, Canada, Mexico, Germany, UK, France, Italy, Spain, The Netherlands, China, Japan, India, South Korea, Australia, Indonesia, Saudi Arabia, UAE, South Africa, Israel, Turkey, Brazil, Argentina and Chile
Competitive landscape Leading Companies, Market Positioning of Companies, Competitive Strategies, and Industry Risks

Request Free Sample

Research Analyst Overview

What are the Key Data Covered in this Instant Shipping Market Research and Growth Report?

  • What is the expected growth of the Instant Shipping Market between 2026 and 2030?

    • USD 52.99 billion, at a CAGR of 8.5%

  • What segmentation does the market report cover?

    • The report is segmented by End-user (E-commerce, Automotive, Pharmaceuticals and healthcare, Consumer electronics, and Others), Customer Type (Business to customer, and Business to business), Application (Next-day delivery, Same-day delivery, and Scheduled delivery) and Geography (North America, Europe, APAC, Middle East and Africa, South America)

  • Which regions are analyzed in the report?

    • North America, Europe, APAC, Middle East and Africa and South America

  • What are the key growth drivers and market challenges?

    • Growth in international trade, Environmental concerns

  • Who are the major players in the Instant Shipping Market?

    • Amazon.com Inc., AP Moller Maersk AS, Aramex International LLC, CMA CGM Group, COSCO Shipping Ports Ltd., Deutsche Post AG, DPD Deutschland GmbH, FedEx Corp., Hapag Lloyd AG, Japan Post Holdings Co. Ltd., JD.com Inc., Kuehne Nagel Management AG, Nippon Express Holdings Inc., Royal Mail Group Ltd., Schenker AG, SEKO Logistics, Swissport International AG, United Parcel Service Inc., XPO Inc. and Yamato Holdings Co. Ltd.

Market Research Insights

We can help! Our analysts can customize this instant shipping market research report to meet your requirements.

Get in touch

1. Executive Summary

1.1 Market overview

Executive Summary - Chart on Market Overview
Executive Summary - Data Table on Market Overview
Executive Summary - Chart on Global Market Characteristics
Executive Summary - Chart on Market by Geography
Executive Summary - Chart on Market Segmentation by End-user
Executive Summary - Chart on Market Segmentation by Customer Type
Executive Summary - Chart on Market Segmentation by Application
Executive Summary - Chart on Incremental Growth
Executive Summary - Data Table on Incremental Growth
Executive Summary - Chart on Company Market Positioning

2. Technavio Analysis

2.1 Analysis of price sensitivity, lifecycle, customer purchase basket, adoption rates, and purchase criteria

2.2 Criticality of inputs and Factors of differentiation

Chart on Overview on criticality of inputs and factors of differentiation

2.3 Factors of disruption

Chart on Overview on factors of disruption

2.4 Impact of drivers and challenges

Chart on Impact of drivers and challenges in 2025 and 2030

3. Market Landscape

3.1 Market ecosystem

Chart on Parent Market
Data Table on - Parent Market

3.2 Market characteristics

Chart on Market characteristics analysis

3.3 Value chain analysis

Chart on Value chain analysis

4. Market Sizing

4.1 Market definition

Data Table on Offerings of companies included in the market definition

4.2 Market segment analysis

Market segments

4.3 Market size 2025

4.4 Market outlook: Forecast for 2025-2030

Chart on Global - Market size and forecast 2025-2030 ($ million)
Data Table on Global - Market size and forecast 2025-2030 ($ million)
Chart on Global Market: Year-over-year growth 2025-2030 (%)
Data Table on Global Market: Year-over-year growth 2025-2030 (%)

5. Historic Market Size

5.1 Global Instant Shipping Market 2020 - 2024

Historic Market Size - Data Table on Global Instant Shipping Market 2020 - 2024 ($ million)

5.2 End-user segment analysis 2020 - 2024

Historic Market Size - End-user Segment 2020 - 2024 ($ million)

5.3 Customer Type segment analysis 2020 - 2024

Historic Market Size - Customer Type Segment 2020 - 2024 ($ million)

5.4 Application segment analysis 2020 - 2024

Historic Market Size - Application Segment 2020 - 2024 ($ million)

5.5 Geography segment analysis 2020 - 2024

Historic Market Size - Geography Segment 2020 - 2024 ($ million)

5.6 Country segment analysis 2020 - 2024

Historic Market Size - Country Segment 2020 - 2024 ($ million)

6. Qualitative Analysis

6.1 Impact of AI on the Global Instant Shipping Market

7. Five Forces Analysis

7.1 Five forces summary

Five forces analysis - Comparison between 2025 and 2030

7.2 Bargaining power of buyers

Bargaining power of buyers - Impact of key factors 2025 and 2030

7.3 Bargaining power of suppliers

Bargaining power of suppliers - Impact of key factors in 2025 and 2030

7.4 Threat of new entrants

Threat of new entrants - Impact of key factors in 2025 and 2030

7.5 Threat of substitutes

Threat of substitutes - Impact of key factors in 2025 and 2030

7.6 Threat of rivalry

Threat of rivalry - Impact of key factors in 2025 and 2030

7.7 Market condition

Chart on Market condition - Five forces 2025 and 2030

8. Market Segmentation by End-user

8.1 Market segments

Chart on End-user - Market share 2025-2030 (%)
Data Table on End-user - Market share 2025-2030 (%)

8.2 Comparison by End-user

Chart on Comparison by End-user
Data Table on Comparison by End-user

8.3 E-commerce - Market size and forecast 2025-2030

Chart on E-commerce - Market size and forecast 2025-2030 ($ million)
Data Table on E-commerce - Market size and forecast 2025-2030 ($ million)
Chart on E-commerce - Year-over-year growth 2025-2030 (%)
Data Table on E-commerce - Year-over-year growth 2025-2030 (%)

8.4 Automotive - Market size and forecast 2025-2030

Chart on Automotive - Market size and forecast 2025-2030 ($ million)
Data Table on Automotive - Market size and forecast 2025-2030 ($ million)
Chart on Automotive - Year-over-year growth 2025-2030 (%)
Data Table on Automotive - Year-over-year growth 2025-2030 (%)

8.5 Pharmaceuticals and healthcare - Market size and forecast 2025-2030

Chart on Pharmaceuticals and healthcare - Market size and forecast 2025-2030 ($ million)
Data Table on Pharmaceuticals and healthcare - Market size and forecast 2025-2030 ($ million)
Chart on Pharmaceuticals and healthcare - Year-over-year growth 2025-2030 (%)
Data Table on Pharmaceuticals and healthcare - Year-over-year growth 2025-2030 (%)

8.6 Consumer electronics - Market size and forecast 2025-2030

Chart on Consumer electronics - Market size and forecast 2025-2030 ($ million)
Data Table on Consumer electronics - Market size and forecast 2025-2030 ($ million)
Chart on Consumer electronics - Year-over-year growth 2025-2030 (%)
Data Table on Consumer electronics - Year-over-year growth 2025-2030 (%)

8.7 Others - Market size and forecast 2025-2030

Chart on Others - Market size and forecast 2025-2030 ($ million)
Data Table on Others - Market size and forecast 2025-2030 ($ million)
Chart on Others - Year-over-year growth 2025-2030 (%)
Data Table on Others - Year-over-year growth 2025-2030 (%)

8.8 Market opportunity by End-user

Market opportunity by End-user ($ million)
Data Table on Market opportunity by End-user ($ million)

9. Market Segmentation by Customer Type

9.1 Market segments

Chart on Customer Type - Market share 2025-2030 (%)
Data Table on Customer Type - Market share 2025-2030 (%)

9.2 Comparison by Customer Type

Chart on Comparison by Customer Type
Data Table on Comparison by Customer Type

9.3 Business to customer - Market size and forecast 2025-2030

Chart on Business to customer - Market size and forecast 2025-2030 ($ million)
Data Table on Business to customer - Market size and forecast 2025-2030 ($ million)
Chart on Business to customer - Year-over-year growth 2025-2030 (%)
Data Table on Business to customer - Year-over-year growth 2025-2030 (%)

9.4 Business to business - Market size and forecast 2025-2030

Chart on Business to business - Market size and forecast 2025-2030 ($ million)
Data Table on Business to business - Market size and forecast 2025-2030 ($ million)
Chart on Business to business - Year-over-year growth 2025-2030 (%)
Data Table on Business to business - Year-over-year growth 2025-2030 (%)

9.5 Market opportunity by Customer Type

Market opportunity by Customer Type ($ million)
Data Table on Market opportunity by Customer Type ($ million)

10. Market Segmentation by Application

10.1 Market segments

Chart on Application - Market share 2025-2030 (%)
Data Table on Application - Market share 2025-2030 (%)

10.2 Comparison by Application

Chart on Comparison by Application
Data Table on Comparison by Application

10.3 Next-day delivery - Market size and forecast 2025-2030

Chart on Next-day delivery - Market size and forecast 2025-2030 ($ million)
Data Table on Next-day delivery - Market size and forecast 2025-2030 ($ million)
Chart on Next-day delivery - Year-over-year growth 2025-2030 (%)
Data Table on Next-day delivery - Year-over-year growth 2025-2030 (%)

10.4 Same-day delivery - Market size and forecast 2025-2030

Chart on Same-day delivery - Market size and forecast 2025-2030 ($ million)
Data Table on Same-day delivery - Market size and forecast 2025-2030 ($ million)
Chart on Same-day delivery - Year-over-year growth 2025-2030 (%)
Data Table on Same-day delivery - Year-over-year growth 2025-2030 (%)

10.5 Scheduled delivery - Market size and forecast 2025-2030

Chart on Scheduled delivery - Market size and forecast 2025-2030 ($ million)
Data Table on Scheduled delivery - Market size and forecast 2025-2030 ($ million)
Chart on Scheduled delivery - Year-over-year growth 2025-2030 (%)
Data Table on Scheduled delivery - Year-over-year growth 2025-2030 (%)

10.6 Market opportunity by Application

Market opportunity by Application ($ million)
Data Table on Market opportunity by Application ($ million)

11. Customer Landscape

11.1 Customer landscape overview

Analysis of price sensitivity, lifecycle, customer purchase basket, adoption rates, and purchase criteria

12. Geographic Landscape

12.1 Geographic segmentation

Chart on Market share by geography 2025-2030 (%)
Data Table on Market share by geography 2025-2030 (%)

12.2 Geographic comparison

Chart on Geographic comparison
Data Table on Geographic comparison

12.3 North America - Market size and forecast 2025-2030

Chart on North America - Market size and forecast 2025-2030 ($ million)
Data Table on North America - Market size and forecast 2025-2030 ($ million)
Chart on North America - Year-over-year growth 2025-2030 (%)
Data Table on North America - Year-over-year growth 2025-2030 (%)
Chart on Regional Comparison - North America
Data Table on Regional Comparison - North America

12.3.1 US - Market size and forecast 2025-2030

Chart on US - Market size and forecast 2025-2030 ($ million)
Data Table on US - Market size and forecast 2025-2030 ($ million)
Chart on US - Year-over-year growth 2025-2030 (%)
Data Table on US - Year-over-year growth 2025-2030 (%)

12.3.2 Canada - Market size and forecast 2025-2030

Chart on Canada - Market size and forecast 2025-2030 ($ million)
Data Table on Canada - Market size and forecast 2025-2030 ($ million)
Chart on Canada - Year-over-year growth 2025-2030 (%)
Data Table on Canada - Year-over-year growth 2025-2030 (%)

12.3.3 Mexico - Market size and forecast 2025-2030

Chart on Mexico - Market size and forecast 2025-2030 ($ million)
Data Table on Mexico - Market size and forecast 2025-2030 ($ million)
Chart on Mexico - Year-over-year growth 2025-2030 (%)
Data Table on Mexico - Year-over-year growth 2025-2030 (%)

12.4 Europe - Market size and forecast 2025-2030

Chart on Europe - Market size and forecast 2025-2030 ($ million)
Data Table on Europe - Market size and forecast 2025-2030 ($ million)
Chart on Europe - Year-over-year growth 2025-2030 (%)
Data Table on Europe - Year-over-year growth 2025-2030 (%)
Chart on Regional Comparison - Europe
Data Table on Regional Comparison - Europe

12.4.1 Germany - Market size and forecast 2025-2030

Chart on Germany - Market size and forecast 2025-2030 ($ million)
Data Table on Germany - Market size and forecast 2025-2030 ($ million)
Chart on Germany - Year-over-year growth 2025-2030 (%)
Data Table on Germany - Year-over-year growth 2025-2030 (%)

12.4.2 UK - Market size and forecast 2025-2030

Chart on UK - Market size and forecast 2025-2030 ($ million)
Data Table on UK - Market size and forecast 2025-2030 ($ million)
Chart on UK - Year-over-year growth 2025-2030 (%)
Data Table on UK - Year-over-year growth 2025-2030 (%)

12.4.3 France - Market size and forecast 2025-2030

Chart on France - Market size and forecast 2025-2030 ($ million)
Data Table on France - Market size and forecast 2025-2030 ($ million)
Chart on France - Year-over-year growth 2025-2030 (%)
Data Table on France - Year-over-year growth 2025-2030 (%)

12.4.4 Italy - Market size and forecast 2025-2030

Chart on Italy - Market size and forecast 2025-2030 ($ million)
Data Table on Italy - Market size and forecast 2025-2030 ($ million)
Chart on Italy - Year-over-year growth 2025-2030 (%)
Data Table on Italy - Year-over-year growth 2025-2030 (%)

12.4.5 Spain - Market size and forecast 2025-2030

Chart on Spain - Market size and forecast 2025-2030 ($ million)
Data Table on Spain - Market size and forecast 2025-2030 ($ million)
Chart on Spain - Year-over-year growth 2025-2030 (%)
Data Table on Spain - Year-over-year growth 2025-2030 (%)

12.4.6 The Netherlands - Market size and forecast 2025-2030

Chart on The Netherlands - Market size and forecast 2025-2030 ($ million)
Data Table on The Netherlands - Market size and forecast 2025-2030 ($ million)
Chart on The Netherlands - Year-over-year growth 2025-2030 (%)
Data Table on The Netherlands - Year-over-year growth 2025-2030 (%)

12.5 APAC - Market size and forecast 2025-2030

Chart on APAC - Market size and forecast 2025-2030 ($ million)
Data Table on APAC - Market size and forecast 2025-2030 ($ million)
Chart on APAC - Year-over-year growth 2025-2030 (%)
Data Table on APAC - Year-over-year growth 2025-2030 (%)
Chart on Regional Comparison - APAC
Data Table on Regional Comparison - APAC

12.5.1 China - Market size and forecast 2025-2030

Chart on China - Market size and forecast 2025-2030 ($ million)
Data Table on China - Market size and forecast 2025-2030 ($ million)
Chart on China - Year-over-year growth 2025-2030 (%)
Data Table on China - Year-over-year growth 2025-2030 (%)

12.5.2 Japan - Market size and forecast 2025-2030

Chart on Japan - Market size and forecast 2025-2030 ($ million)
Data Table on Japan - Market size and forecast 2025-2030 ($ million)
Chart on Japan - Year-over-year growth 2025-2030 (%)
Data Table on Japan - Year-over-year growth 2025-2030 (%)

12.5.3 India - Market size and forecast 2025-2030

Chart on India - Market size and forecast 2025-2030 ($ million)
Data Table on India - Market size and forecast 2025-2030 ($ million)
Chart on India - Year-over-year growth 2025-2030 (%)
Data Table on India - Year-over-year growth 2025-2030 (%)

12.5.4 South Korea - Market size and forecast 2025-2030

Chart on South Korea - Market size and forecast 2025-2030 ($ million)
Data Table on South Korea - Market size and forecast 2025-2030 ($ million)
Chart on South Korea - Year-over-year growth 2025-2030 (%)
Data Table on South Korea - Year-over-year growth 2025-2030 (%)

12.5.5 Australia - Market size and forecast 2025-2030

Chart on Australia - Market size and forecast 2025-2030 ($ million)
Data Table on Australia - Market size and forecast 2025-2030 ($ million)
Chart on Australia - Year-over-year growth 2025-2030 (%)
Data Table on Australia - Year-over-year growth 2025-2030 (%)

12.5.6 Indonesia - Market size and forecast 2025-2030

Chart on Indonesia - Market size and forecast 2025-2030 ($ million)
Data Table on Indonesia - Market size and forecast 2025-2030 ($ million)
Chart on Indonesia - Year-over-year growth 2025-2030 (%)
Data Table on Indonesia - Year-over-year growth 2025-2030 (%)

12.6 Middle East and Africa - Market size and forecast 2025-2030

Chart on Middle East and Africa - Market size and forecast 2025-2030 ($ million)
Data Table on Middle East and Africa - Market size and forecast 2025-2030 ($ million)
Chart on Middle East and Africa - Year-over-year growth 2025-2030 (%)
Data Table on Middle East and Africa - Year-over-year growth 2025-2030 (%)
Chart on Regional Comparison - Middle East and Africa
Data Table on Regional Comparison - Middle East and Africa

12.6.1 Saudi Arabia - Market size and forecast 2025-2030

Chart on Saudi Arabia - Market size and forecast 2025-2030 ($ million)
Data Table on Saudi Arabia - Market size and forecast 2025-2030 ($ million)
Chart on Saudi Arabia - Year-over-year growth 2025-2030 (%)
Data Table on Saudi Arabia - Year-over-year growth 2025-2030 (%)

12.6.2 UAE - Market size and forecast 2025-2030

Chart on UAE - Market size and forecast 2025-2030 ($ million)
Data Table on UAE - Market size and forecast 2025-2030 ($ million)
Chart on UAE - Year-over-year growth 2025-2030 (%)
Data Table on UAE - Year-over-year growth 2025-2030 (%)

12.6.3 South Africa - Market size and forecast 2025-2030

Chart on South Africa - Market size and forecast 2025-2030 ($ million)
Data Table on South Africa - Market size and forecast 2025-2030 ($ million)
Chart on South Africa - Year-over-year growth 2025-2030 (%)
Data Table on South Africa - Year-over-year growth 2025-2030 (%)

12.6.4 Israel - Market size and forecast 2025-2030

Chart on Israel - Market size and forecast 2025-2030 ($ million)
Data Table on Israel - Market size and forecast 2025-2030 ($ million)
Chart on Israel - Year-over-year growth 2025-2030 (%)
Data Table on Israel - Year-over-year growth 2025-2030 (%)

12.6.5 Turkey - Market size and forecast 2025-2030

Chart on Turkey - Market size and forecast 2025-2030 ($ million)
Data Table on Turkey - Market size and forecast 2025-2030 ($ million)
Chart on Turkey - Year-over-year growth 2025-2030 (%)
Data Table on Turkey - Year-over-year growth 2025-2030 (%)

12.7 South America - Market size and forecast 2025-2030

Chart on South America - Market size and forecast 2025-2030 ($ million)
Data Table on South America - Market size and forecast 2025-2030 ($ million)
Chart on South America - Year-over-year growth 2025-2030 (%)
Data Table on South America - Year-over-year growth 2025-2030 (%)
Chart on Regional Comparison - South America
Data Table on Regional Comparison - South America

12.7.1 Brazil - Market size and forecast 2025-2030

Chart on Brazil - Market size and forecast 2025-2030 ($ million)
Data Table on Brazil - Market size and forecast 2025-2030 ($ million)
Chart on Brazil - Year-over-year growth 2025-2030 (%)
Data Table on Brazil - Year-over-year growth 2025-2030 (%)

12.7.2 Argentina - Market size and forecast 2025-2030

Chart on Argentina - Market size and forecast 2025-2030 ($ million)
Data Table on Argentina - Market size and forecast 2025-2030 ($ million)
Chart on Argentina - Year-over-year growth 2025-2030 (%)
Data Table on Argentina - Year-over-year growth 2025-2030 (%)

12.7.3 Chile - Market size and forecast 2025-2030

Chart on Chile - Market size and forecast 2025-2030 ($ million)
Data Table on Chile - Market size and forecast 2025-2030 ($ million)
Chart on Chile - Year-over-year growth 2025-2030 (%)
Data Table on Chile - Year-over-year growth 2025-2030 (%)

12.8 Market opportunity by geography

Market opportunity by geography ($ million)
Data Tables on Market opportunity by geography ($ million)

13. Drivers, Challenges, and Opportunity

13.1 Market drivers

Growth in international trade
Growing investment in logistics infrastructure
Growth in urban population

13.2 Market challenges

Environmental concerns
Adhering to stricter regulations for bulk shipping
Growing concerns on fraud activities and counterfeit products

13.3 Impact of drivers and challenges

Impact of drivers and challenges in 2025 and 2030

13.4 Market opportunities

Adoption of drone technology
Expanding horizons globally by companies
Rise in digital payment and mobile shopping

14. Competitive Landscape

14.1 Overview

14.2

Overview on criticality of inputs and factors of differentiation

14.3 Landscape disruption

Overview on factors of disruption

14.4 Industry risks

Impact of key risks on business

15. Competitive Analysis

15.1 Companies profiled

Companies covered

15.2 Company ranking index

15.3 Market positioning of companies

Matrix on companies position and classification

15.4 Amazon.com Inc.

Amazon.com Inc. - Overview
Amazon.com Inc. - Business segments
Amazon.com Inc. - Key news
Amazon.com Inc. - Key offerings
Amazon.com Inc. - Segment focus
SWOT

15.5 AP Moller Maersk AS

AP Moller Maersk AS - Overview
AP Moller Maersk AS - Business segments
AP Moller Maersk AS - Key news
AP Moller Maersk AS - Key offerings
AP Moller Maersk AS - Segment focus
SWOT

15.6 CMA CGM Group

CMA CGM Group - Overview
CMA CGM Group - Product / Service
CMA CGM Group - Key news
CMA CGM Group - Key offerings
SWOT

15.7 Deutsche Post AG

Deutsche Post AG - Overview
Deutsche Post AG - Business segments
Deutsche Post AG - Key news
Deutsche Post AG - Key offerings
Deutsche Post AG - Segment focus
SWOT

15.8 DPD Deutschland GmbH

DPD Deutschland GmbH - Overview
DPD Deutschland GmbH - Product / Service
DPD Deutschland GmbH - Key offerings
SWOT

15.9 FedEx Corp.

FedEx Corp. - Overview
FedEx Corp. - Business segments
FedEx Corp. - Key news
FedEx Corp. - Key offerings
FedEx Corp. - Segment focus
SWOT

15.10 Japan Post Holdings Co. Ltd.

Japan Post Holdings Co. Ltd. - Overview
Japan Post Holdings Co. Ltd. - Business segments
Japan Post Holdings Co. Ltd. - Key offerings
Japan Post Holdings Co. Ltd. - Segment focus
SWOT

15.11 Kuehne Nagel Management AG

Kuehne Nagel Management AG - Overview
Kuehne Nagel Management AG - Business segments
Kuehne Nagel Management AG - Key news
Kuehne Nagel Management AG - Key offerings
Kuehne Nagel Management AG - Segment focus
SWOT

15.12 Nippon Express Holdings Inc.

Nippon Express Holdings Inc. - Overview
Nippon Express Holdings Inc. - Business segments
Nippon Express Holdings Inc. - Key news
Nippon Express Holdings Inc. - Key offerings
Nippon Express Holdings Inc. - Segment focus
SWOT

15.13 Royal Mail Group Ltd.

Royal Mail Group Ltd. - Overview
Royal Mail Group Ltd. - Product / Service
Royal Mail Group Ltd. - Key offerings
SWOT

15.14 Schenker AG

Schenker AG - Overview
Schenker AG - Product / Service
Schenker AG - Key offerings
SWOT

15.15 SEKO Logistics

SEKO Logistics - Overview
SEKO Logistics - Product / Service
SEKO Logistics - Key offerings
SWOT

15.16 United Parcel Service Inc.

United Parcel Service Inc. - Overview
United Parcel Service Inc. - Business segments
United Parcel Service Inc. - Key news
United Parcel Service Inc. - Key offerings
United Parcel Service Inc. - Segment focus
SWOT

15.17 XPO Inc.

XPO Inc. - Overview
XPO Inc. - Business segments
XPO Inc. - Key news
XPO Inc. - Key offerings
XPO Inc. - Segment focus
SWOT

15.18 Yamato Holdings Co. Ltd.

Yamato Holdings Co. Ltd. - Overview
Yamato Holdings Co. Ltd. - Business segments
Yamato Holdings Co. Ltd. - Key news
Yamato Holdings Co. Ltd. - Key offerings
Yamato Holdings Co. Ltd. - Segment focus
SWOT

16. Appendix

16.1 Scope of the report

Market definition
Objectives
Notes and caveats

16.2 Inclusions and exclusions checklist

Inclusions checklist
Exclusions checklist

16.3 Currency conversion rates for US$

16.4 Research methodology

16.5 Data procurement

Information sources

16.6 Data validation

16.7 Validation techniques employed for market sizing

16.8 Data synthesis

16.9 360 degree market analysis

16.10 List of abbreviations

Research Methodology

Technavio presents a detailed picture of the market by way of study, synthesis, and summation of data from multiple sources. The analysts have presented the various facets of the market with a particular focus on identifying the key industry influencers. The data thus presented is comprehensive, reliable, and the result of extensive research, both primary and secondary.

INFORMATION SOURCES

Primary sources

  • Manufacturers and suppliers
  • Channel partners
  • Industry experts
  • Strategic decision makers

Secondary sources

  • Industry journals and periodicals
  • Government data
  • Financial reports of key industry players
  • Historical data
  • Press releases

DATA ANALYSIS

Data Synthesis

  • Collation of data
  • Estimation of key figures
  • Analysis of derived insights

Data Validation

  • Triangulation with data models
  • Reference against proprietary databases
  • Corroboration with industry experts

REPORT WRITING

Qualitative

  • Market drivers
  • Market challenges
  • Market trends
  • Five forces analysis

Quantitative

  • Market size and forecast
  • Market segmentation
  • Geographical insights
  • Competitive landscape

Interested in this report?

Get your sample now to see our research methodology and insights!

Download Now

Frequently Asked Questions

Instant Shipping market growth will increase by USD 52987.0 million during 2026-2030 .

The Instant Shipping market is expected to grow at a CAGR of 8.5% during 2026-2030 .

Instant Shipping market is segmented by End-user (E-commerce, Automotive, Pharmaceuticals and healthcare, Consumer electronics, Others) Customer type (Business to customer, Business to business) Application (Next-day delivery, Same-day delivery, Scheduled delivery)

Amazon.com Inc., AP Moller Maersk AS, Aramex International LLC, CMA CGM Group, COSCO Shipping Ports Ltd., Deutsche Post AG, DPD Deutschland GmbH, FedEx Corp., Hapag Lloyd AG, Japan Post Holdings Co. Ltd., JD.com Inc., Kuehne Nagel Management AG, Nippon Express Holdings Inc., Royal Mail Group Ltd., Schenker AG, SEKO Logistics, Swissport International AG, United Parcel Service Inc., XPO Inc., Yamato Holdings Co. Ltd. are a few of the key vendors in the Instant Shipping market.

North America will register the highest growth rate of 39% among the other regions. Therefore, the Instant Shipping market in North America is expected to garner significant business opportunities for the vendors during the forecast period.

US, Canada, Mexico, Germany, UK, France, Italy, Spain, The Netherlands, China, Japan, India, South Korea, Australia, Indonesia, Saudi Arabia, UAE, South Africa, Israel, Turkey, Brazil, Argentina, Chile

  • Growth in international trade is the driving factor this market.

The Instant Shipping market vendors should focus on grabbing business opportunities from the End-user segment as it accounted for the largest market share in the base year.