Intelligent Pump And Control Systems Market Size 2026-2030
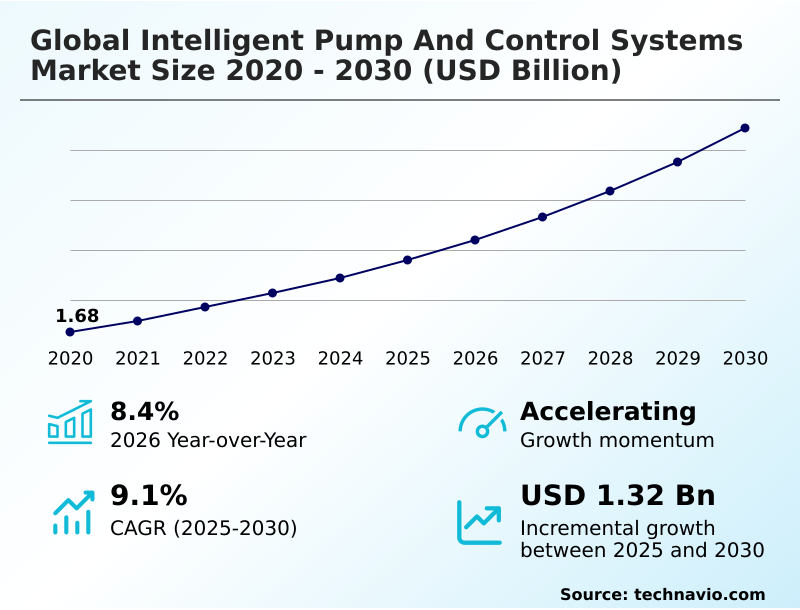
The intelligent pump and control systems market size is valued to increase by USD 1.32 billion, at a CAGR of 9.1% from 2025 to 2030. Imperative for energy efficiency and decarbonization in industrial operations will drive the intelligent pump and control systems market.
Major Market Trends & Insights
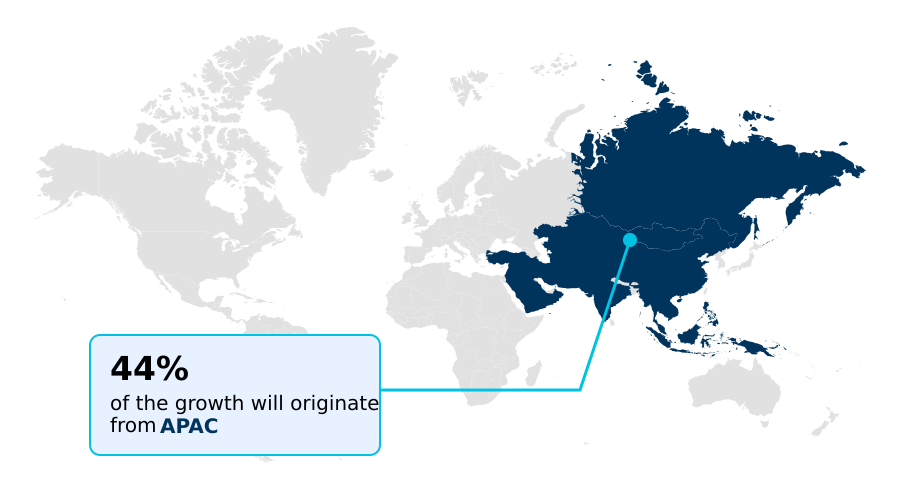
- APAC dominated the market and accounted for a 44.2% growth during the forecast period.
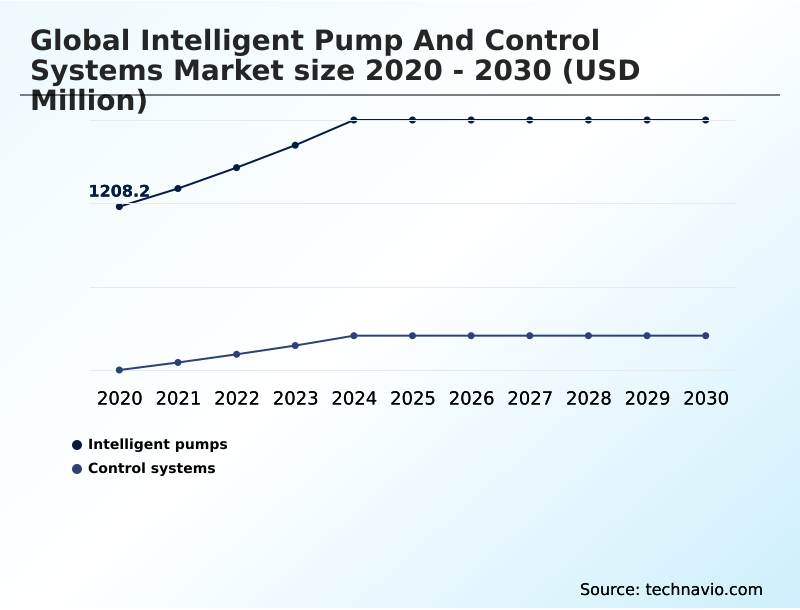
- By Component - Intelligent pumps segment was valued at USD 1.60 billion in 2024
- By Type - Centrifugal pumps segment accounted for the largest market revenue share in 2024
Market Size & Forecast
- Market Opportunities: USD 2.04 billion
- Market Future Opportunities: USD 1.32 billion
- CAGR from 2025 to 2030 : 9.1%
Market Summary
- The intelligent pump and control systems market is undergoing a significant transformation, moving beyond basic fluid transport to become a cornerstone of smart manufacturing technologies. This evolution is driven by the need for enhanced operational efficiency and resource conservation across industrial and municipal sectors.
- Key technologies like variable frequency drives and advanced pump controllers allow for autonomous adjustments based on real-time system demand, a critical feature for energy consumption optimization. The integration of IIoT in industrial pumping facilitates a shift from reactive to predictive maintenance, where machine learning algorithms analyze data from high-fidelity sensors to forecast potential equipment failures.
- For instance, a chemical processing facility can leverage predictive maintenance for centrifugal pumps to schedule maintenance on a boiler feed pump during a planned shutdown, preventing costly unscheduled downtime. However, the high initial capital outlay and the need for specialized skills to manage complex mechatronic system diagnostics pose significant adoption barriers.
- Furthermore, the trend toward decentralized control logic and edge computing introduces new challenges related to cyber-physical system security, which must be addressed to ensure the integrity of critical infrastructure.
What will be the Size of the Intelligent Pump And Control Systems Market during the forecast period?
Get Key Insights on Market Forecast (PDF) Get Free Sample
How is the Intelligent Pump And Control Systems Market Segmented?
The intelligent pump and control systems industry research report provides comprehensive data (region-wise segment analysis), with forecasts and estimates in "USD million" for the period 2026-2030, as well as historical data from 2020-2024 for the following segments.
- Component
- Intelligent pumps
- Control systems
- Type
- Centrifugal pumps
- Positive displacement pumps
- End-user
- Water and wastewater industry
- Oil and gas industry
- Chemical and petrochemical industry
- Power industry
- Others
- Application
- Flow control
- Liquid transfer
- Pressure boosting
- Others
- Geography
- APAC
- China
- Japan
- India
- North America
- US
- Canada
- Mexico
- Europe
- Germany
- UK
- France
- Middle East and Africa
- Saudi Arabia
- UAE
- South Africa
- South America
- Brazil
- Argentina
- Rest of World (ROW)
- APAC
By Component Insights
The intelligent pumps segment is estimated to witness significant growth during the forecast period.
The market's core revolves around intelligent pumps, which are distinct from traditional hardware. These systems integrate variable frequency drives and advanced sensors to function as autonomous agents within a hydraulic network.
A primary objective is maintaining the best efficiency point, crucial for energy consumption optimization and reducing mechanical stress, a process governed by programmable logic controllers.
This segment is shifting towards high-efficiency motors and multi-pump controller logic integrated directly into the drive, enabling sophisticated load balancing. The integration of the Industrial Internet of Things (IIoT) facilitates real-time flow monitoring and data collection for predictive maintenance platforms.
By using closed-loop feedback control, these pumps can identify early indicators of wear, with some systems improving fault detection accuracy by over 25%.
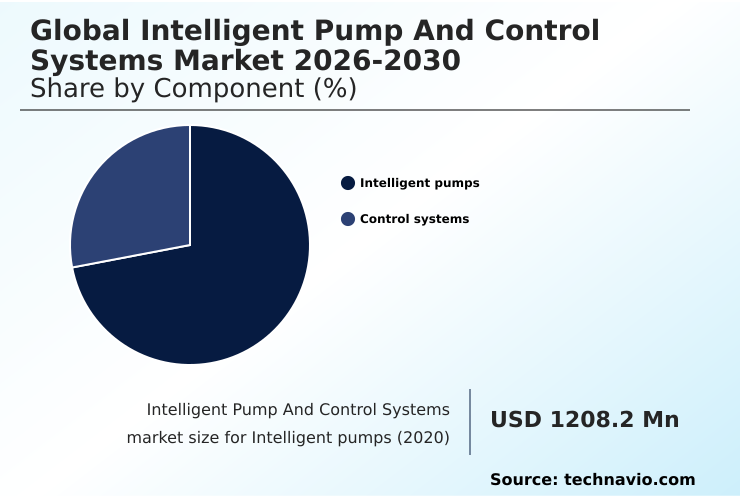
The Intelligent pumps segment was valued at USD 1.60 billion in 2024 and showed a gradual increase during the forecast period.
Regional Analysis
APAC is estimated to contribute 44.2% to the growth of the global market during the forecast period.Technavio’s analysts have elaborately explained the regional trends and drivers that shape the market during the forecast period.
See How Intelligent Pump And Control Systems Market Demand is Rising in APAC Get Free Sample
The geographic landscape is led by APAC, which accounts for over 44% of the market's incremental growth, driven by rapid urbanization in countries like China and India.
This region is leapfrogging legacy systems in favor of smart water grid management and automated utility infrastructure.
North America follows, with a focus on retrofitting aging water systems; utilities implementing autonomous pressure management have reported reductions in non-revenue water by up to 20%.
Europe is characterized by stringent regulations that mandate energy-efficient motor systems, pushing the adoption of company-agnostic control software. In the Middle East, large-scale desalination projects utilize high-integrity pressure sensors and demand-responsive pumping to manage energy-intensive operations.
Slurry transport optimization in the mining sectors of South America and Australia also drives demand. This global adoption reflects a unified push for asset lifecycle management, with a focus on decentralized hydraulic networks for remote assets.
Market Dynamics
Our researchers analyzed the data with 2025 as the base year, along with the key drivers, trends, and challenges. A holistic analysis of drivers will help companies refine their marketing strategies to gain a competitive advantage.
- Strategic decision-making in the market increasingly revolves around specific use cases and measurable outcomes. For example, integrating digital twins for pump optimization allows engineering teams to test hydraulic scenarios virtually, reducing commissioning errors significantly compared to traditional trial-and-error methods.
- Similarly, the adoption of pump-as-a-service models for municipalities is lowering financial barriers, enabling smaller utilities to access advanced technology without large capital outlays. The move toward edge computing for real-time pump control is critical in high-stakes environments, where millisecond response times can prevent equipment damage.
- However, addressing cybersecurity risks in connected pump systems remains a paramount concern for protecting critical infrastructure. A primary driver for adoption is the clear ROI from variable frequency drives for energy savings, which can cut electricity consumption in some applications by over 50%.
- The value of predictive maintenance for centrifugal pumps is also clear, extending equipment life and minimizing unplanned downtime. In urban areas, reducing non-revenue water with smart pumps is a key objective, while optimizing HVAC systems with intelligent pumps contributes to green building certifications. Specialized control systems for wastewater treatment plants are crucial for compliance and efficiency.
- The broader trend of IIoT integration in industrial pumping faces challenges of retrofitting legacy pump systems, but the proven ROI of intelligent pump system upgrades justifies the investment. Other key applications include automating chemical dosing with smart pumps, ensuring high-pressure boosting for commercial buildings, and enabling decentralized control for remote water assets.
- The ability to start simulating hydraulic performance with software before physical installation is a game-changer. Finally, tailored intelligent pump solutions for oil and gas and systems for managing slurry transport in mining operations highlight the market's versatility in improving water grid resilience with automation and deploying autonomous pump operation and machine learning.
What are the key market drivers leading to the rise in the adoption of Intelligent Pump And Control Systems Industry?
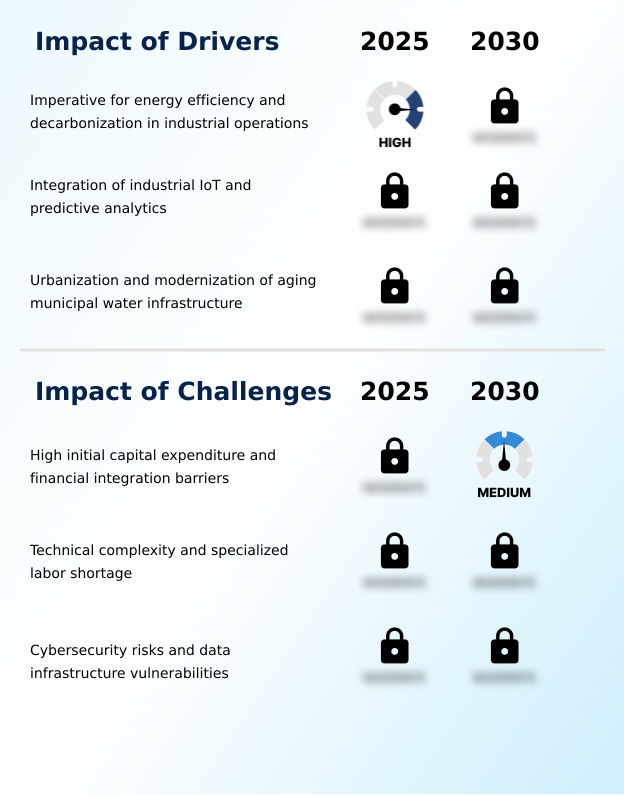
- The imperative for energy efficiency and decarbonization in industrial operations is a key driver for market growth.
- Market growth for intelligent pump and control systems is primarily driven by the imperative for energy efficiency and data-driven operations.
- Intelligent systems incorporating variable speed drive optimization can reduce energy consumption by up to 50% compared to traditional fixed-speed pumps, directly improving operational margins. This focus on energy consumption optimization is a key component of sustainable industrial practices.
- The rapid proliferation of the Industrial IoT is another major catalyst, enabling data-driven operational visibility through real-time performance metrics. The use of predictive maintenance algorithms can reduce unscheduled downtime by over 70% by detecting anomalies before failures occur.
- Furthermore, accelerating urbanization necessitates the development of smart water management networks. Implementing autonomous pressure management in municipal systems has been shown to decrease water leakage from aging pipes by more than 25%, addressing both resource scarcity and infrastructure integrity.
What are the market trends shaping the Intelligent Pump And Control Systems Industry?
- The proliferation of digital twin technology and virtualized hydraulic modeling is an upcoming market trend. This development enables predictive simulations and virtual optimization of complex fluid systems.
- Key market trends are centered on digitalization and new commercial models. The proliferation of digital twin technology allows operators to simulate hydraulic performance, with some firms reporting a 15% reduction in commissioning time. This virtualized approach, coupled with hydraulic modeling simulation, de-risks complex system upgrades.
- Another significant shift is the transition toward operational expenditure models, such as pump-as-a-service, which aligns provider and user incentives and can accelerate technology adoption. Technologically, the migration of control logic to the network edge is transforming system architecture.
- Edge computing in pumps enables autonomous decision making and instantaneous responses to process deviations, reducing latency by over 95% compared to cloud-based analysis. This decentralized control logic also enhances the cybersecurity of critical infrastructure protection by minimizing data transmission over external networks. These trends collectively foster a more resilient and proactive maintenance culture for intelligent pump and control systems.
What challenges does the Intelligent Pump And Control Systems Industry face during its growth?
- High initial capital expenditure and financial integration barriers are a key challenge affecting industry growth.
- Despite clear benefits, market adoption for intelligent pump and control systems faces significant challenges. The high initial capital expenditure for integrated software-hardware solutions is a primary barrier, with intelligent systems costing several times more than conventional alternatives.
- The technical complexity of these mechatronic system diagnostics creates a specialized labor shortage; some regions report a 40% gap in technicians skilled in both hydraulic engineering and firmware conflict resolution. This can lead to underutilization of advanced features. Moreover, the increasing connectivity of decentralized hydraulic networks introduces significant cybersecurity vulnerabilities.
- The convergence of OT and IT expands the attack surface, with reports indicating a 60% rise in threats against industrial control systems in recent years. Addressing these cyber-physical system security risks requires a multi-layered and costly approach, deterring adoption in highly regulated sectors where operational integrity is paramount.
Exclusive Technavio Analysis on Customer Landscape
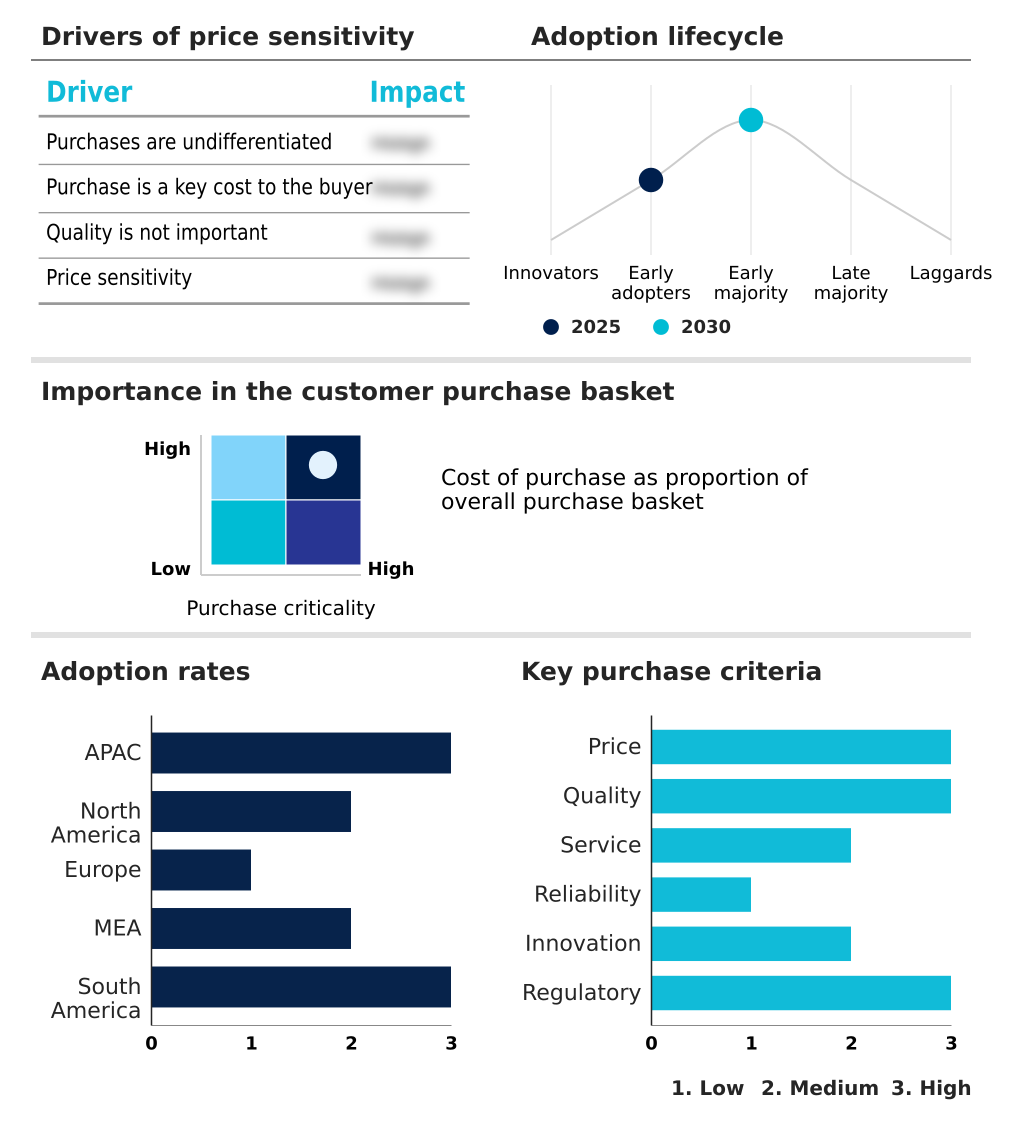
The intelligent pump and control systems market forecasting report includes the adoption lifecycle of the market, covering from the innovator’s stage to the laggard’s stage. It focuses on adoption rates in different regions based on penetration. Furthermore, the intelligent pump and control systems market report also includes key purchase criteria and drivers of price sensitivity to help companies evaluate and develop their market growth analysis strategies.
Customer Landscape of Intelligent Pump And Control Systems Industry
Competitive Landscape
Companies are implementing various strategies, such as strategic alliances, intelligent pump and control systems market forecast, partnerships, mergers and acquisitions, geographical expansion, and product/service launches, to enhance their presence in the industry.
ABB Ltd. - Intelligent pump and control systems, including variable speed drives and automated monitoring, are engineered to optimize efficiency, cut energy use, and boost operational reliability.
The industry research and growth report includes detailed analyses of the competitive landscape of the market and information about key companies, including:
- ABB Ltd.
- Alfa Laval AB
- CIRCOR International Inc.
- Emerson Electric Co.
- Flowserve Corp.
- Grundfos Holding AS
- ITT Inc.
- Kirloskar Brothers Ltd.
- KSB SE and Co. KGaA
- Liberty Pumps
- Nidec Corp.
- Pentair Plc
- S.A. Armstrong Ltd.
- Siemens AG
- Sulzer Ltd.
- Unico LLC
- Wanner Engineering Inc.
- Wilo SE
- Xylem Inc.
- Yaskawa Electric Corp.
Qualitative and quantitative analysis of companies has been conducted to help clients understand the wider business environment as well as the strengths and weaknesses of key industry players. Data is qualitatively analyzed to categorize companies as pure play, category-focused, industry-focused, and diversified; it is quantitatively analyzed to categorize companies as dominant, leading, strong, tentative, and weak.
Recent Development and News in Intelligent pump and control systems market
- In September, 2024, Siemens AG announced the acquisition of a specialized industrial cybersecurity firm to integrate advanced threat detection capabilities directly into its SINAMICS drive controllers and SCADA systems, addressing vulnerabilities in connected water infrastructure.
- In November, 2024, Xylem Inc. launched a new performance-based contract model, 'AquaFlow-as-a-Service,' targeting municipal water utilities in North America, aimed at reducing upfront capital expenditure for smart water network upgrades.
- In February, 2025, Grundfos Holding AS partnered with a leading Asian telecommunications provider to deploy a 5G-enabled remote monitoring platform for intelligent irrigation systems across several pilot projects in India, enhancing water management for precision agriculture.
- In April, 2025, Emerson Electric Co. released an updated version of its Plantweb digital ecosystem, featuring a high-fidelity digital twin module for centrifugal pumps, enabling operators to simulate performance under various process conditions and predict failures with greater accuracy.
Dive into Technavio’s robust research methodology, blending expert interviews, extensive data synthesis, and validated models for unparalleled Intelligent Pump And Control Systems Market insights. See full methodology.
| Market Scope | |
|---|---|
| Page number | 326 |
| Base year | 2025 |
| Historic period | 2020-2024 |
| Forecast period | 2026-2030 |
| Growth momentum & CAGR | Accelerate at a CAGR of 9.1% |
| Market growth 2026-2030 | USD 1317.4 million |
| Market structure | Fragmented |
| YoY growth 2025-2026(%) | 8.4% |
| Key countries | China, Japan, India, South Korea, Australia, Indonesia, US, Canada, Mexico, Germany, UK, France, Italy, Russia, The Netherlands, Saudi Arabia, UAE, South Africa, Nigeria, Egypt, Brazil, Argentina and Chile |
| Competitive landscape | Leading Companies, Market Positioning of Companies, Competitive Strategies, and Industry Risks |
Research Analyst Overview
- The market's evolution is defined by the integration of digital intelligence into hydraulic hardware, creating sophisticated mechatronic systems. The adoption of variable frequency drives and advanced pump controllers is foundational, enabling energy consumption optimization and precise real-time flow monitoring.
- A key trend is the use of predictive maintenance algorithms, which analyze high-fidelity sensor data to preemptively address issues like impeller cavitation detection, improving equipment uptime by as much as 30% in some industrial settings. Boardroom decisions are increasingly influenced by the capabilities of digital twin technology and hydraulic modeling simulation, which de-risk large capital projects.
- The shift toward decentralized control logic and edge computing in pumps enhances system resilience, while SCADA system integration and programmable logic controllers provide centralized oversight. These systems are crucial for applications ranging from boiler feed water control and precision dosing applications to slurry transport optimization and high-viscosity fluid handling.
- Water hammer mitigation, closed-loop feedback control, and autonomous pressure management are now standard features. Addressing firmware conflict resolution and ensuring cyber-physical system security are critical challenges. The underlying technology, from multi-pump controller logic to wire-to-water efficiency and net positive suction head monitoring, supports the broader goals of smart water grid management and creating self-optimizing hydraulic systems.
What are the Key Data Covered in this Intelligent Pump And Control Systems Market Research and Growth Report?
-
What is the expected growth of the Intelligent Pump And Control Systems Market between 2026 and 2030?
-
USD 1.32 billion, at a CAGR of 9.1%
-
-
What segmentation does the market report cover?
-
The report is segmented by Component (Intelligent pumps, and Control systems), Type (Centrifugal pumps, and Positive displacement pumps), End-user (Water and wastewater industry, Oil and gas industry, Chemical and petrochemical industry, Power industry, and Others), Application (Flow control, Liquid transfer, Pressure boosting, and Others) and Geography (APAC, North America, Europe, Middle East and Africa, South America)
-
-
Which regions are analyzed in the report?
-
APAC, North America, Europe, Middle East and Africa and South America
-
-
What are the key growth drivers and market challenges?
-
Imperative for energy efficiency and decarbonization in industrial operations, High initial capital expenditure and financial integration barriers
-
-
Who are the major players in the Intelligent Pump And Control Systems Market?
-
ABB Ltd., Alfa Laval AB, CIRCOR International Inc., Emerson Electric Co., Flowserve Corp., Grundfos Holding AS, ITT Inc., Kirloskar Brothers Ltd., KSB SE and Co. KGaA, Liberty Pumps, Nidec Corp., Pentair Plc, S.A. Armstrong Ltd., Siemens AG, Sulzer Ltd., Unico LLC, Wanner Engineering Inc., Wilo SE, Xylem Inc. and Yaskawa Electric Corp.
-
Market Research Insights
- The dynamics of the intelligent pump and control systems market are shaped by a move toward integrated software-hardware solutions and service-centric business models. Organizations are adopting these fluid management solutions not just as hardware upgrades but as key components of their sustainable industrial practices.
- The adoption of smart hydraulic networks has demonstrated tangible results; some industrial facilities report up to a 30% reduction in energy usage. Furthermore, the implementation of data-driven operational visibility through advanced industrial automation improves asset utilization by over 15% in certain applications. This shift is enabled by industrial communications protocols that support virtualized infrastructure management.
- While the initial investment in this digitalized fluid management can be high, the focus on total cost of ownership reduction and a proactive maintenance culture provides a clear long-term value proposition. The market is evolving to support resilient infrastructure design and automated resource management for a more efficient future.
We can help! Our analysts can customize this intelligent pump and control systems market research report to meet your requirements.
 RIA -
RIA - 
