
IT Asset Management Software Market Size 2025-2029
The it asset management software market size is forecast to increase by USD 737.6 million, at a CAGR of 9% between 2024 and 2029. Rapid adoption of asset management software and growing importance of asset tracking will drive the it asset management software market.
Major Market Trends & Insights
- APAC dominated the market and accounted for a 33% growth during the forecast period.
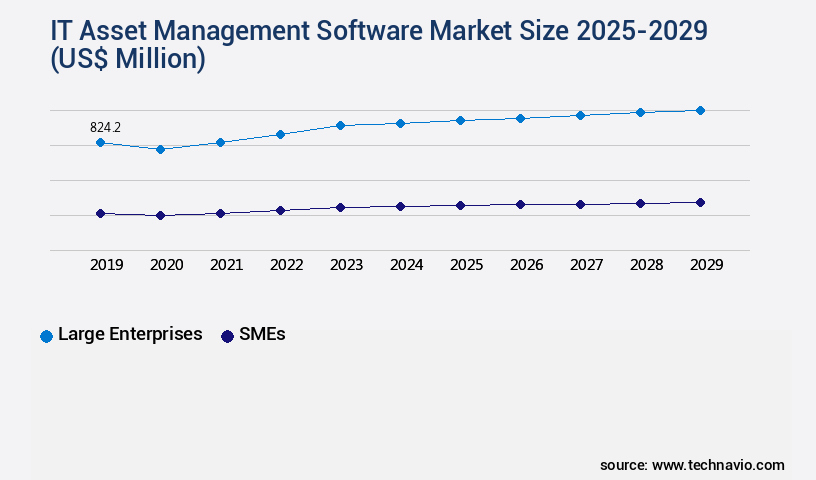
- By End-user - Large enterprises segment was valued at USD 824.20 million in 2023
- By Deployment - On-premises segment accounted for the largest market revenue share in 2023
Market Size & Forecast
- Market Opportunities: USD 90.75 million
- Market Future Opportunities: USD 737.60 million
- CAGR : 9%
- APAC: Largest market in 2023
Market Summary
- The market is experiencing rapid growth as organizations increasingly prioritize the efficient management of their technology assets. With the increasing need to comply with asset management standards and regulations, such as ISO 55000 and ITIL, businesses are turning to advanced IT asset management solutions to streamline their operations. However, the implementation of these systems comes with challenges, including integration with existing IT infrastructure and ensuring user adoption. Core technologies and applications, such as cloud-based solutions and IoT sensors, are transforming the market. According to recent studies, the cloud IT asset management market is projected to grow at a significant rate, reaching a market share of over 40% by 2025.
- Additionally, the market is witnessing increased adoption of artificial intelligence and machine learning technologies to automate asset discovery and optimization. Key companies in the market include IBM, Microsoft, and SAP. These companies are investing heavily in research and development to offer innovative solutions that cater to the evolving needs of businesses. Related markets such as the Enterprise Asset Management and IT Service Management markets are also experiencing similar trends. In the forecast period, major drivers for the market include the increasing complexity of IT environments, growing security concerns, and the need for cost savings. Challenges, however, include the high cost of implementation and the need for customization to fit specific business requirements.
- Despite these challenges, the market presents significant opportunities for growth and innovation.
What will be the Size of the IT Asset Management Software Market during the forecast period?

Get Key Insights on Market Forecast (PDF) Request Free Sample
How is the IT Asset Management Software Market Segmented and what are the key trends of market segmentation?
The it asset management software industry research report provides comprehensive data (region-wise segment analysis), with forecasts and estimates in "USD million" for the period 2025-2029, as well as historical data from 2019-2023 for the following segments.
- End-user
- Large enterprises
- SMEs
- Deployment
- On-premises
- Cloud
- Geography
- North America
- US
- Canada
- Europe
- France
- Germany
- Italy
- UK
- APAC
- China
- India
- Japan
- South Korea
- Rest of World (ROW)
- North America
By End-user Insights
The large enterprises segment is estimated to witness significant growth during the forecast period.
IT asset management software plays a crucial role in helping large enterprises effectively manage their extensive IT infrastructure and vast assets. In the global IT asset management market, sectors such as manufacturing, healthcare, finance, government, telecommunications, retail, technology, energy, transportation, and education are significant end-users. These organizations require dependable and scalable software solutions to automate their asset lifecycle operations, optimize asset utilization, and ensure compliance with licensing agreements. According to recent studies, the adoption of IT asset management software has increased by 18% among large enterprises. Moreover, industry forecasts suggest that the market for IT asset management software is expected to grow by 25% in the next three years.
This growth can be attributed to the increasing complexity of IT infrastructures and the need for real-time asset visibility. Key features of IT asset management software include automated asset detection, software license management, contract administration, and reporting capabilities. Additionally, these solutions offer data center optimization, security vulnerability management, hardware maintenance contracts, asset data normalization, IT asset auditing, centralized asset databases, mobile device management, risk management software, cloud asset management, hardware lifecycle management, asset retirement planning, compliance management software, asset value depreciation, help desk integration, endpoint security management, asset inventory management, and real-time asset visibility. Furthermore, IT asset management software enables organizations to optimize their software licenses, automate workflows, and monitor software usage.
Capacity planning tools and license optimization tools are essential components of these solutions, ensuring that organizations can make informed decisions regarding their IT infrastructure and software investments. In conclusion, IT asset management software is a vital tool for large enterprises seeking to manage their complex IT infrastructures and assets efficiently. With features such as automated asset detection, software license management, and real-time asset visibility, these solutions offer significant benefits to organizations in various sectors. The market for IT asset management software is expected to grow substantially in the coming years, reflecting the increasing demand for dependable and scalable software solutions.

The Large enterprises segment was valued at USD 824.20 million in 2019 and showed a gradual increase during the forecast period.
Regional Analysis
APAC is estimated to contribute 33% to the growth of the global market during the forecast period.Technavio's analysts have elaborately explained the regional trends and drivers that shape the market during the forecast period.

See How IT Asset Management Software Market Demand is Rising in APAC Request Free Sample
The market in North America is experiencing significant growth, with a substantial market share attributed to this region. Key factors driving this expansion include the presence of numerous IT companies, technological advances such as digitalization in the US and Canada, and the need to minimize operational costs and optimize asset utilization. The region's market growth is further fueled by the presence of major players in the IT asset management software industry. According to recent studies, the North American market is expected to witness a substantial number of new implementations and upgrades, with an estimated 30% of organizations planning to invest in IT asset management software in the upcoming year.
Additionally, the market is projected to experience a steady increase in demand for cloud-based solutions, with approximately 45% of businesses expressing interest in adopting cloud IT asset management systems.
Market Dynamics
Our researchers analyzed the data with 2024 as the base year, along with the key drivers, trends, and challenges. A holistic analysis of drivers will help companies refine their marketing strategies to gain a competitive advantage.
An automated IT asset discovery process is a core component of modern IT asset management, enabling organizations to improve IT asset visibility and control across their infrastructure. Implementing robust security vulnerability management and maintaining IT asset compliance with regulations helps mitigate risk, with some companies reporting a 25% reduction in security incidents.
For instance, optimizing software license utilization and automating asset procurement and provisioning can lead to a 10-15% reduction in IT asset total cost of ownership. Effective hardware lifecycle management strategies are crucial for ensuring data security and privacy during IT asset retirement and disposal. By integrating ITAM with help desk systems, organizations can streamline operations, enhancing IT asset utilization rate and measuring ROI of IT asset management software.
With the market expected to grow at a CAGR of 23.3% over the next five years, the future looks bright for ITAM software providers and their customers.
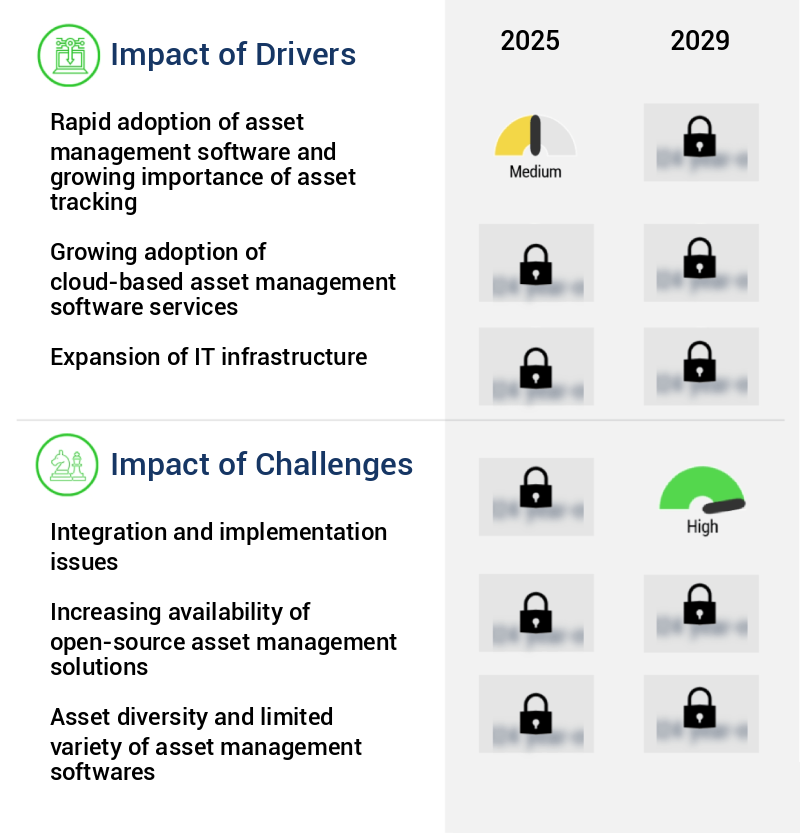
What are the key market drivers leading to the rise in the adoption of IT Asset Management Software Industry?
- The rapid adoption of asset management software and the growing importance of asset tracking are primary drivers propelling market growth in this sector.
- In today's business landscape, managing and tracking IT assets has become a complex task for organizations, regardless of their size or industry. Traditional methods, such as using Excel sheets, are no longer sufficient due to the proliferation of IT devices, the adoption of intricate cloud technologies, and the constant updates of license-based software. Consequently, IT asset management software has emerged as a valuable solution for streamlining this process. These systems are designed to automate the collection and analysis of information related to the location, configuration, and identification of computer hardware and software. By reducing the manual labor involved and increasing the accuracy and completeness of data, IT asset management software offers numerous benefits to organizations.
- It enables better resource allocation, optimizes license usage, and ensures compliance with software agreements. Additionally, it facilitates the identification of potential security vulnerabilities and helps maintain an up-to-date inventory of IT assets. As organizations continue to adopt digital transformation initiatives and rely more on technology, the importance of effective IT asset management cannot be overstated. By implementing an IT asset management system, businesses can gain valuable insights into their IT infrastructure, optimize their IT spend, and ultimately, improve their overall operational efficiency.
What are the market trends shaping the IT Asset Management Software Industry?
- The increasing requirement for adherence to asset management standards represents a significant market trend. Compliance with asset management standards is becoming increasingly necessary in the market.
- Assets are essential for organizations to accomplish their business objectives, encompassing physical, financial, and intangible entities. Effective asset management optimizes their utilization and eventual disposal or renewal. In the IT sector, financial management and IT asset management are pivotal for risk mitigation. One significant risk lies in software license compliance. Inaccurate information can lead organizations to over-deploy software, exposing them to legal, financial, and reputational risks. The asset management system incorporates coordinated planning, asset selection, and utilization. IT financial management and IT asset management are integral components, ensuring information security and disaster recovery.
- By maintaining a robust and up-to-date asset inventory, organizations can minimize risks, optimize costs, and enhance overall efficiency. In the dynamic business landscape, continuous monitoring and adaptability are essential for effective asset management.
What challenges does the IT Asset Management Software Industry face during its growth?
- The integration and implementation of new technologies and processes are significant challenges that can hinder industry growth, requiring careful planning and execution to ensure a seamless transition.
- IT asset management software has become an essential tool for enterprises to optimize their IT infrastructure. However, the process of choosing the right software solution poses a significant challenge for organizations. Failure to identify business requirements and evaluate the capabilities and limitations of available options may lead to ineffective implementations. Consequently, the implemented software may not meet the intended business objectives. Additionally, integrating IT asset management software into existing business applications presents another hurdle for organizations due to the complexity of customization and the lack of expertise. This challenge hampers the expansion of the market. The market is expected to experience steady growth, with an increasing number of organizations recognizing the importance of IT asset management in enhancing operational efficiency and reducing costs.
- Despite this trend, the integration issue persists, highlighting the need for improved knowledge transfer and collaboration between IT and business teams.
Exclusive Customer Landscape
The it asset management software market forecasting report includes the adoption lifecycle of the market, covering from the innovator's stage to the laggard's stage. It focuses on adoption rates in different regions based on penetration. Furthermore, the it asset management software market report also includes key purchase criteria and drivers of price sensitivity to help companies evaluate and develop their market growth analysis strategies.

Customer Landscape of IT Asset Management Software Industry
Competitive Landscape & Market Insights
Companies are implementing various strategies, such as strategic alliances, it asset management software market forecast, partnerships, mergers and acquisitions, geographical expansion, and product/service launches, to enhance their presence in the industry.
Aptean - The company specializes in IT asset management solutions, including BMC Helix ITSM, a cloud-native IT service management system. This software enhances productivity and fosters innovation by streamlining IT operations and optimizing resource utilization.
The industry research and growth report includes detailed analyses of the competitive landscape of the market and information about key companies, including:
- Aptean
- BMC Software Inc.
- Certero Ltd.
- Datalogic SpA
- Dell Technologies Inc.
- Flexera Software LLC
- Freshworks Inc.
- Hewlett Packard Enterprise Co.
- Hexagon AB
- International Business Machines Corp.
- InvGate
- Ivanti Software Inc.
- Microsoft Corp.
- Oracle Corp.
- SAP SE
- ServiceNow Inc.
- Snow Software
- SolarWinds Corp.
- SymphonyAI Summit
- SysAid Technologies Ltd
Qualitative and quantitative analysis of companies has been conducted to help clients understand the wider business environment as well as the strengths and weaknesses of key industry players. Data is qualitatively analyzed to categorize companies as pure play, category-focused, industry-focused, and diversified; it is quantitatively analyzed to categorize companies as dominant, leading, strong, tentative, and weak.
Recent Development and News in IT Asset Management Software Market
- In January 2024, IBM announced the acquisition of Waelick Communications, a leading IT asset disposition (ITAD) and lifecycle services provider, to strengthen its IT asset management (ITAM) capabilities and offerings (IBM Press Release). This strategic move aimed to provide IBM clients with end-to-end ITAM services, from acquisition to disposal.
- In March 2024, ServiceNow unveiled its new IT Asset Management application, which integrated with its IT Service Management platform. This development allowed customers to manage their hardware, software, and cloud assets within the same platform, streamlining IT operations and improving asset visibility (ServiceNow Press Release).
- In May 2024, Snow Software, a leading ITAM solutions provider, raised USD150 million in a funding round led by EQT Growth. This investment will support Snow Software's continued growth and product innovation, as well as potential acquisitions (Snow Software Press Release).
- In April 2025, Microsoft and SAP announced a strategic partnership to integrate Microsoft's Configuration Manager with SAP's Solution Manager. This collaboration enables customers to manage their SAP applications and associated IT assets using Microsoft's Configuration Manager, enhancing ITAM efficiency and reducing complexity (Microsoft News Center).
Dive into Technavio's robust research methodology, blending expert interviews, extensive data synthesis, and validated models for unparalleled IT Asset Management Software Market insights. See full methodology.
|
Market Scope |
|
|
Report Coverage |
Details |
|
Page number |
200 |
|
Base year |
2024 |
|
Historic period |
2019-2023 |
|
Forecast period |
2025-2029 |
|
Growth momentum & CAGR |
Accelerate at a CAGR of 9% |
|
Market growth 2025-2029 |
USD 737.6 million |
|
Market structure |
Fragmented |
|
YoY growth 2024-2025(%) |
8.0 |
|
Key countries |
US, Canada, China, UK, Japan, India, France, Germany, Italy, and South Korea |
|
Competitive landscape |
Leading Companies, Market Positioning of Companies, Competitive Strategies, and Industry Risks |
Research Analyst Overview
- In the dynamic and evolving IT asset management (ITAM) landscape, various strategies and technologies continue to shape the market. One significant area of focus is the optimization of IT assets through depreciation calculation methods, ensuring accurate financial reporting and effective resource allocation. Another critical aspect is security vulnerability management, mitigating risks and maintaining the integrity of IT infrastructure. IT asset disposal and hardware maintenance contracts are essential components of ITAM, facilitating efficient asset retirement planning and reducing total cost of ownership. Asset data normalization and centralized asset databases enable seamless integration with other IT systems, such as mobile device management, software license management, and capacity planning tools.
- Risk management software, data center optimization, and endpoint security management are increasingly important as businesses strive for real-time asset visibility and improved compliance management. Automated workflows and license optimization tools streamline ITAM processes, while change management processes and software usage monitoring enhance operational efficiency. Cloud asset management and company contract management are crucial for organizations adopting cloud services, ensuring effective cost control and contract compliance. Asset inventory management and asset utilization reporting provide valuable insights into IT asset usage and trends, enabling informed decision-making and strategic planning. ITAM best practices emphasize the importance of data loss prevention, software renewal management, and compliance management software to maintain regulatory compliance and protect sensitive data.
- Hardware lifecycle management and asset retirement planning are essential for maximizing the value of IT assets and minimizing unnecessary expenses. In summary, the IT asset management market is characterized by ongoing innovation and the integration of various strategies and technologies to optimize IT assets, enhance security, and improve operational efficiency.
What are the Key Data Covered in this IT Asset Management Software Market Research and Growth Report?
-
What is the expected growth of the IT Asset Management Software Market between 2025 and 2029?
-
USD 737.6 million, at a CAGR of 9%
-
-
What segmentation does the market report cover?
-
The report segmented by End-user (Large enterprises and SMEs), Deployment (On-premises and Cloud), and Geography (North America, Europe, APAC, Middle East and Africa, and South America)
-
-
Which regions are analyzed in the report?
-
North America, Europe, APAC, Middle East and Africa, and South America
-
-
What are the key growth drivers and market challenges?
-
Rapid adoption of asset management software and growing importance of asset tracking, Integration and implementation issues
-
-
Who are the major players in the IT Asset Management Software Market?
-
Key Companies Aptean, BMC Software Inc., Certero Ltd., Datalogic SpA, Dell Technologies Inc., Flexera Software LLC, Freshworks Inc., Hewlett Packard Enterprise Co., Hexagon AB, International Business Machines Corp., InvGate, Ivanti Software Inc., Microsoft Corp., Oracle Corp., SAP SE, ServiceNow Inc., Snow Software, SolarWinds Corp., SymphonyAI Summit, and SysAid Technologies Ltd
-
Market Research Insights
- In the dynamic the market, businesses seek solutions to optimize software licenses, monitor performance, and track asset lifecycles. According to recent studies, over 60% of organizations have reported improved software license compliance since implementing such software. Looking ahead, market growth is projected to exceed 15% annually. Effective IT asset governance encompasses various features, including financial reporting tools, vulnerability remediation, and security incident response. These capabilities enable businesses to maintain data security policies, negotiate contracts, and manage service level agreements. Furthermore, cloud cost optimization, risk mitigation strategies, and the asset retirement process are essential components, ensuring efficient data center consolidation and capacity planning.
- Software inventory management and hardware inventory management are integral parts of IT asset management. These functions facilitate hardware maintenance scheduling, procurement automation, change management automation, and usage metrics tracking. Additionally, IT asset dashboards, company relationship management, and regulatory compliance audits offer valuable insights, while contract expiration alerts help businesses stay informed and avoid potential financial risks.
We can help! Our analysts can customize this it asset management software market research report to meet your requirements.
 RIA -
RIA - 
