
IT Operation Analytics (ITOA) Market Size 2025-2029
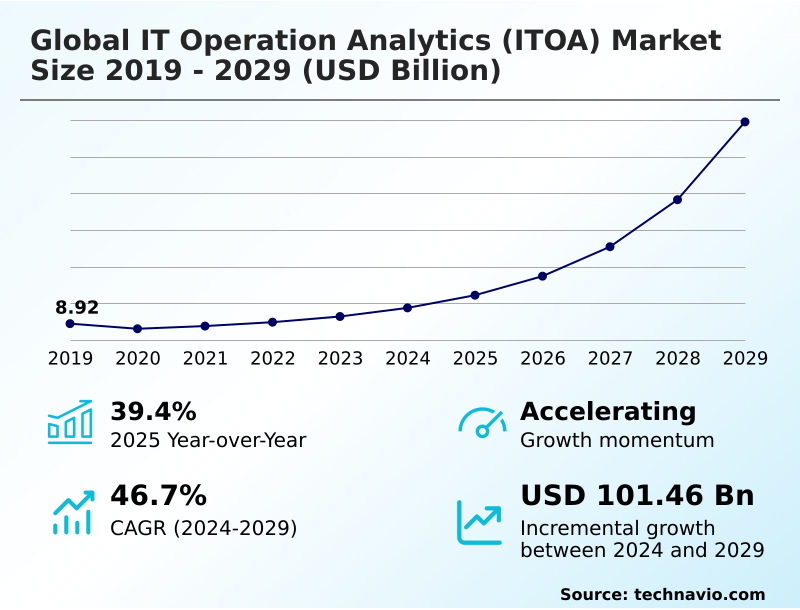
The it operation analytics (itoa) market size is valued to increase by USD 101.46 billion, at a CAGR of 46.7% from 2024 to 2029. Increasing complexity of hybrid and multi-cloud environments will drive the it operation analytics (itoa) market.
Major Market Trends & Insights
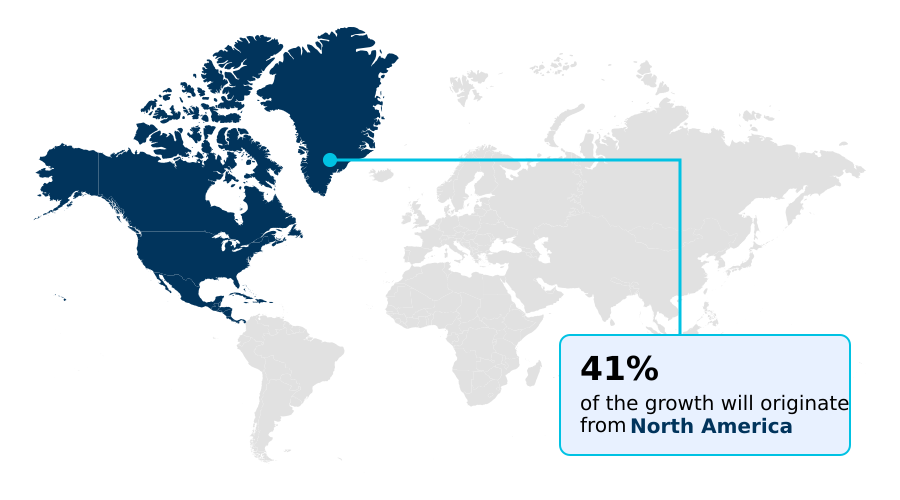
- North America dominated the market and accounted for a 41.3% growth during the forecast period.
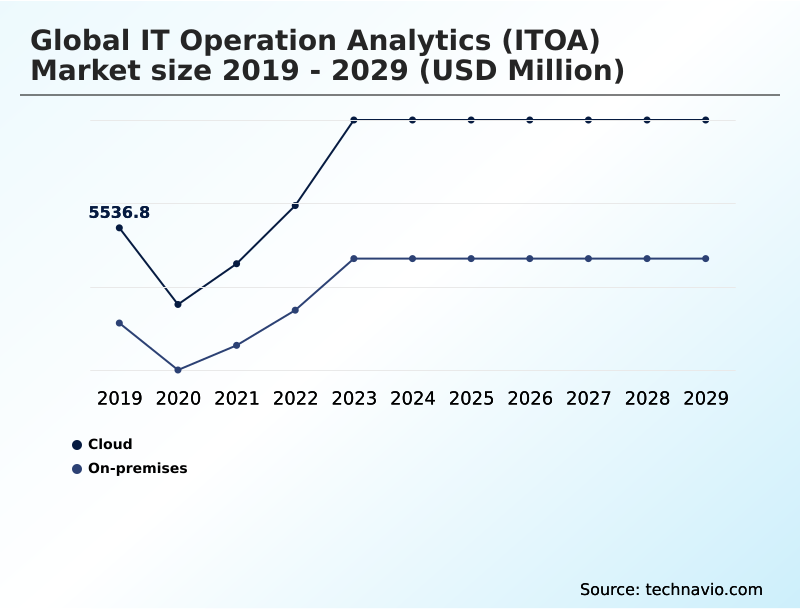
- By Deployment - Cloud segment was valued at USD 7.98 billion in 2023
- By Component - Solution segment accounted for the largest market revenue share in 2023
Market Size & Forecast
- Market Opportunities: USD 110.06 billion
- Market Future Opportunities: USD 101.46 billion
- CAGR from 2024 to 2029 : 46.7%
Market Summary
- The IT Operation Analytics (ITOA) market is defined by an imperative for digital resilience amid escalating operational complexity. Organizations are moving beyond traditional monitoring, adopting advanced observability platforms to gain full-stack observability across distributed systems. This involves ingesting vast streams of telemetry data, including logs, metrics, and distributed tracing, to power root cause analysis and predictive analytics.
- A core application is in financial services, where a firm must ensure uninterrupted digital services to maintain customer trust and meet regulatory compliance. By leveraging an AIOps platform, the firm can perform real-time anomaly detection on transaction performance, correlate events across its hybrid cloud infrastructure, and trigger intelligent automation to preemptively resolve issues before they impact customers.
- This shift from reactive firefighting to proactive problem resolution, driven by AI-driven insights and network visibility, is central to modern IT strategy. The convergence of observability and security, often through integrated Security Information and Event Management (SIEM) capabilities, further underscores the market's strategic importance in managing both performance and risk, including mainframe operational intelligence.
- The adoption of the OpenTelemetry standard is also helping to reduce vendor lock-in and foster more flexible, best-of-breed toolchains.
What will be the Size of the IT Operation Analytics (ITOA) Market during the forecast period?
Get Key Insights on Market Forecast (PDF) Get Free Sample
How is the IT Operation Analytics (ITOA) Market Segmented?
The it operation analytics (itoa) industry research report provides comprehensive data (region-wise segment analysis), with forecasts and estimates in "USD million" for the period 2025-2029, as well as historical data from 2019-2023 for the following segments.
- Deployment
- Cloud
- On-premises
- Component
- Solution
- Services
- Organization size
- Large enterprises
- SMEs
- Geography
- North America
- US
- Canada
- Mexico
- Europe
- UK
- Germany
- France
- APAC
- China
- Japan
- India
- Middle East and Africa
- Saudi Arabia
- UAE
- South Africa
- South America
- Brazil
- Argentina
- Colombia
- Rest of World (ROW)
- North America
By Deployment Insights
The cloud segment is estimated to witness significant growth during the forecast period.
The IT Operation Analytics (ITOA) market is segmented by deployment, with the cloud model driving significant adoption. This is propelled by enterprise-wide digital transformation journeys and the need for scalable, agile operational intelligence.
Organizations are embracing complex multi-cloud and hybrid-cloud strategies, which escalates the demand for sophisticated, cloud-native AIOps platforms. This environment requires end-to-end visibility and a unified analytics approach to manage infrastructure health and application performance monitoring (APM).
The move toward subscription-based licensing further accelerates cloud adoption.
Effectively leveraging a cloud-native architecture for ITOA has been shown to improve configuration risk intelligence, with some organizations identifying critical misconfigurations 2x faster than with legacy on-premises tools, showcasing the efficiency gains from this deployment model and the importance of proactive problem resolution and data silo integration.

The Cloud segment was valued at USD 7.98 billion in 2023 and showed a gradual increase during the forecast period.
Regional Analysis
North America is estimated to contribute 41.3% to the growth of the global market during the forecast period.Technavio’s analysts have elaborately explained the regional trends and drivers that shape the market during the forecast period.
See How IT Operation Analytics (ITOA) Market Demand is Rising in North America Get Free Sample
Geographically, the market is led by North America, which represents a substantial portion of the opportunity, accounting for over 41% of the incremental growth.
This dominance is driven by a high concentration of large enterprises with complex, containerized environments and a mature adoption curve for cloud-native architecture.
The region is a hotbed for innovation in areas like digital employee experience (DEX) and low-code workflow automation. The strong focus on IT service management (ITSM) integration and achieving digital resilience fuels intense demand for sophisticated ITOA solutions.
Consequently, the competitive landscape is heavily influenced by large-scale platform consolidation and a strategic push for full-stack observability, setting global benchmarks for incident management and service-level monitoring, particularly in the US and Canada.
Market Dynamics
Our researchers analyzed the data with 2024 as the base year, along with the key drivers, trends, and challenges. A holistic analysis of drivers will help companies refine their marketing strategies to gain a competitive advantage.
- Successfully navigating the global IT operation analytics (ITOA) market 2025-2029 requires a strategic approach that begins with building a business case for observability. Organizations must evaluate their needs, with many creating AIOps platform vendor comparison criteria to assess capabilities. A primary focus is finding an AIOps platform for multi-cloud environments that can handle modern complexity.
- Key ITOA implementation best practices emphasize the need for integrating observability with security operations to create a unified defense posture. A significant challenge involves migrating from legacy monitoring to AIOps, a process that often requires a parallel focus on ITOA for mainframe modernization projects.
- Throughout this journey, automating root cause analysis with machine learning is a critical goal for reducing manual toil. Another priority is using predictive analytics for capacity planning to avoid overprovisioning. The generative AI impact on IT operations skills cannot be understated, as teams must adapt to new workflows.
- A common objective is correlating network performance with application experience to understand true user impact. For many, managing digital experience with endpoint analytics becomes a key differentiator. Furthermore, the ability of a unified monitoring for hybrid IT infrastructure to deliver predictive alerting to prevent system outages is a core value proposition.
- The impact of OpenTelemetry on vendor lock-in is a major consideration, giving enterprises more flexibility. Projects leveraging low-code automation for network operations have been shown to complete over 20% faster than those relying solely on traditional scripting. The end-to-end process also involves ensuring compliance with configuration intelligence and securing cloud-native applications with NDR.
- Finally, using cloud observability tools for cost optimization and understanding the value of generative AI for IT incident response are becoming standard practice for mature organizations.
What are the key market drivers leading to the rise in the adoption of IT Operation Analytics (ITOA) Industry?
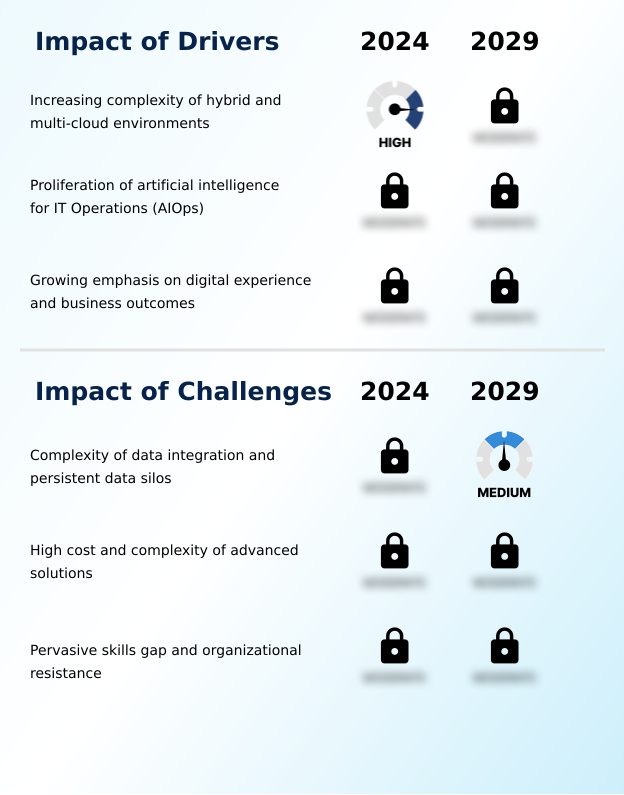
- The escalating complexity inherent in managing hybrid and multi-cloud environments serves as the primary driver for the widespread adoption of advanced IT operation analytics solutions.
- The primary driver for the global IT operation analytics (ITOA) market 2025-2029 is the unmanageable complexity of modern IT environments.
- As enterprises advance their digital transformation journey, the proliferation of hybrid cloud monitoring and multi-cloud management strategies creates an explosion in telemetry data. Traditional, siloed tools are ineffective for providing the end-to-end visibility required for effective workload management.
- Advanced ITOA solutions address this by offering unified analytics and cross-domain insights. Implementing a modern AIOps platform has been shown to reduce alert noise from disparate systems by over 75%, allowing teams to focus on genuine threats.
- Furthermore, organizations with mature ITOA capabilities improve their incident management efficiency, reducing mean-time-to-resolution by an average of 45% by leveraging real-time anomaly detection.
What are the market trends shaping the IT Operation Analytics (ITOA) Industry?
- The integration of generative AI into AIOps platforms is emerging as a transformative market trend. This evolution promises to significantly enhance intelligent automation and accelerate proactive problem resolution.
- A pivotal trend reshaping the market is the integration of generative AI, which is evolving AIOps from a data analysis tool into an interactive operational partner. The introduction of a generative AI assistant into an observability platform is creating conversational AI for IT, allowing operators to diagnose issues using natural language.
- This intelligent automation is streamlining threat hunting workflows and incident response, with early adopters reporting that these tools can accelerate root cause identification by up to 50%. Moreover, these systems are beginning to handle automated remediation for common issues, with projections suggesting they can resolve nearly 30% of routine alerts without human intervention.
- This trend, supported by a cloud-native architecture, is enhancing predictive analytics and is crucial for achieving proactive problem resolution in complex technology stacks.
What challenges does the IT Operation Analytics (ITOA) Industry face during its growth?
- The significant complexity of data integration and the persistence of data silos across disparate IT domains present a formidable challenge to realizing the full value of the market.
- A significant challenge restraining market potential is the deep-rooted issue of data silo integration and the pervasive skills gap. Creating a unified dataset for analysis by breaking down silos between networking, applications, and security often consumes up to 40% of the initial deployment effort for an AIOps platform.
- Even with a consolidated data stream, many organizations lack the in-house expertise for advanced AI-driven insights. This pervasive skills shortage for roles proficient in log management and event correlation can delay the realization of ROI by as much as 18 months.
- Addressing this requires not only technology that simplifies data integration, such as the OpenTelemetry standard, but also a focus on low-code workflow automation to empower existing teams, ensuring business outcome alignment.
Exclusive Technavio Analysis on Customer Landscape
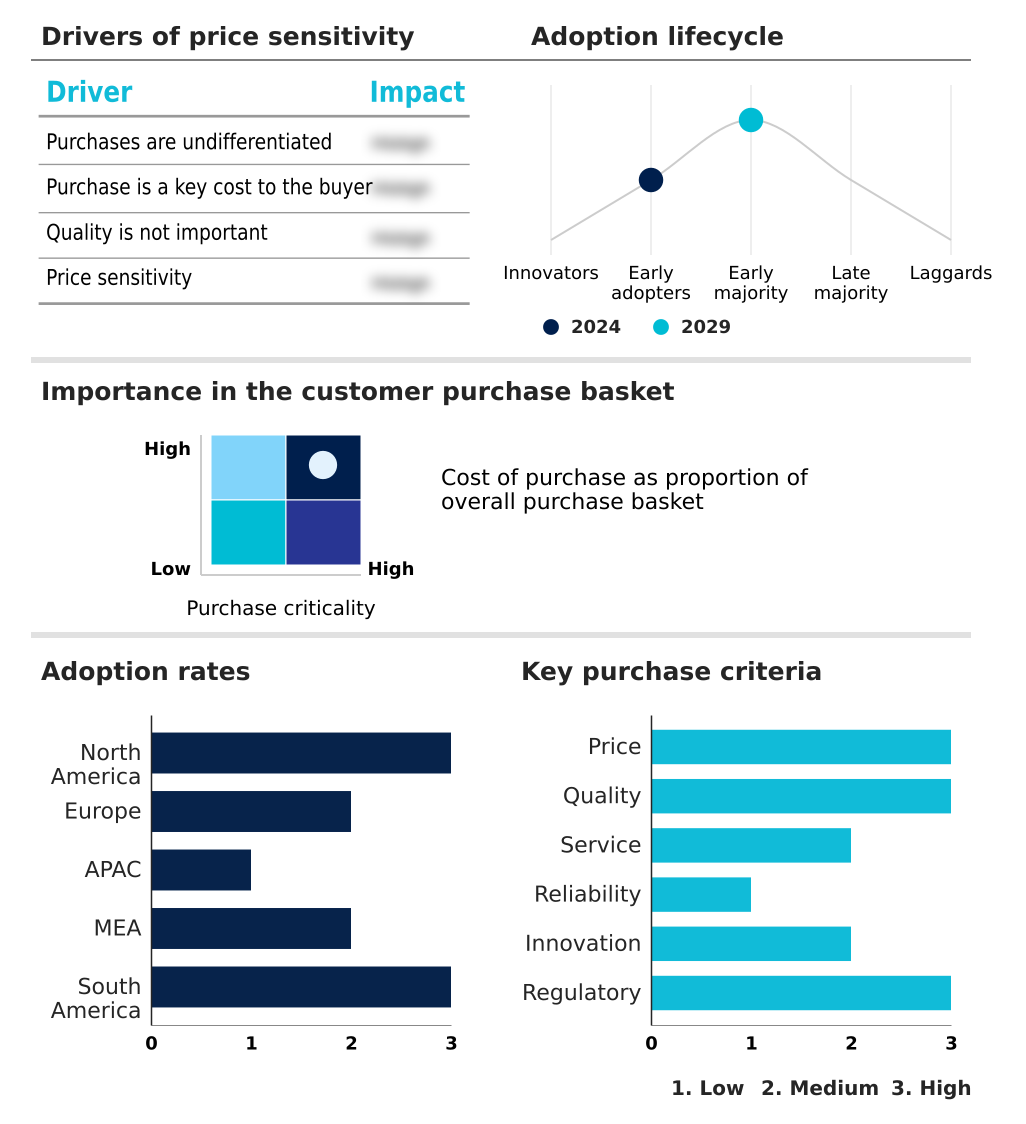
The it operation analytics (itoa) market forecasting report includes the adoption lifecycle of the market, covering from the innovator’s stage to the laggard’s stage. It focuses on adoption rates in different regions based on penetration. Furthermore, the it operation analytics (itoa) market report also includes key purchase criteria and drivers of price sensitivity to help companies evaluate and develop their market growth analysis strategies.
Customer Landscape of IT Operation Analytics (ITOA) Industry
Competitive Landscape
Companies are implementing various strategies, such as strategic alliances, it operation analytics (itoa) market forecast, partnerships, mergers and acquisitions, geographical expansion, and product/service launches, to enhance their presence in the industry.
Broadcom Inc. - Delivers IT operation analytics and AI-powered intelligence for managing mainframe resources, optimizing capacity, and ensuring operational stability in complex enterprise environments.
The industry research and growth report includes detailed analyses of the competitive landscape of the market and information about key companies, including:
- Broadcom Inc.
- Cisco Systems Inc.
- Evolven Software Inc.
- ExtraHop Networks Inc.
- Hitachi Ltd.
- IBM Corp.
- Microsoft Corp.
- Moogsoft Inc.
- Nastel Technologies Inc.
- NetApp Inc.
- Nexthink SA
- Open Text Corp.
- Oracle Corp.
- Resolve Systems LLC
- SAP SE
- SAS Institute Inc.
- Splunk Inc.
Qualitative and quantitative analysis of companies has been conducted to help clients understand the wider business environment as well as the strengths and weaknesses of key industry players. Data is qualitatively analyzed to categorize companies as pure play, category-focused, industry-focused, and diversified; it is quantitatively analyzed to categorize companies as dominant, leading, strong, tentative, and weak.
Recent Development and News in It operation analytics (itoa) market
- In August, 2024, IBM Corp. announced the full integration of its watsonx generative AI assistant across the entire IBM Cloud Pak portfolio, enabling conversational AI for IT and automated remediation script generation.
- In November, 2024, Cisco Systems Inc. launched its 'Security-as-a-Service' platform, a new offering that fully combines the network visibility of its legacy products with the SIEM and proactive threat prediction capabilities acquired from Splunk.
- In January, 2025, Broadcom Inc. revealed a strategic partnership with a leading public cloud provider to offer VMware Cloud Foundation as a managed service, simplifying hybrid cloud monitoring for large enterprises.
- In April, 2025, ExtraHop Networks Inc. closed a $200 million funding round led by major venture capital firms to expand its network detection and response (NDR) platform and further develop its threat hunting workflows for multi-cloud environments.
Dive into Technavio’s robust research methodology, blending expert interviews, extensive data synthesis, and validated models for unparalleled IT Operation Analytics (ITOA) Market insights. See full methodology.
| Market Scope | |
|---|---|
| Page number | 282 |
| Base year | 2024 |
| Historic period | 2019-2023 |
| Forecast period | 2025-2029 |
| Growth momentum & CAGR | Accelerate at a CAGR of 46.7% |
| Market growth 2025-2029 | USD 101457.8 million |
| Market structure | Fragmented |
| YoY growth 2024-2025(%) | 39.4% |
| Key countries | US, Canada, Mexico, UK, Germany, France, Italy, The Netherlands, Spain, China, Japan, India, South Korea, Australia, Indonesia, Saudi Arabia, UAE, South Africa, Israel, Turkey, Brazil, Argentina and Colombia |
| Competitive landscape | Leading Companies, Market Positioning of Companies, Competitive Strategies, and Industry Risks |
Research Analyst Overview
- The IT Operation Analytics (ITOA) market is fundamentally driven by the need to achieve digital resilience in profoundly complex digital ecosystems. Organizations are leveraging advanced observability platforms to gain full-stack observability, which is critical for maintaining infrastructure health and ensuring high-quality application performance monitoring (APM).
- This process hinges on the effective collection and analysis of telemetry data, including comprehensive log management and distributed tracing. The real value is unlocked when an AIOps platform applies event correlation and predictive analytics to this data, enabling proactive threat prediction and intelligent automation. This moves teams beyond reactive incident management to a state of proactive operational control.
- A key element is network visibility, which, when combined with security information and event management (SIEM), provides the cross-domain insights necessary to manage both performance and security. For instance, firms that properly implement real-time anomaly detection and configuration risk intelligence report a 60% reduction in critical, business-impacting outages.
- The ability to perform sophisticated network detection and response (NDR) and service-level monitoring, even for legacy systems through mainframe operational intelligence, is what defines a mature operational intelligence capability and justifies boardroom-level investment in these strategic platforms.
What are the Key Data Covered in this IT Operation Analytics (ITOA) Market Research and Growth Report?
-
What is the expected growth of the IT Operation Analytics (ITOA) Market between 2025 and 2029?
-
USD 101.46 billion, at a CAGR of 46.7%
-
-
What segmentation does the market report cover?
-
The report is segmented by Deployment (Cloud, and On-premises), Component (Solution, and Services), Organization Size (Large enterprises, and SMEs) and Geography (North America, Europe, APAC, Middle East and Africa, South America)
-
-
Which regions are analyzed in the report?
-
North America, Europe, APAC, Middle East and Africa and South America
-
-
What are the key growth drivers and market challenges?
-
Increasing complexity of hybrid and multi-cloud environments, Complexity of data integration and persistent data silos
-
-
Who are the major players in the IT Operation Analytics (ITOA) Market?
-
Broadcom Inc., Cisco Systems Inc., Evolven Software Inc., ExtraHop Networks Inc., Hitachi Ltd., IBM Corp., Microsoft Corp., Moogsoft Inc., Nastel Technologies Inc., NetApp Inc., Nexthink SA, Open Text Corp., Oracle Corp., Resolve Systems LLC, SAP SE, SAS Institute Inc. and Splunk Inc.
-
Market Research Insights
- Market dynamics are increasingly shaped by platform consolidation and the pursuit of tangible business outcome alignment. The shift toward unified analytics platforms that combine hybrid cloud monitoring, security, and observability is compelling organizations to rethink their tooling strategies. Adopting these integrated solutions for multi-cloud management has been shown to reduce mean-time-to-resolution by over 35% compared to siloed approaches.
- Furthermore, the integration of FinOps principles within these platforms is gaining traction, with early adopters reporting an average 15% reduction in unnecessary cloud expenditures through better workload management and resource visibility.
- This demonstrates a clear trend where investment in advanced ITOA is justified not just by technical metrics but by measurable improvements in operational efficiency and financial governance, driving the digital transformation journey forward.
We can help! Our analysts can customize this it operation analytics (itoa) market research report to meet your requirements.
 RIA -
RIA - 
