Machine Identity Management Market Analysis, Size, and Forecast 2026-2030: North America (US, Canada, and Mexico), Europe (Germany, UK, and France), APAC (China, Japan, and India), Middle East and Africa (Saudi Arabia, UAE, and South Africa), South America (Brazil, Argentina, and Colombia), and Rest of World (ROW)

Machine Identity Management Market Analysis, Size, and Forecast 2026-2030:
North America (US, Canada, and Mexico), Europe (Germany, UK, and France), APAC (China, Japan, and India), Middle East and Africa (Saudi Arabia, UAE, and South Africa), South America (Brazil, Argentina, and Colombia), and Rest of World (ROW)

Published: May 2026 299 Pages SKU: IRTNTR81475

Market Overview at a Glance

$14.33 B
Market Opportunity
11.9%
CAGR 2025 - 2030
32.5%
North America Growth
$11.40 B
Solutions segment 2024

Machine Identity Management Market Size 2026-2030

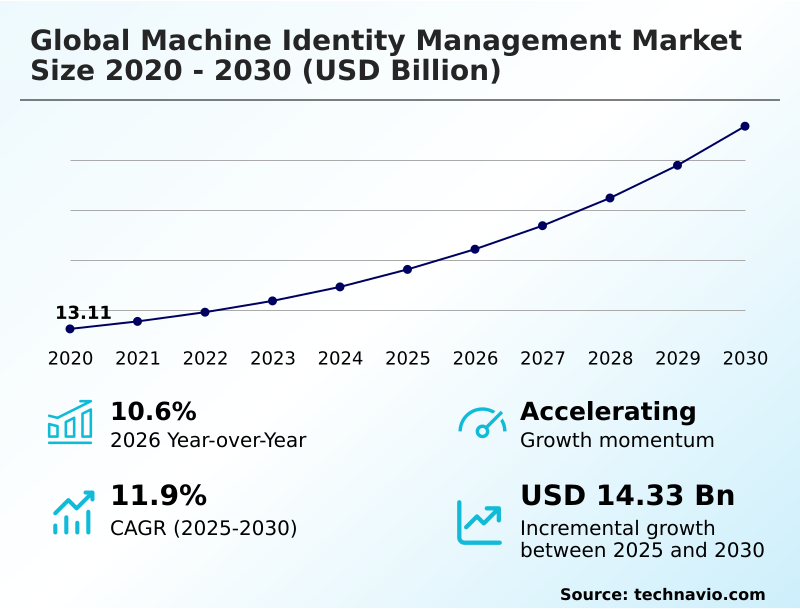
The machine identity management market size is valued to increase by USD 14.33 billion, at a CAGR of 11.9% from 2025 to 2030. Proliferation of cloud computing, containers, and devops practices will drive the machine identity management market.

Major Market Trends & Insights

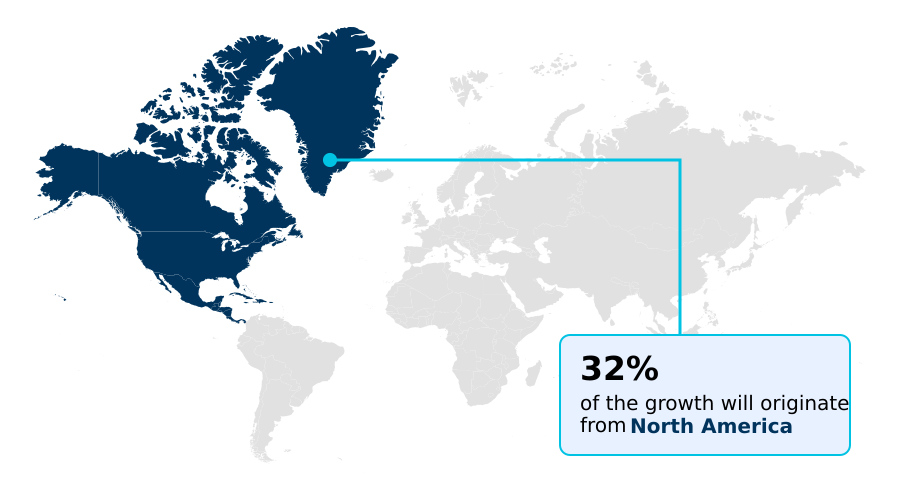
  • North America dominated the market and accounted for a 32.5% growth during the forecast period.
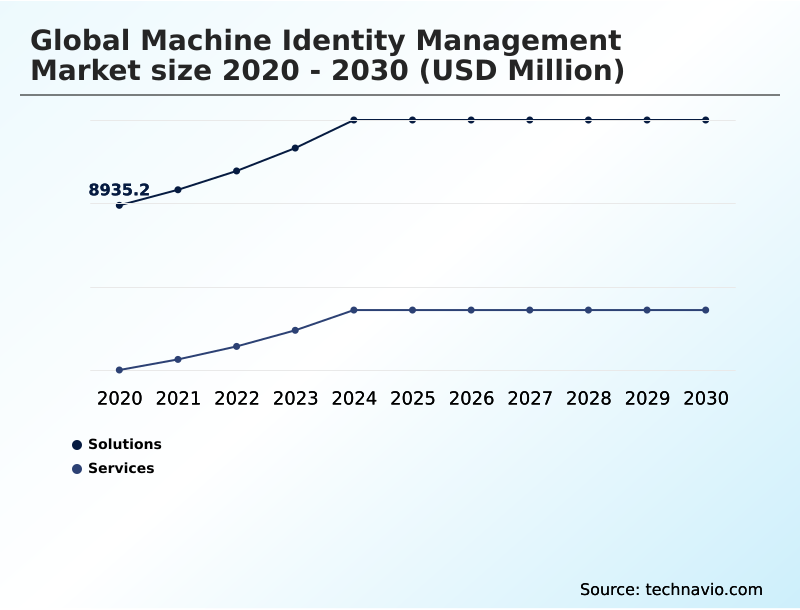
  • By Component - Solutions segment was valued at USD 11.40 billion in 2024
  • By Deployment - On-premises segment accounted for the largest market revenue share in 2024

Market Size & Forecast

  • Market Opportunities: USD 20.28 billion
  • Market Future Opportunities: USD 14.33 billion
  • CAGR from 2025 to 2030 : 11.9%

Market Summary

  • The machine identity management market is undergoing a fundamental shift as digital ecosystems move from human-centric to automated frameworks dominated by non-human identities. This transition is driven by the adoption of agile development and cloud-native architectures, which result in a surge of ephemeral identities for microservices, containers, and APIs.
  • The core objective is to apply principles of identity governance, traditionally used for people, to this expanding landscape of machines. For instance, a financial institution implementing an open banking platform relies on thousands of API keys and TLS certificates for secure data exchange with third-party partners.
  • Without an automated system for certificate lifecycle management and enforcing access control policies, a single expired certificate or compromised private key could disrupt services or lead to a massive data breach. Addressing this requires a zero trust architecture approach, where every service-to-service authentication is verified, and automated credential rotation is standard practice, ensuring the integrity of all machine-to-machine communication.

What will be the Size of the Machine Identity Management Market during the forecast period?

Get Key Insights on Market Forecast (PDF) Get Free Sample

How is the Machine Identity Management Market Segmented?

The machine identity management industry research report provides comprehensive data (region-wise segment analysis), with forecasts and estimates in "USD million" for the period 2026-2030, as well as historical data from 2020-2024 for the following segments.

  • Component
    • Solutions
    • Services
  • Deployment
    • On-premises
    • Cloud-based
  • Application
    • Certificate lifecycle management
    • Device authentication
    • Secure communication
  • Geography
    • North America
      • US
      • Canada
      • Mexico
    • Europe
      • Germany
      • UK
      • France
    • APAC
      • China
      • Japan
      • India
    • Middle East and Africa
      • Saudi Arabia
      • UAE
      • South Africa
    • South America
      • Brazil
      • Argentina
      • Colombia
    • Rest of World (ROW)

By Component Insights

The solutions segment is estimated to witness significant growth during the forecast period.

Solutions for machine identity management are evolving from basic tools into sophisticated platforms essential for modern enterprise security. These platforms provide centralized control for discovering, managing, and securing the entire certificate lifecycle management process for all non-human identities.

Core functionality addresses the need for pki automation and crypto-agility, with discovery scans of IT assets, including networks and code repositories, creating a complete and continuously updated inventory.

Through integrations with both public and private certificate authorities, these solutions automate policy-driven requests, secure provisioning, and proactive renewal, reducing manual errors by over 90%.

They are fundamental for workload authentication, enforcing access control policies, and managing ephemeral identities in dynamic settings, providing the secure boot for digital trust and mitigating advanced persistent threats.

Get Free Sample

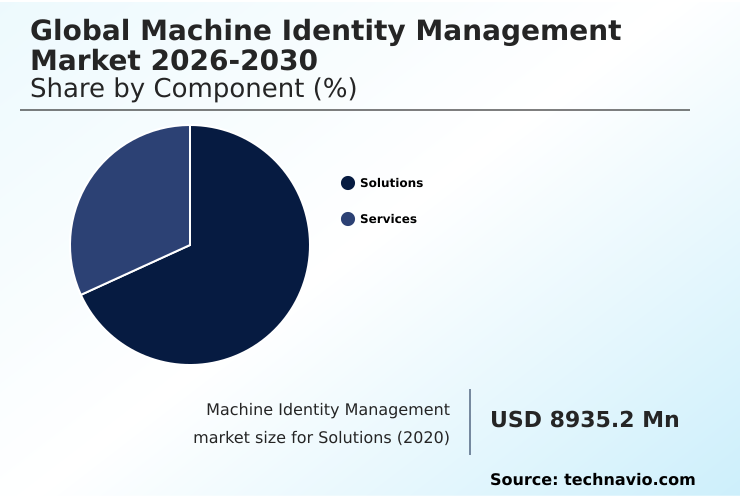
The Solutions segment was valued at USD 11.40 billion in 2024 and showed a gradual increase during the forecast period.

Get Free Sample

Regional Analysis

North America is estimated to contribute 32.5% to the growth of the global market during the forecast period.Technavio’s analysts have elaborately explained the regional trends and drivers that shape the market during the forecast period.

See How Machine Identity Management Market Demand is Rising in North America Get Free Sample

The geographic landscape of machine identity management is defined by varying levels of maturity and distinct regional drivers.

North America leads in adoption, accounting for over 32% of incremental growth, fueled by its dense concentration of cloud-native enterprises and a strong push toward DevSecOps, where CI/CD pipeline security is paramount.

In this region, managing ephemeral workloads and securing machine-to-machine communication are top priorities. Europe’s market is heavily influenced by strict regulations like GDPR and NIS2, driving demand for solutions that ensure data sovereignty and provide robust identity federation capabilities.

The APAC region is characterized by rapid digitalization, with many organizations leapfrogging legacy systems, creating a massive need for scalable tokenization and workload identity solutions to secure new IoT and smart city deployments, where machine identities often scale into the billions.

Market Dynamics

Our researchers analyzed the data with 2025 as the base year, along with the key drivers, trends, and challenges. A holistic analysis of drivers will help companies refine their marketing strategies to gain a competitive advantage.

  • As enterprises accelerate digital transformation, the conversation around security is pivoting to address the nuances of machine identities. Effectively managing machine identities in Kubernetes is no longer a niche technical problem but a core business continuity issue.
  • The focus is on implementing practical strategies, such as securing DevOps secrets with Vault and establishing a strong role of HSM in PKI strategy to protect cryptographic roots of trust. The rise of serverless computing introduces new complexities, making machine identity for serverless functions a critical area of development.
  • For industries deploying IoT at scale, automating certificate management for IoT is essential to prevent widespread vulnerabilities. This is closely tied to the broader security posture, where zero trust for API-driven architectures becomes the default model, requiring robust methods like securing service mesh communication with mTLS.
  • Addressing vulnerabilities in SSH key management and protecting code-signing keys securely are foundational tasks that prevent significant breaches. In converged environments, OT security using machine identities is vital for protecting critical infrastructure.
  • Beyond technology, the compliance challenges with ephemeral identities are forcing organizations to rethink governance, leading to a greater emphasis on identity governance for non-human users and the ability to prevent certificate-related service outages. This comprehensive lifecycle approach, from the lifecycle of a code signing certificate to automating TLS renewal across multi-cloud environments, underscores the market's maturity.

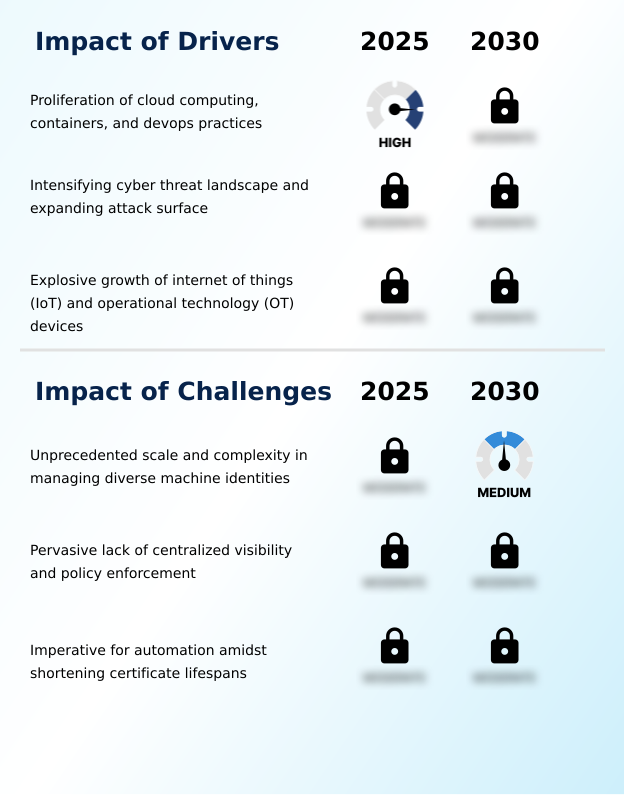
What are the key market drivers leading to the rise in the adoption of Machine Identity Management Industry?

  • The proliferation of cloud computing, containerization, and DevOps practices stands as a key driver for the machine identity management market's growth.

  • Market growth is primarily driven by the profound shift to distributed, cloud-native environments where machine identities vastly outnumber human ones, often by a ratio of more than forty to one.
  • The proliferation of IoT and OT system security requirements adds billions of new endpoints, each demanding a unique and immutable identity for secure boot processes and trusted communication.
  • This explosion of ephemeral identities, created and destroyed in seconds within DevOps workflows and microservices architectures, renders manual management obsolete.
  • Consequently, there is immense demand for scalable, agile security solutions that embed directly into the CI/CD pipeline, a concept at the heart of DevSecOps.
  • The need for secure remote access and robust secrets management to protect credentials for these non-human identities is a foundational driver across all industries.

What are the market trends shaping the Machine Identity Management Industry?

  • The integration with Zero Trust architecture is emerging as a pivotal market trend. It is rapidly establishing itself as a core tenet for modern security frameworks that handle both human and machine interactions.

  • Key market trends are centered on the deep integration of machine identities into a zero trust architecture, which is becoming the default security model for modern enterprises. This paradigm shift mandates continuous verification for all service-to-service authentication, making technologies like mutual TLS (mTLS) standard practice.
  • The operational tempo has been drastically increased by the industry-wide move to short-lived certificates, with lifespans now commonly at 90 days. This has made automated discovery and automated credential rotation non-negotiable capabilities, with advanced platforms reducing manual renewal efforts by over 95%.
  • Furthermore, the application of AI and ML for behavioral analysis allows for the detection of anomalies, such as an API key being used from an unusual location, adding a layer of proactive threat detection and enabling true cryptographic agility.

What challenges does the Machine Identity Management Industry face during its growth?

  • The unprecedented scale and complexity of managing diverse and often ephemeral machine identities across hybrid environments present a key challenge to industry growth.

  • The foremost market challenge is the sheer scale and complexity of modern digital ecosystems, where security teams often discover that up to 50% of machine identities are unmanaged 'shadow' credentials. This lack of centralized visibility and policy enforcement, stemming from fragmented ownership across networking, development, and infrastructure teams, creates a vast and undefended attack surface.
  • Organizations struggle with the secret zero problem, where initial credentials to access secrets management systems are themselves insecure. The pervasive lack of a unified inventory makes it impossible to enforce consistent access control policies or manage the credential lifecycle effectively.
  • This is exacerbated by the need for crypto-agility to handle shortening certificate lifespans, a task that becomes nearly impossible without a foundational root of trust and automated, policy-as-code frameworks.

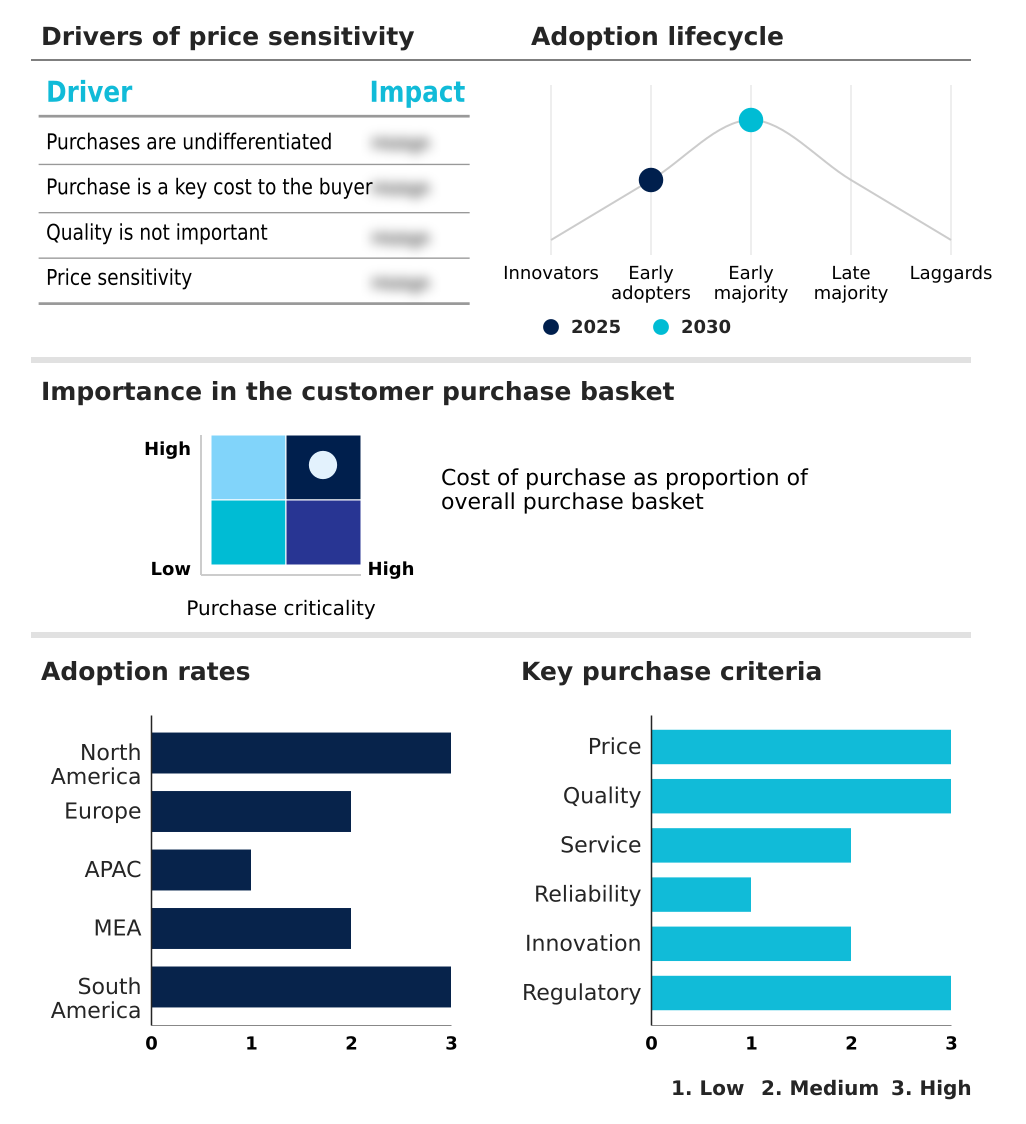
Exclusive Technavio Analysis on Customer Landscape

The machine identity management market forecasting report includes the adoption lifecycle of the market, covering from the innovator’s stage to the laggard’s stage. It focuses on adoption rates in different regions based on penetration. Furthermore, the machine identity management market report also includes key purchase criteria and drivers of price sensitivity to help companies evaluate and develop their market growth analysis strategies.

Customer Landscape of Machine Identity Management Industry

Competitive Landscape

Companies are implementing various strategies, such as strategic alliances, machine identity management market forecast, partnerships, mergers and acquisitions, geographical expansion, and product/service launches, to enhance their presence in the industry.

Amazon Web Services Inc. - Offers comprehensive machine identity management for securing workload identities and authentication across diverse cloud environments, ensuring cryptographic trust from device to data center.

The industry research and growth report includes detailed analyses of the competitive landscape of the market and information about key companies, including:

  • Amazon Web Services Inc.
  • AppViewX Inc.
  • BeyondTrust Corp.
  • Broadcom Inc.
  • CyberArk Software Ltd.
  • Delinea Inc.
  • DigiCert Inc.
  • Entrust Corp.
  • Fortanix
  • GlobalSign Ltd.
  • Google LLC
  • HashiCorp Inc.
  • IBM Corp.
  • Keyfactor
  • Microsoft Corp.
  • Nexus Group
  • Okta Inc.
  • SailPoint Technologies Inc.
  • Thales Group
  • Zoho Corp. Pvt. Ltd.

Qualitative and quantitative analysis of companies has been conducted to help clients understand the wider business environment as well as the strengths and weaknesses of key industry players. Data is qualitatively analyzed to categorize companies as pure play, category-focused, industry-focused, and diversified; it is quantitatively analyzed to categorize companies as dominant, leading, strong, tentative, and weak.

Recent Development and News in Machine identity management market

  • In January, 2025, Microsoft and Telefonica announced a strategic collaboration to integrate artificial intelligence services with regional connectivity solutions, facilitating the secure adoption of digital tools by managing machine identities that enable cloud communication.
  • In February, 2025, CyberArk announced a strategic pivot to position machine identity security as its primary growth engine, focusing on public key infrastructure and certificate lifecycle management as core components of zero trust architecture.
  • In March, 2025, AppViewX successfully completed the acquisition of Eos, an innovator in AI-native identity control planes, aiming to integrate agentic governance and privileged access controls into its automated certificate management platform.
  • In April, 2025, the organizers of Identity Management Day established a global theme focused on achieving parity between human and machine identities, emphasizing the need to protect the automated service accounts driving agentic artificial intelligence.

Dive into Technavio’s robust research methodology, blending expert interviews, extensive data synthesis, and validated models for unparalleled Machine Identity Management Market insights. See full methodology.

Market Scope
Page number 299
Base year 2025
Historic period 2020-2024
Forecast period 2026-2030
Growth momentum & CAGR Accelerate at a CAGR of 11.9%
Market growth 2026-2030 USD 14326.9 million
Market structure Fragmented
YoY growth 2025-2026(%) 10.6%
Key countries US, Canada, Mexico, Germany, UK, France, Italy, Spain, The Netherlands, China, Japan, India, South Korea, Australia, Indonesia, Saudi Arabia, UAE, South Africa, Israel, Turkey, Brazil, Argentina and Colombia
Competitive landscape Leading Companies, Market Positioning of Companies, Competitive Strategies, and Industry Risks

Request Free Sample

Research Analyst Overview

  • The machine identity management market is fundamentally reshaping enterprise cybersecurity by addressing the explosive growth of non-human identities. Boardroom-level decisions are now influenced by the operational risks tied to this landscape, particularly as the industry moves toward 90-day certificate lifespans, making budget allocation for robust PKI automation and DevSecOps tooling a critical strategic priority.
  • Platforms that provide comprehensive certificate lifecycle management are essential for maintaining service uptime, with successful implementations reducing certificate-related outages by over 90%. The strategic focus is on achieving a unified view of all cryptographic keys and digital certificates, including TLS certificates, SSH keys, API keys, and private keys.
  • This involves a zero trust architecture, deep integration into cloud-native platforms, and effective secrets management. Ensuring robust identity governance across microservices and containerization requires advanced solutions that support workload authentication, enforce access control policies, and provide the crypto-agility needed for modern, dynamic environments.
  • Ultimately, managing this ecosystem of ephemeral identities is central to mitigating advanced persistent threats and maintaining a secure digital posture.

What are the Key Data Covered in this Machine Identity Management Market Research and Growth Report?

  • What is the expected growth of the Machine Identity Management Market between 2026 and 2030?

    • USD 14.33 billion, at a CAGR of 11.9%

  • What segmentation does the market report cover?

    • The report is segmented by Component (Solutions, and Services), Deployment (On-premises, and Cloud-based), Application (Certificate lifecycle management, Device authentication, and Secure communication) and Geography (North America, Europe, APAC, Middle East and Africa, South America)

  • Which regions are analyzed in the report?

    • North America, Europe, APAC, Middle East and Africa and South America

  • What are the key growth drivers and market challenges?

    • Proliferation of cloud computing, containers, and devops practices, Unprecedented scale and complexity in managing diverse machine identities

  • Who are the major players in the Machine Identity Management Market?

    • Amazon Web Services Inc., AppViewX Inc., BeyondTrust Corp., Broadcom Inc., CyberArk Software Ltd., Delinea Inc., DigiCert Inc., Entrust Corp., Fortanix, GlobalSign Ltd., Google LLC, HashiCorp Inc., IBM Corp., Keyfactor, Microsoft Corp., Nexus Group, Okta Inc., SailPoint Technologies Inc., Thales Group and Zoho Corp. Pvt. Ltd.

Market Research Insights

  • Market dynamics are increasingly shaped by the dramatic shift to ephemeral workloads, where machine identities outnumber human users by ratios exceeding forty to one in some automated environments. This has made securing machine-to-machine communication a primary focus. Organizations are adopting identity-aware proxy models and strengthening API security to cope with this scale.
  • The industry-wide move to short-lived certificates with 90-day validity periods mandates a high degree of automated certificate renewal to prevent service disruptions, driving demand for platforms that offer crypto-agility. Effective solutions now provide centralized policy enforcement, moving beyond simple credential management to offer true identity-based segmentation, which is critical for implementing least privilege access principles in complex, distributed systems.

We can help! Our analysts can customize this machine identity management market research report to meet your requirements.

Get in touch

1. Executive Summary

1.1 Market overview

Executive Summary - Chart on Market Overview
Executive Summary - Data Table on Market Overview
Executive Summary - Chart on Global Market Characteristics
Executive Summary - Chart on Market by Geography
Executive Summary - Chart on Market Segmentation by Component
Executive Summary - Chart on Market Segmentation by Deployment
Executive Summary - Chart on Market Segmentation by Application
Executive Summary - Chart on Incremental Growth
Executive Summary - Data Table on Incremental Growth
Executive Summary - Chart on Company Market Positioning

2. Technavio Analysis

2.1 Analysis of price sensitivity, lifecycle, customer purchase basket, adoption rates, and purchase criteria

2.2 Criticality of inputs and Factors of differentiation

Chart on Overview on criticality of inputs and factors of differentiation

2.3 Factors of disruption

Chart on Overview on factors of disruption

2.4 Impact of drivers and challenges

Chart on Impact of drivers and challenges in 2025 and 2030

3. Market Landscape

3.1 Market ecosystem

Chart on Parent Market
Data Table on - Parent Market

3.2 Market characteristics

Chart on Market characteristics analysis

3.3 Value chain analysis

Chart on Value chain analysis

4. Market Sizing

4.1 Market definition

Data Table on Offerings of companies included in the market definition

4.2 Market segment analysis

Market segments

4.3 Market size 2025

4.4 Market outlook: Forecast for 2025-2030

Chart on Global - Market size and forecast 2025-2030 ($ million)
Data Table on Global - Market size and forecast 2025-2030 ($ million)
Chart on Global Market: Year-over-year growth 2025-2030 (%)
Data Table on Global Market: Year-over-year growth 2025-2030 (%)

5. Historic Market Size

5.1 Global Machine Identity Management Market 2020 - 2024

Historic Market Size - Data Table on Global Machine Identity Management Market 2020 - 2024 ($ million)

5.2 Component segment analysis 2020 - 2024

Historic Market Size - Component Segment 2020 - 2024 ($ million)

5.3 Deployment segment analysis 2020 - 2024

Historic Market Size - Deployment Segment 2020 - 2024 ($ million)

5.4 Application segment analysis 2020 - 2024

Historic Market Size - Application Segment 2020 - 2024 ($ million)

5.5 Geography segment analysis 2020 - 2024

Historic Market Size - Geography Segment 2020 - 2024 ($ million)

5.6 Country segment analysis 2020 - 2024

Historic Market Size - Country Segment 2020 - 2024 ($ million)

6. Qualitative Analysis

6.1 Impact of AI on global machine identity management market

6.2 Impact of geopolitical conflicts on global machine identity management market

7. Five Forces Analysis

7.1 Five forces summary

Five forces analysis - Comparison between 2025 and 2030

7.2 Bargaining power of buyers

Bargaining power of buyers - Impact of key factors 2025 and 2030

7.3 Bargaining power of suppliers

Bargaining power of suppliers - Impact of key factors in 2025 and 2030

7.4 Threat of new entrants

Threat of new entrants - Impact of key factors in 2025 and 2030

7.5 Threat of substitutes

Threat of substitutes - Impact of key factors in 2025 and 2030

7.6 Threat of rivalry

Threat of rivalry - Impact of key factors in 2025 and 2030

7.7 Market condition

Chart on Market condition - Five forces 2025 and 2030

8. Market Segmentation by Component

8.1 Market segments

Chart on Component - Market share 2025-2030 (%)
Data Table on Component - Market share 2025-2030 (%)

8.2 Comparison by Component

Chart on Comparison by Component
Data Table on Comparison by Component

8.3 Solutions - Market size and forecast 2025-2030

Chart on Solutions - Market size and forecast 2025-2030 ($ million)
Data Table on Solutions - Market size and forecast 2025-2030 ($ million)
Chart on Solutions - Year-over-year growth 2025-2030 (%)
Data Table on Solutions - Year-over-year growth 2025-2030 (%)

8.4 Services - Market size and forecast 2025-2030

Chart on Services - Market size and forecast 2025-2030 ($ million)
Data Table on Services - Market size and forecast 2025-2030 ($ million)
Chart on Services - Year-over-year growth 2025-2030 (%)
Data Table on Services - Year-over-year growth 2025-2030 (%)

8.5 Market opportunity by Component

Market opportunity by Component ($ million)
Data Table on Market opportunity by Component ($ million)

9. Market Segmentation by Deployment

9.1 Market segments

Chart on Deployment - Market share 2025-2030 (%)
Data Table on Deployment - Market share 2025-2030 (%)

9.2 Comparison by Deployment

Chart on Comparison by Deployment
Data Table on Comparison by Deployment

9.3 On-premises - Market size and forecast 2025-2030

Chart on On-premises - Market size and forecast 2025-2030 ($ million)
Data Table on On-premises - Market size and forecast 2025-2030 ($ million)
Chart on On-premises - Year-over-year growth 2025-2030 (%)
Data Table on On-premises - Year-over-year growth 2025-2030 (%)

9.4 Cloud-based - Market size and forecast 2025-2030

Chart on Cloud-based - Market size and forecast 2025-2030 ($ million)
Data Table on Cloud-based - Market size and forecast 2025-2030 ($ million)
Chart on Cloud-based - Year-over-year growth 2025-2030 (%)
Data Table on Cloud-based - Year-over-year growth 2025-2030 (%)

9.5 Market opportunity by Deployment

Market opportunity by Deployment ($ million)
Data Table on Market opportunity by Deployment ($ million)

10. Market Segmentation by Application

10.1 Market segments

Chart on Application - Market share 2025-2030 (%)
Data Table on Application - Market share 2025-2030 (%)

10.2 Comparison by Application

Chart on Comparison by Application
Data Table on Comparison by Application

10.3 Certificate lifecycle management - Market size and forecast 2025-2030

Chart on Certificate lifecycle management - Market size and forecast 2025-2030 ($ million)
Data Table on Certificate lifecycle management - Market size and forecast 2025-2030 ($ million)
Chart on Certificate lifecycle management - Year-over-year growth 2025-2030 (%)
Data Table on Certificate lifecycle management - Year-over-year growth 2025-2030 (%)

10.4 Device authentication - Market size and forecast 2025-2030

Chart on Device authentication - Market size and forecast 2025-2030 ($ million)
Data Table on Device authentication - Market size and forecast 2025-2030 ($ million)
Chart on Device authentication - Year-over-year growth 2025-2030 (%)
Data Table on Device authentication - Year-over-year growth 2025-2030 (%)

10.5 Secure communication - Market size and forecast 2025-2030

Chart on Secure communication - Market size and forecast 2025-2030 ($ million)
Data Table on Secure communication - Market size and forecast 2025-2030 ($ million)
Chart on Secure communication - Year-over-year growth 2025-2030 (%)
Data Table on Secure communication - Year-over-year growth 2025-2030 (%)

10.6 Market opportunity by Application

Market opportunity by Application ($ million)
Data Table on Market opportunity by Application ($ million)

11. Customer Landscape

11.1 Customer landscape overview

Analysis of price sensitivity, lifecycle, customer purchase basket, adoption rates, and purchase criteria

12. Geographic Landscape

12.1 Geographic segmentation

Chart on Market share by geography 2025-2030 (%)
Data Table on Market share by geography 2025-2030 (%)

12.2 Geographic comparison

Chart on Geographic comparison
Data Table on Geographic comparison

12.3 North America - Market size and forecast 2025-2030

Chart on North America - Market size and forecast 2025-2030 ($ million)
Data Table on North America - Market size and forecast 2025-2030 ($ million)
Chart on North America - Year-over-year growth 2025-2030 (%)
Data Table on North America - Year-over-year growth 2025-2030 (%)
Chart on Regional Comparison - North America
Data Table on Regional Comparison - North America

12.3.1 US - Market size and forecast 2025-2030

Chart on US - Market size and forecast 2025-2030 ($ million)
Data Table on US - Market size and forecast 2025-2030 ($ million)
Chart on US - Year-over-year growth 2025-2030 (%)
Data Table on US - Year-over-year growth 2025-2030 (%)

12.3.2 Canada - Market size and forecast 2025-2030

Chart on Canada - Market size and forecast 2025-2030 ($ million)
Data Table on Canada - Market size and forecast 2025-2030 ($ million)
Chart on Canada - Year-over-year growth 2025-2030 (%)
Data Table on Canada - Year-over-year growth 2025-2030 (%)

12.3.3 Mexico - Market size and forecast 2025-2030

Chart on Mexico - Market size and forecast 2025-2030 ($ million)
Data Table on Mexico - Market size and forecast 2025-2030 ($ million)
Chart on Mexico - Year-over-year growth 2025-2030 (%)
Data Table on Mexico - Year-over-year growth 2025-2030 (%)

12.4 Europe - Market size and forecast 2025-2030

Chart on Europe - Market size and forecast 2025-2030 ($ million)
Data Table on Europe - Market size and forecast 2025-2030 ($ million)
Chart on Europe - Year-over-year growth 2025-2030 (%)
Data Table on Europe - Year-over-year growth 2025-2030 (%)
Chart on Regional Comparison - Europe
Data Table on Regional Comparison - Europe

12.4.1 Germany - Market size and forecast 2025-2030

Chart on Germany - Market size and forecast 2025-2030 ($ million)
Data Table on Germany - Market size and forecast 2025-2030 ($ million)
Chart on Germany - Year-over-year growth 2025-2030 (%)
Data Table on Germany - Year-over-year growth 2025-2030 (%)

12.4.2 UK - Market size and forecast 2025-2030

Chart on UK - Market size and forecast 2025-2030 ($ million)
Data Table on UK - Market size and forecast 2025-2030 ($ million)
Chart on UK - Year-over-year growth 2025-2030 (%)
Data Table on UK - Year-over-year growth 2025-2030 (%)

12.4.3 France - Market size and forecast 2025-2030

Chart on France - Market size and forecast 2025-2030 ($ million)
Data Table on France - Market size and forecast 2025-2030 ($ million)
Chart on France - Year-over-year growth 2025-2030 (%)
Data Table on France - Year-over-year growth 2025-2030 (%)

12.4.4 Italy - Market size and forecast 2025-2030

Chart on Italy - Market size and forecast 2025-2030 ($ million)
Data Table on Italy - Market size and forecast 2025-2030 ($ million)
Chart on Italy - Year-over-year growth 2025-2030 (%)
Data Table on Italy - Year-over-year growth 2025-2030 (%)

12.4.5 Spain - Market size and forecast 2025-2030

Chart on Spain - Market size and forecast 2025-2030 ($ million)
Data Table on Spain - Market size and forecast 2025-2030 ($ million)
Chart on Spain - Year-over-year growth 2025-2030 (%)
Data Table on Spain - Year-over-year growth 2025-2030 (%)

12.4.6 The Netherlands - Market size and forecast 2025-2030

Chart on The Netherlands - Market size and forecast 2025-2030 ($ million)
Data Table on The Netherlands - Market size and forecast 2025-2030 ($ million)
Chart on The Netherlands - Year-over-year growth 2025-2030 (%)
Data Table on The Netherlands - Year-over-year growth 2025-2030 (%)

12.5 APAC - Market size and forecast 2025-2030

Chart on APAC - Market size and forecast 2025-2030 ($ million)
Data Table on APAC - Market size and forecast 2025-2030 ($ million)
Chart on APAC - Year-over-year growth 2025-2030 (%)
Data Table on APAC - Year-over-year growth 2025-2030 (%)
Chart on Regional Comparison - APAC
Data Table on Regional Comparison - APAC

12.5.1 China - Market size and forecast 2025-2030

Chart on China - Market size and forecast 2025-2030 ($ million)
Data Table on China - Market size and forecast 2025-2030 ($ million)
Chart on China - Year-over-year growth 2025-2030 (%)
Data Table on China - Year-over-year growth 2025-2030 (%)

12.5.2 Japan - Market size and forecast 2025-2030

Chart on Japan - Market size and forecast 2025-2030 ($ million)
Data Table on Japan - Market size and forecast 2025-2030 ($ million)
Chart on Japan - Year-over-year growth 2025-2030 (%)
Data Table on Japan - Year-over-year growth 2025-2030 (%)

12.5.3 India - Market size and forecast 2025-2030

Chart on India - Market size and forecast 2025-2030 ($ million)
Data Table on India - Market size and forecast 2025-2030 ($ million)
Chart on India - Year-over-year growth 2025-2030 (%)
Data Table on India - Year-over-year growth 2025-2030 (%)

12.5.4 South Korea - Market size and forecast 2025-2030

Chart on South Korea - Market size and forecast 2025-2030 ($ million)
Data Table on South Korea - Market size and forecast 2025-2030 ($ million)
Chart on South Korea - Year-over-year growth 2025-2030 (%)
Data Table on South Korea - Year-over-year growth 2025-2030 (%)

12.5.5 Australia - Market size and forecast 2025-2030

Chart on Australia - Market size and forecast 2025-2030 ($ million)
Data Table on Australia - Market size and forecast 2025-2030 ($ million)
Chart on Australia - Year-over-year growth 2025-2030 (%)
Data Table on Australia - Year-over-year growth 2025-2030 (%)

12.5.6 Indonesia - Market size and forecast 2025-2030

Chart on Indonesia - Market size and forecast 2025-2030 ($ million)
Data Table on Indonesia - Market size and forecast 2025-2030 ($ million)
Chart on Indonesia - Year-over-year growth 2025-2030 (%)
Data Table on Indonesia - Year-over-year growth 2025-2030 (%)

12.6 Middle East and Africa - Market size and forecast 2025-2030

Chart on Middle East and Africa - Market size and forecast 2025-2030 ($ million)
Data Table on Middle East and Africa - Market size and forecast 2025-2030 ($ million)
Chart on Middle East and Africa - Year-over-year growth 2025-2030 (%)
Data Table on Middle East and Africa - Year-over-year growth 2025-2030 (%)
Chart on Regional Comparison - Middle East and Africa
Data Table on Regional Comparison - Middle East and Africa

12.6.1 Saudi Arabia - Market size and forecast 2025-2030

Chart on Saudi Arabia - Market size and forecast 2025-2030 ($ million)
Data Table on Saudi Arabia - Market size and forecast 2025-2030 ($ million)
Chart on Saudi Arabia - Year-over-year growth 2025-2030 (%)
Data Table on Saudi Arabia - Year-over-year growth 2025-2030 (%)

12.6.2 UAE - Market size and forecast 2025-2030

Chart on UAE - Market size and forecast 2025-2030 ($ million)
Data Table on UAE - Market size and forecast 2025-2030 ($ million)
Chart on UAE - Year-over-year growth 2025-2030 (%)
Data Table on UAE - Year-over-year growth 2025-2030 (%)

12.6.3 South Africa - Market size and forecast 2025-2030

Chart on South Africa - Market size and forecast 2025-2030 ($ million)
Data Table on South Africa - Market size and forecast 2025-2030 ($ million)
Chart on South Africa - Year-over-year growth 2025-2030 (%)
Data Table on South Africa - Year-over-year growth 2025-2030 (%)

12.6.4 Israel - Market size and forecast 2025-2030

Chart on Israel - Market size and forecast 2025-2030 ($ million)
Data Table on Israel - Market size and forecast 2025-2030 ($ million)
Chart on Israel - Year-over-year growth 2025-2030 (%)
Data Table on Israel - Year-over-year growth 2025-2030 (%)

12.6.5 Turkey - Market size and forecast 2025-2030

Chart on Turkey - Market size and forecast 2025-2030 ($ million)
Data Table on Turkey - Market size and forecast 2025-2030 ($ million)
Chart on Turkey - Year-over-year growth 2025-2030 (%)
Data Table on Turkey - Year-over-year growth 2025-2030 (%)

12.7 South America - Market size and forecast 2025-2030

Chart on South America - Market size and forecast 2025-2030 ($ million)
Data Table on South America - Market size and forecast 2025-2030 ($ million)
Chart on South America - Year-over-year growth 2025-2030 (%)
Data Table on South America - Year-over-year growth 2025-2030 (%)
Chart on Regional Comparison - South America
Data Table on Regional Comparison - South America

12.7.1 Brazil - Market size and forecast 2025-2030

Chart on Brazil - Market size and forecast 2025-2030 ($ million)
Data Table on Brazil - Market size and forecast 2025-2030 ($ million)
Chart on Brazil - Year-over-year growth 2025-2030 (%)
Data Table on Brazil - Year-over-year growth 2025-2030 (%)

12.7.2 Argentina - Market size and forecast 2025-2030

Chart on Argentina - Market size and forecast 2025-2030 ($ million)
Data Table on Argentina - Market size and forecast 2025-2030 ($ million)
Chart on Argentina - Year-over-year growth 2025-2030 (%)
Data Table on Argentina - Year-over-year growth 2025-2030 (%)

12.7.3 Colombia - Market size and forecast 2025-2030

Chart on Colombia - Market size and forecast 2025-2030 ($ million)
Data Table on Colombia - Market size and forecast 2025-2030 ($ million)
Chart on Colombia - Year-over-year growth 2025-2030 (%)
Data Table on Colombia - Year-over-year growth 2025-2030 (%)

12.8 Market opportunity by geography

Market opportunity by geography ($ million)
Data Tables on Market opportunity by geography ($ million)

13. Drivers, Challenges, and Opportunity

13.1 Market drivers

Proliferation of cloud computing, containers, and devops practices
Intensifying cyber threat landscape and expanding attack surface
Explosive growth of internet of things (IoT) and operational technology (OT) devices

13.2 Market challenges

Unprecedented scale and complexity in managing diverse machine identities
Pervasive lack of centralized visibility and policy enforcement
Imperative for automation amidst shortening certificate lifespans

13.3 Impact of drivers and challenges

Impact of drivers and challenges in 2025 and 2030

13.4 Market opportunities

Integration with zero trust architecture as core tenet
Application of AI and ML for enhanced security and operations
Shift towards cloud-native solutions and as-a-service delivery models

14. Competitive Landscape

14.1 Overview

14.2

Overview on criticality of inputs and factors of differentiation

14.3 Landscape disruption

Overview on factors of disruption

14.4 Industry risks

Impact of key risks on business

15. Competitive Analysis

15.1 Companies profiled

Companies covered

15.2 Company ranking index

15.3 Market positioning of companies

Matrix on companies position and classification

15.4 Amazon Web Services Inc.

Amazon Web Services Inc. - Overview
Amazon Web Services Inc. - Product / Service
Amazon Web Services Inc. - Key offerings
SWOT

15.5 AppViewX Inc.

AppViewX Inc. - Overview
AppViewX Inc. - Product / Service
AppViewX Inc. - Key offerings
SWOT

15.6 Broadcom Inc.

Broadcom Inc. - Overview
Broadcom Inc. - Business segments
Broadcom Inc. - Key offerings
Broadcom Inc. - Segment focus
SWOT

15.7 CyberArk Software Ltd.

CyberArk Software Ltd. - Overview
CyberArk Software Ltd. - Product / Service
CyberArk Software Ltd. - Key offerings
SWOT

15.8 Delinea Inc.

Delinea Inc. - Overview
Delinea Inc. - Product / Service
Delinea Inc. - Key offerings
SWOT

15.9 DigiCert Inc.

DigiCert Inc. - Overview
DigiCert Inc. - Product / Service
DigiCert Inc. - Key offerings
SWOT

15.10 Entrust Corp.

Entrust Corp. - Overview
Entrust Corp. - Product / Service
Entrust Corp. - Key offerings
SWOT

15.11 Fortanix

Fortanix - Overview
Fortanix - Product / Service
Fortanix - Key offerings
SWOT

15.12 Google LLC

Google LLC - Overview
Google LLC - Product / Service
Google LLC - Key offerings
SWOT

15.13 HashiCorp Inc.

HashiCorp Inc. - Overview
HashiCorp Inc. - Product / Service
HashiCorp Inc. - Key offerings
SWOT

15.14 IBM Corp.

IBM Corp. - Overview
IBM Corp. - Business segments
IBM Corp. - Key news
IBM Corp. - Key offerings
IBM Corp. - Segment focus
SWOT

15.15 Microsoft Corp.

Microsoft Corp. - Overview
Microsoft Corp. - Business segments
Microsoft Corp. - Key news
Microsoft Corp. - Key offerings
Microsoft Corp. - Segment focus
SWOT

15.16 Okta Inc.

Okta Inc. - Overview
Okta Inc. - Product / Service
Okta Inc. - Key offerings
SWOT

15.17 SailPoint Technologies Inc.

SailPoint Technologies Inc. - Overview
SailPoint Technologies Inc. - Product / Service
SailPoint Technologies Inc. - Key offerings
SWOT

15.18 Thales Group

Thales Group - Overview
Thales Group - Business segments
Thales Group - Key offerings
Thales Group - Segment focus
SWOT

16. Appendix

16.1 Scope of the report

Market definition
Objectives
Notes and caveats

16.2 Inclusions and exclusions checklist

Inclusions checklist
Exclusions checklist

16.3 Currency conversion rates for US$

16.4 Research methodology

16.5 Data procurement

Information sources

16.6 Data validation

16.7 Validation techniques employed for market sizing

16.8 Data synthesis

16.9 360 degree market analysis

16.10 List of abbreviations

Research Methodology

Technavio presents a detailed picture of the market by way of study, synthesis, and summation of data from multiple sources. The analysts have presented the various facets of the market with a particular focus on identifying the key industry influencers. The data thus presented is comprehensive, reliable, and the result of extensive research, both primary and secondary.

INFORMATION SOURCES

Primary sources

  • Manufacturers and suppliers
  • Channel partners
  • Industry experts
  • Strategic decision makers

Secondary sources

  • Industry journals and periodicals
  • Government data
  • Financial reports of key industry players
  • Historical data
  • Press releases

DATA ANALYSIS

Data Synthesis

  • Collation of data
  • Estimation of key figures
  • Analysis of derived insights

Data Validation

  • Triangulation with data models
  • Reference against proprietary databases
  • Corroboration with industry experts

REPORT WRITING

Qualitative

  • Market drivers
  • Market challenges
  • Market trends
  • Five forces analysis

Quantitative

  • Market size and forecast
  • Market segmentation
  • Geographical insights
  • Competitive landscape

Interested in this report?

Get your sample now to see our research methodology and insights!

Download Now

Frequently Asked Questions

Machine Identity Management market growth will increase by USD 14326.9 million during 2026-2030.

The Machine Identity Management market is expected to grow at a CAGR of 11.9% during 2026-2030.

Machine Identity Management market is segmented by Component (Solutions, Services) Deployment (On-premises, Cloud-based) Application (Certificate lifecycle management, Device authentication, Secure communication)

Amazon Web Services Inc., AppViewX Inc., BeyondTrust Corp., Broadcom Inc., CyberArk Software Ltd., Delinea Inc., DigiCert Inc., Entrust Corp., Fortanix, GlobalSign Ltd., Google LLC, HashiCorp Inc., IBM Corp., Keyfactor, Microsoft Corp., Nexus Group, Okta Inc., SailPoint Technologies Inc., Thales Group, Zoho Corp. Pvt. Ltd. are a few of the key vendors in the Machine Identity Management market.

North America will register the highest growth rate of 32.5% among the other regions. Therefore, the Machine Identity Management market in North America is expected to garner significant business opportunities for the vendors during the forecast period.

US, Canada, Mexico, Germany, UK, France, Italy, Spain, The Netherlands, China, Japan, India, South Korea, Australia, Indonesia, Saudi Arabia, UAE, South Africa, Israel, Turkey, Brazil, Argentina, Colombia

  • Proliferation of cloud computing, containers, and devops practices is the driving factor this market.

The Machine Identity Management market vendors should focus on grabbing business opportunities from the Component segment as it accounted for the largest market share in the base year.
RIA - Research AI Assistant
Ask RIA