Material Handling Equipment Market Analysis, Size, and Forecast 2026-2030: APAC (China, Japan, and India), North America (US, Canada, and Mexico), Europe (Germany, UK, and France), South America (Brazil, Argentina, and Colombia), Middle East and Africa (Saudi Arabia, UAE, and South Africa), and Rest of World (ROW)

Material Handling Equipment Market Analysis, Size, and Forecast 2026-2030:
APAC (China, Japan, and India), North America (US, Canada, and Mexico), Europe (Germany, UK, and France), South America (Brazil, Argentina, and Colombia), Middle East and Africa (Saudi Arabia, UAE, and South Africa), and Rest of World (ROW)

Published: Dec 2025 316 Pages SKU: IRTNTR72740

Market Overview at a Glance

$18.79 B
Market Opportunity
7.2%
CAGR 2025 - 2030
42.7%
APAC Growth
$17.32 B
Cranes and lifting equipment segment 2024

Material Handling Equipment Market Size 2026-2030

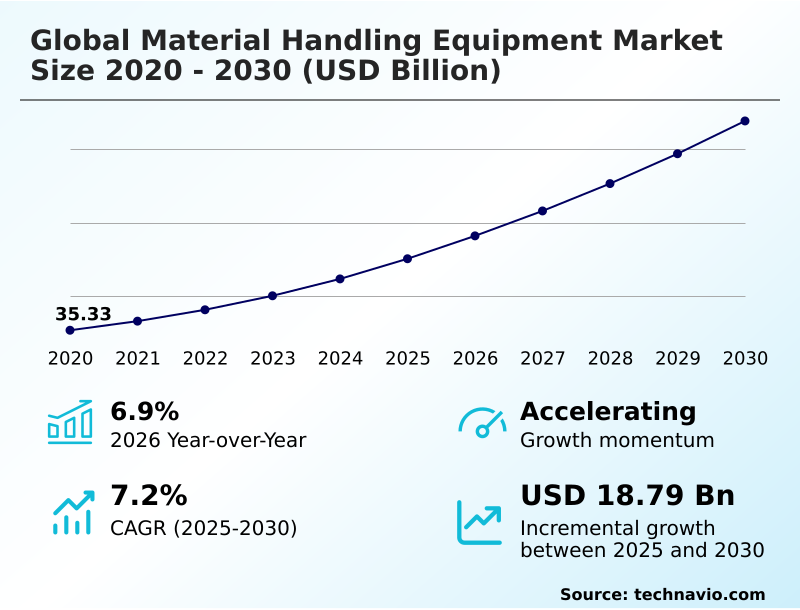
The material handling equipment market size is valued to increase by USD 18.79 billion, at a CAGR of 7.2% from 2025 to 2030. Transformative impact of ecommerce and omnichannel fulfillment will drive the material handling equipment market.

Major Market Trends & Insights

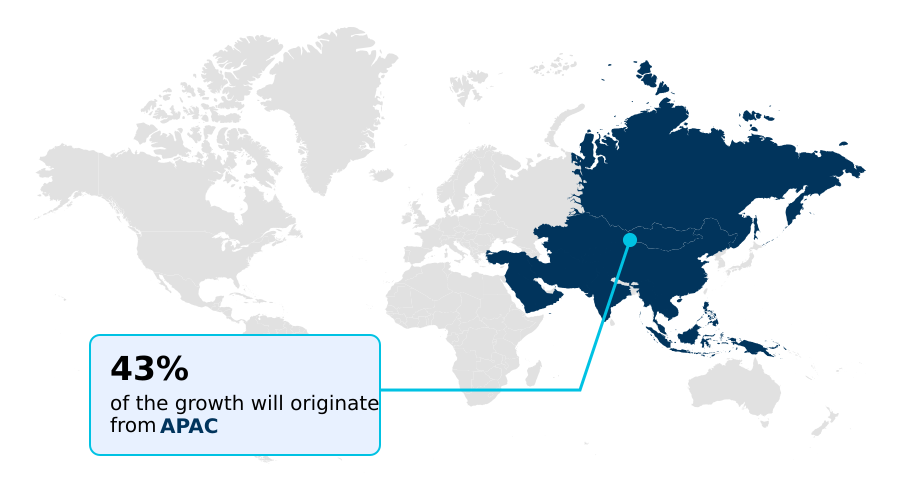
  • APAC dominated the market and accounted for a 42.7% growth during the forecast period.
  • By Type - Cranes and lifting equipment segment was valued at USD 17.32 billion in 2024
  • By Application - Construction segment accounted for the largest market revenue share in 2024

Market Size & Forecast

  • Market Opportunities: USD 28.54 billion
  • Market Future Opportunities: USD 18.79 billion
  • CAGR from 2025 to 2030 : 7.2%

Market Summary

What will be the Size of the Material Handling Equipment Market during the forecast period?

Get Key Insights on Market Forecast (PDF) Request Free Sample

How is the Material Handling Equipment Market Segmented?

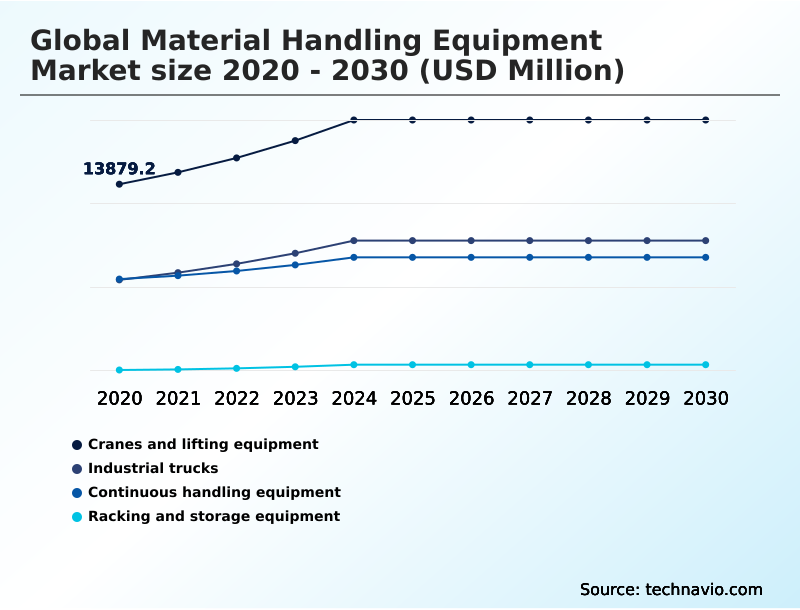
The material handling equipment industry research report provides comprehensive data (region-wise segment analysis), with forecasts and estimates in "USD million" for the period 2026-2030, as well as historical data from 2020-2024 for the following segments.

  • Type
    • Cranes and lifting equipment
    • Industrial trucks
    • Continuous handling equipment
    • Racking and storage equipment
  • Application
    • Construction
    • Ecommerce
    • Food and beverages
    • Automotive
    • Others
  • Product type
    • Manual
    • Semi automated
    • Fully automated
  • Geography
    • APAC
      • China
      • Japan
      • India
    • North America
      • US
      • Canada
      • Mexico
    • Europe
      • Germany
      • UK
      • France
    • South America
      • Brazil
      • Argentina
      • Colombia
    • Middle East and Africa
      • Saudi Arabia
      • UAE
      • South Africa
    • Rest of World (ROW)

By Type Insights

The cranes and lifting equipment segment is estimated to witness significant growth during the forecast period.

Request Free Sample

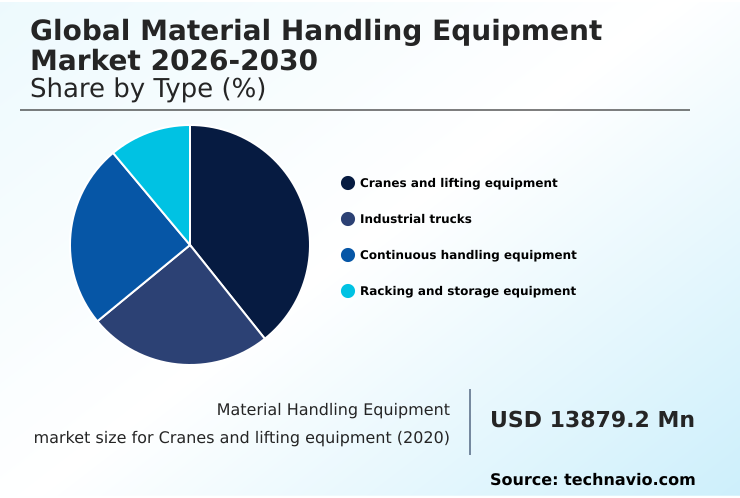
The Cranes and lifting equipment segment was valued at USD 17.32 billion in 2024 and showed a gradual increase during the forecast period.

Request Free Sample

Regional Analysis

APAC is estimated to contribute 42.7% to the growth of the global market during the forecast period.Technavio’s analysts have elaborately explained the regional trends and drivers that shape the market during the forecast period.

See How Material Handling Equipment Market Demand is Rising in APAC Request Free Sample

Market Dynamics

Our researchers analyzed the data with 2025 as the base year, along with the key drivers, trends, and challenges. A holistic analysis of drivers will help companies refine their marketing strategies to gain a competitive advantage.

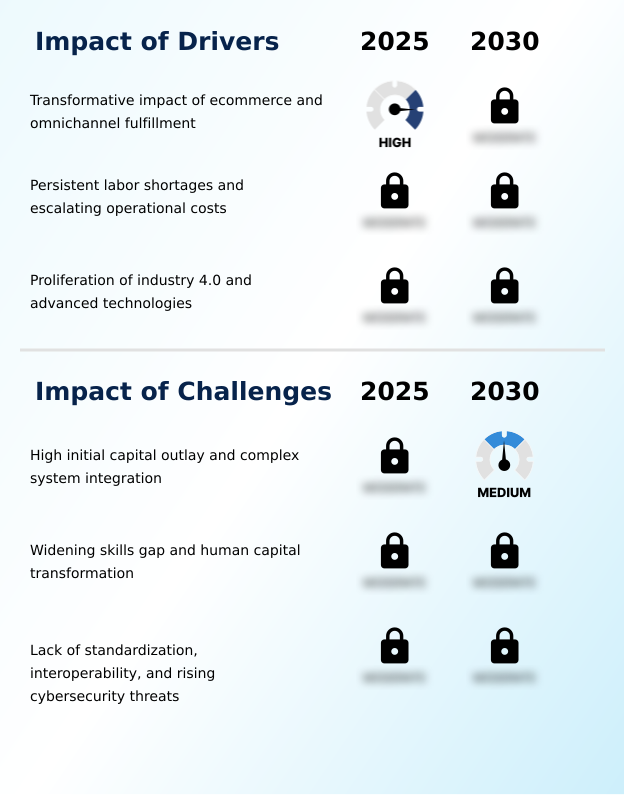
What are the key market drivers leading to the rise in the adoption of Material Handling Equipment Industry?

What are the market trends shaping the Material Handling Equipment Industry?

What challenges does the Material Handling Equipment Industry face during its growth?

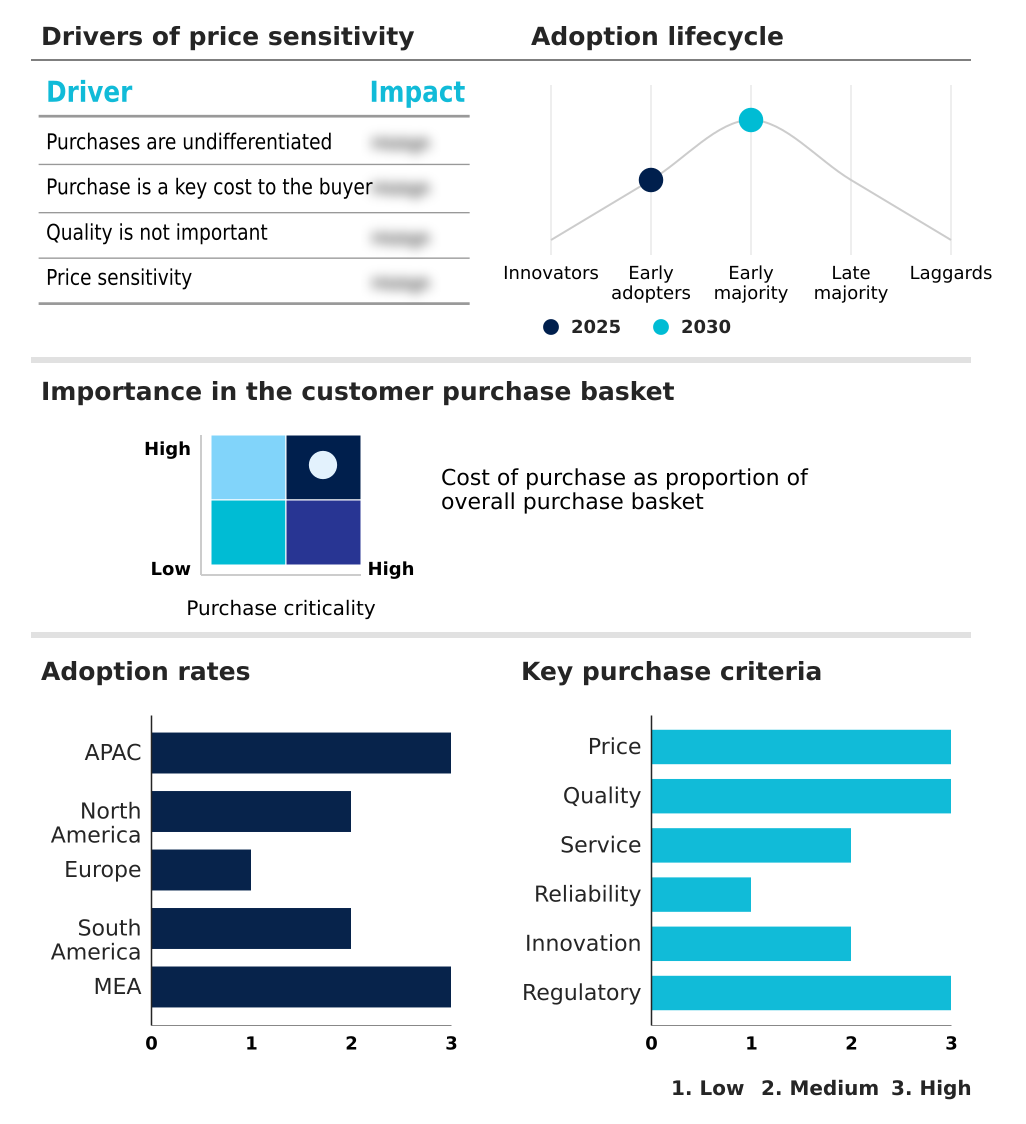
Exclusive Technavio Analysis on Customer Landscape

The material handling equipment market forecasting report includes the adoption lifecycle of the market, covering from the innovator’s stage to the laggard’s stage. It focuses on adoption rates in different regions based on penetration. Furthermore, the material handling equipment market report also includes key purchase criteria and drivers of price sensitivity to help companies evaluate and develop their market growth analysis strategies.

Customer Landscape of Material Handling Equipment Industry

Competitive Landscape

Companies are implementing various strategies, such as strategic alliances, material handling equipment market forecast, partnerships, mergers and acquisitions, geographical expansion, and product/service launches, to enhance their presence in the industry.

Beumer Group GmbH and Co. KG -

The industry research and growth report includes detailed analyses of the competitive landscape of the market and information about key companies, including:

  • Beumer Group GmbH and Co. KG
  • Columbus McKinnon Corp.
  • Crown Equipment Corp.
  • Daifuku Co. Ltd.
  • FlexLink Holding AB
  • Honeywell International Inc.
  • Hytrol Conveyor Co.
  • Interlake Mecalux Inc.
  • Interroll Holding AG
  • Jungheinrich Group
  • KION GROUP AG
  • KUKA AG
  • Liebherr International AG
  • Mitsubishi Chemical Grp.
  • Murata Manufacturing Co. Ltd.
  • NACCO Industries Inc.
  • SSI Schafer IT Solutions GmbH
  • Toyota Industries Corp.
  • viastore SYSTEMS GmbH

Qualitative and quantitative analysis of companies has been conducted to help clients understand the wider business environment as well as the strengths and weaknesses of key industry players. Data is qualitatively analyzed to categorize companies as pure play, category-focused, industry-focused, and diversified; it is quantitatively analyzed to categorize companies as dominant, leading, strong, tentative, and weak.

Recent Development and News in Material handling equipment market

Dive into Technavio’s robust research methodology, blending expert interviews, extensive data synthesis, and validated models for unparalleled Material Handling Equipment Market insights. See full methodology.

Market Scope
Page number 316
Base year 2025
Historic period 2020-2024
Forecast period 2026-2030
Growth momentum & CAGR Accelerate at a CAGR of 7.2%
Market growth 2026-2030 USD 18786.0 million
Market structure Fragmented
YoY growth 2025-2026(%) 6.9%
Key countries China, Japan, India, South Korea, Indonesia, Australia, US, Canada, Mexico, Germany, UK, France, Italy, Spain, The Netherlands, Brazil, Argentina, Colombia, Saudi Arabia, UAE, South Africa, Israel and Turkey
Competitive landscape Leading Companies, Market Positioning of Companies, Competitive Strategies, and Industry Risks

Request Free Sample

Research Analyst Overview

What are the Key Data Covered in this Material Handling Equipment Market Research and Growth Report?

  • What is the expected growth of the Material Handling Equipment Market between 2026 and 2030?

    • USD 18.79 billion, at a CAGR of 7.2%

  • What segmentation does the market report cover?

    • The report is segmented by Type (Cranes and lifting equipment, Industrial trucks, Continuous handling equipment, and Racking and storage equipment), Application (Construction, Ecommerce, Food and beverages, Automotive, and Others), Product Type (Manual, Semi automated, and Fully automated) and Geography (APAC, North America, Europe, South America, Middle East and Africa)

  • Which regions are analyzed in the report?

    • APAC, North America, Europe, South America and Middle East and Africa

  • What are the key growth drivers and market challenges?

    • Transformative impact of ecommerce and omnichannel fulfillment, High initial capital outlay and complex system integration

  • Who are the major players in the Material Handling Equipment Market?

    • Beumer Group GmbH and Co. KG, Columbus McKinnon Corp., Crown Equipment Corp., Daifuku Co. Ltd., FlexLink Holding AB, Honeywell International Inc., Hytrol Conveyor Co., Interlake Mecalux Inc., Interroll Holding AG, Jungheinrich Group, KION GROUP AG, KUKA AG, Liebherr International AG, Mitsubishi Chemical Grp., Murata Manufacturing Co. Ltd., NACCO Industries Inc., SSI Schafer IT Solutions GmbH, Toyota Industries Corp. and viastore SYSTEMS GmbH

Market Research Insights

We can help! Our analysts can customize this material handling equipment market research report to meet your requirements.

Get in touch

1. Executive Summary

1.1 Market overview

Executive Summary - Chart on Market Overview
Executive Summary - Data Table on Market Overview
Executive Summary - Chart on Global Market Characteristics
Executive Summary - Chart on Market by Geography
Executive Summary - Chart on Market Segmentation by Type
Executive Summary - Chart on Market Segmentation by Application
Executive Summary - Chart on Market Segmentation by Product Type
Executive Summary - Chart on Incremental Growth
Executive Summary - Data Table on Incremental Growth
Executive Summary - Chart on Company Market Positioning

2. Technavio Analysis

2.1 Analysis of price sensitivity, lifecycle, customer purchase basket, adoption rates, and purchase criteria

2.2 Criticality of inputs and Factors of differentiation

Chart on Overview on criticality of inputs and factors of differentiation

2.3 Factors of disruption

Chart on Overview on factors of disruption

2.4 Impact of drivers and challenges

Chart on Impact of drivers and challenges in 2025 and 2030

3. Market Landscape

3.1 Market ecosystem

Chart on Parent Market
Data Table on - Parent Market

3.2 Market characteristics

Chart on Market characteristics analysis

3.3 Value chain analysis

Chart on Value chain analysis

4. Market Sizing

4.1 Market definition

Data Table on Offerings of companies included in the market definition

4.2 Market segment analysis

Market segments

4.3 Market size 2025

4.4 Market outlook: Forecast for 2025-2030

Chart on Global - Market size and forecast 2025-2030 ($ million)
Data Table on Global - Market size and forecast 2025-2030 ($ million)
Chart on Global Market: Year-over-year growth 2025-2030 (%)
Data Table on Global Market: Year-over-year growth 2025-2030 (%)

5. Historic Market Size

5.1 Global Material Handling Equipment Market 2020 - 2024

Historic Market Size - Data Table on Global Material Handling Equipment Market 2020 - 2024 ($ million)

5.2 Type segment analysis 2020 - 2024

Historic Market Size - Type Segment 2020 - 2024 ($ million)

5.3 Application segment analysis 2020 - 2024

Historic Market Size - Application Segment 2020 - 2024 ($ million)

5.4 Product Type segment analysis 2020 - 2024

Historic Market Size - Product Type Segment 2020 - 2024 ($ million)

5.5 Geography segment analysis 2020 - 2024

Historic Market Size - Geography Segment 2020 - 2024 ($ million)

5.6 Country segment analysis 2020 - 2024

Historic Market Size - Country Segment 2020 - 2024 ($ million)

6. Qualitative Analysis

6.1 The AI impact on global material handling equipment market

7. Five Forces Analysis

7.1 Five forces summary

Five forces analysis - Comparison between 2025 and 2030

7.2 Bargaining power of buyers

Bargaining power of buyers - Impact of key factors 2025 and 2030

7.3 Bargaining power of suppliers

Bargaining power of suppliers - Impact of key factors in 2025 and 2030

7.4 Threat of new entrants

Threat of new entrants - Impact of key factors in 2025 and 2030

7.5 Threat of substitutes

Threat of substitutes - Impact of key factors in 2025 and 2030

7.6 Threat of rivalry

Threat of rivalry - Impact of key factors in 2025 and 2030

7.7 Market condition

Chart on Market condition - Five forces 2025 and 2030

8. Market Segmentation by Type

8.1 Market segments

Chart on Type - Market share 2025-2030 (%)
Data Table on Type - Market share 2025-2030 (%)

8.2 Comparison by Type

Chart on Comparison by Type
Data Table on Comparison by Type

8.3 Cranes and lifting equipment - Market size and forecast 2025-2030

Chart on Cranes and lifting equipment - Market size and forecast 2025-2030 ($ million)
Data Table on Cranes and lifting equipment - Market size and forecast 2025-2030 ($ million)
Chart on Cranes and lifting equipment - Year-over-year growth 2025-2030 (%)
Data Table on Cranes and lifting equipment - Year-over-year growth 2025-2030 (%)

8.4 Industrial trucks - Market size and forecast 2025-2030

Chart on Industrial trucks - Market size and forecast 2025-2030 ($ million)
Data Table on Industrial trucks - Market size and forecast 2025-2030 ($ million)
Chart on Industrial trucks - Year-over-year growth 2025-2030 (%)
Data Table on Industrial trucks - Year-over-year growth 2025-2030 (%)

8.5 Continuous handling equipment - Market size and forecast 2025-2030

Chart on Continuous handling equipment - Market size and forecast 2025-2030 ($ million)
Data Table on Continuous handling equipment - Market size and forecast 2025-2030 ($ million)
Chart on Continuous handling equipment - Year-over-year growth 2025-2030 (%)
Data Table on Continuous handling equipment - Year-over-year growth 2025-2030 (%)

8.6 Racking and storage equipment - Market size and forecast 2025-2030

Chart on Racking and storage equipment - Market size and forecast 2025-2030 ($ million)
Data Table on Racking and storage equipment - Market size and forecast 2025-2030 ($ million)
Chart on Racking and storage equipment - Year-over-year growth 2025-2030 (%)
Data Table on Racking and storage equipment - Year-over-year growth 2025-2030 (%)

8.7 Market opportunity by Type

Market opportunity by Type ($ million)
Data Table on Market opportunity by Type ($ million)

9. Market Segmentation by Application

9.1 Market segments

Chart on Application - Market share 2025-2030 (%)
Data Table on Application - Market share 2025-2030 (%)

9.2 Comparison by Application

Chart on Comparison by Application
Data Table on Comparison by Application

9.3 Construction - Market size and forecast 2025-2030

Chart on Construction - Market size and forecast 2025-2030 ($ million)
Data Table on Construction - Market size and forecast 2025-2030 ($ million)
Chart on Construction - Year-over-year growth 2025-2030 (%)
Data Table on Construction - Year-over-year growth 2025-2030 (%)

9.4 Ecommerce - Market size and forecast 2025-2030

Chart on Ecommerce - Market size and forecast 2025-2030 ($ million)
Data Table on Ecommerce - Market size and forecast 2025-2030 ($ million)
Chart on Ecommerce - Year-over-year growth 2025-2030 (%)
Data Table on Ecommerce - Year-over-year growth 2025-2030 (%)

9.5 Food and beverages - Market size and forecast 2025-2030

Chart on Food and beverages - Market size and forecast 2025-2030 ($ million)
Data Table on Food and beverages - Market size and forecast 2025-2030 ($ million)
Chart on Food and beverages - Year-over-year growth 2025-2030 (%)
Data Table on Food and beverages - Year-over-year growth 2025-2030 (%)

9.6 Automotive - Market size and forecast 2025-2030

Chart on Automotive - Market size and forecast 2025-2030 ($ million)
Data Table on Automotive - Market size and forecast 2025-2030 ($ million)
Chart on Automotive - Year-over-year growth 2025-2030 (%)
Data Table on Automotive - Year-over-year growth 2025-2030 (%)

9.7 Others - Market size and forecast 2025-2030

Chart on Others - Market size and forecast 2025-2030 ($ million)
Data Table on Others - Market size and forecast 2025-2030 ($ million)
Chart on Others - Year-over-year growth 2025-2030 (%)
Data Table on Others - Year-over-year growth 2025-2030 (%)

9.8 Market opportunity by Application

Market opportunity by Application ($ million)
Data Table on Market opportunity by Application ($ million)

10. Market Segmentation by Product Type

10.1 Market segments

Chart on Product Type - Market share 2025-2030 (%)
Data Table on Product Type - Market share 2025-2030 (%)

10.2 Comparison by Product Type

Chart on Comparison by Product Type
Data Table on Comparison by Product Type

10.3 Manual - Market size and forecast 2025-2030

Chart on Manual - Market size and forecast 2025-2030 ($ million)
Data Table on Manual - Market size and forecast 2025-2030 ($ million)
Chart on Manual - Year-over-year growth 2025-2030 (%)
Data Table on Manual - Year-over-year growth 2025-2030 (%)

10.4 Semi automated - Market size and forecast 2025-2030

Chart on Semi automated - Market size and forecast 2025-2030 ($ million)
Data Table on Semi automated - Market size and forecast 2025-2030 ($ million)
Chart on Semi automated - Year-over-year growth 2025-2030 (%)
Data Table on Semi automated - Year-over-year growth 2025-2030 (%)

10.5 Fully automated - Market size and forecast 2025-2030

Chart on Fully automated - Market size and forecast 2025-2030 ($ million)
Data Table on Fully automated - Market size and forecast 2025-2030 ($ million)
Chart on Fully automated - Year-over-year growth 2025-2030 (%)
Data Table on Fully automated - Year-over-year growth 2025-2030 (%)

10.6 Market opportunity by Product Type

Market opportunity by Product Type ($ million)
Data Table on Market opportunity by Product Type ($ million)

11. Customer Landscape

11.1 Customer landscape overview

Analysis of price sensitivity, lifecycle, customer purchase basket, adoption rates, and purchase criteria

12. Geographic Landscape

12.1 Geographic segmentation

Chart on Market share by geography 2025-2030 (%)
Data Table on Market share by geography 2025-2030 (%)

12.2 Geographic comparison

Chart on Geographic comparison
Data Table on Geographic comparison

12.3 APAC - Market size and forecast 2025-2030

Chart on APAC - Market size and forecast 2025-2030 ($ million)
Data Table on APAC - Market size and forecast 2025-2030 ($ million)
Chart on APAC - Year-over-year growth 2025-2030 (%)
Data Table on APAC - Year-over-year growth 2025-2030 (%)
Chart on Regional Comparison - APAC
Data Table on Regional Comparison - APAC

12.3.1 China - Market size and forecast 2025-2030

Chart on China - Market size and forecast 2025-2030 ($ million)
Data Table on China - Market size and forecast 2025-2030 ($ million)
Chart on China - Year-over-year growth 2025-2030 (%)
Data Table on China - Year-over-year growth 2025-2030 (%)

12.3.2 Japan - Market size and forecast 2025-2030

Chart on Japan - Market size and forecast 2025-2030 ($ million)
Data Table on Japan - Market size and forecast 2025-2030 ($ million)
Chart on Japan - Year-over-year growth 2025-2030 (%)
Data Table on Japan - Year-over-year growth 2025-2030 (%)

12.3.3 India - Market size and forecast 2025-2030

Chart on India - Market size and forecast 2025-2030 ($ million)
Data Table on India - Market size and forecast 2025-2030 ($ million)
Chart on India - Year-over-year growth 2025-2030 (%)
Data Table on India - Year-over-year growth 2025-2030 (%)

12.3.4 South Korea - Market size and forecast 2025-2030

Chart on South Korea - Market size and forecast 2025-2030 ($ million)
Data Table on South Korea - Market size and forecast 2025-2030 ($ million)
Chart on South Korea - Year-over-year growth 2025-2030 (%)
Data Table on South Korea - Year-over-year growth 2025-2030 (%)

12.3.5 Indonesia - Market size and forecast 2025-2030

Chart on Indonesia - Market size and forecast 2025-2030 ($ million)
Data Table on Indonesia - Market size and forecast 2025-2030 ($ million)
Chart on Indonesia - Year-over-year growth 2025-2030 (%)
Data Table on Indonesia - Year-over-year growth 2025-2030 (%)

12.3.6 Australia - Market size and forecast 2025-2030

Chart on Australia - Market size and forecast 2025-2030 ($ million)
Data Table on Australia - Market size and forecast 2025-2030 ($ million)
Chart on Australia - Year-over-year growth 2025-2030 (%)
Data Table on Australia - Year-over-year growth 2025-2030 (%)

12.4 North America - Market size and forecast 2025-2030

Chart on North America - Market size and forecast 2025-2030 ($ million)
Data Table on North America - Market size and forecast 2025-2030 ($ million)
Chart on North America - Year-over-year growth 2025-2030 (%)
Data Table on North America - Year-over-year growth 2025-2030 (%)
Chart on Regional Comparison - North America
Data Table on Regional Comparison - North America

12.4.1 US - Market size and forecast 2025-2030

Chart on US - Market size and forecast 2025-2030 ($ million)
Data Table on US - Market size and forecast 2025-2030 ($ million)
Chart on US - Year-over-year growth 2025-2030 (%)
Data Table on US - Year-over-year growth 2025-2030 (%)

12.4.2 Canada - Market size and forecast 2025-2030

Chart on Canada - Market size and forecast 2025-2030 ($ million)
Data Table on Canada - Market size and forecast 2025-2030 ($ million)
Chart on Canada - Year-over-year growth 2025-2030 (%)
Data Table on Canada - Year-over-year growth 2025-2030 (%)

12.4.3 Mexico - Market size and forecast 2025-2030

Chart on Mexico - Market size and forecast 2025-2030 ($ million)
Data Table on Mexico - Market size and forecast 2025-2030 ($ million)
Chart on Mexico - Year-over-year growth 2025-2030 (%)
Data Table on Mexico - Year-over-year growth 2025-2030 (%)

12.5 Europe - Market size and forecast 2025-2030

Chart on Europe - Market size and forecast 2025-2030 ($ million)
Data Table on Europe - Market size and forecast 2025-2030 ($ million)
Chart on Europe - Year-over-year growth 2025-2030 (%)
Data Table on Europe - Year-over-year growth 2025-2030 (%)
Chart on Regional Comparison - Europe
Data Table on Regional Comparison - Europe

12.5.1 Germany - Market size and forecast 2025-2030

Chart on Germany - Market size and forecast 2025-2030 ($ million)
Data Table on Germany - Market size and forecast 2025-2030 ($ million)
Chart on Germany - Year-over-year growth 2025-2030 (%)
Data Table on Germany - Year-over-year growth 2025-2030 (%)

12.5.2 UK - Market size and forecast 2025-2030

Chart on UK - Market size and forecast 2025-2030 ($ million)
Data Table on UK - Market size and forecast 2025-2030 ($ million)
Chart on UK - Year-over-year growth 2025-2030 (%)
Data Table on UK - Year-over-year growth 2025-2030 (%)

12.5.3 France - Market size and forecast 2025-2030

Chart on France - Market size and forecast 2025-2030 ($ million)
Data Table on France - Market size and forecast 2025-2030 ($ million)
Chart on France - Year-over-year growth 2025-2030 (%)
Data Table on France - Year-over-year growth 2025-2030 (%)

12.5.4 Italy - Market size and forecast 2025-2030

Chart on Italy - Market size and forecast 2025-2030 ($ million)
Data Table on Italy - Market size and forecast 2025-2030 ($ million)
Chart on Italy - Year-over-year growth 2025-2030 (%)
Data Table on Italy - Year-over-year growth 2025-2030 (%)

12.5.5 Spain - Market size and forecast 2025-2030

Chart on Spain - Market size and forecast 2025-2030 ($ million)
Data Table on Spain - Market size and forecast 2025-2030 ($ million)
Chart on Spain - Year-over-year growth 2025-2030 (%)
Data Table on Spain - Year-over-year growth 2025-2030 (%)

12.5.6 The Netherlands - Market size and forecast 2025-2030

Chart on The Netherlands - Market size and forecast 2025-2030 ($ million)
Data Table on The Netherlands - Market size and forecast 2025-2030 ($ million)
Chart on The Netherlands - Year-over-year growth 2025-2030 (%)
Data Table on The Netherlands - Year-over-year growth 2025-2030 (%)

12.6 South America - Market size and forecast 2025-2030

Chart on South America - Market size and forecast 2025-2030 ($ million)
Data Table on South America - Market size and forecast 2025-2030 ($ million)
Chart on South America - Year-over-year growth 2025-2030 (%)
Data Table on South America - Year-over-year growth 2025-2030 (%)
Chart on Regional Comparison - South America
Data Table on Regional Comparison - South America

12.6.1 Brazil - Market size and forecast 2025-2030

Chart on Brazil - Market size and forecast 2025-2030 ($ million)
Data Table on Brazil - Market size and forecast 2025-2030 ($ million)
Chart on Brazil - Year-over-year growth 2025-2030 (%)
Data Table on Brazil - Year-over-year growth 2025-2030 (%)

12.6.2 Argentina - Market size and forecast 2025-2030

Chart on Argentina - Market size and forecast 2025-2030 ($ million)
Data Table on Argentina - Market size and forecast 2025-2030 ($ million)
Chart on Argentina - Year-over-year growth 2025-2030 (%)
Data Table on Argentina - Year-over-year growth 2025-2030 (%)

12.6.3 Colombia - Market size and forecast 2025-2030

Chart on Colombia - Market size and forecast 2025-2030 ($ million)
Data Table on Colombia - Market size and forecast 2025-2030 ($ million)
Chart on Colombia - Year-over-year growth 2025-2030 (%)
Data Table on Colombia - Year-over-year growth 2025-2030 (%)

12.7 Middle East and Africa - Market size and forecast 2025-2030

Chart on Middle East and Africa - Market size and forecast 2025-2030 ($ million)
Data Table on Middle East and Africa - Market size and forecast 2025-2030 ($ million)
Chart on Middle East and Africa - Year-over-year growth 2025-2030 (%)
Data Table on Middle East and Africa - Year-over-year growth 2025-2030 (%)
Chart on Regional Comparison - Middle East and Africa
Data Table on Regional Comparison - Middle East and Africa

12.7.1 Saudi Arabia - Market size and forecast 2025-2030

Chart on Saudi Arabia - Market size and forecast 2025-2030 ($ million)
Data Table on Saudi Arabia - Market size and forecast 2025-2030 ($ million)
Chart on Saudi Arabia - Year-over-year growth 2025-2030 (%)
Data Table on Saudi Arabia - Year-over-year growth 2025-2030 (%)

12.7.2 UAE - Market size and forecast 2025-2030

Chart on UAE - Market size and forecast 2025-2030 ($ million)
Data Table on UAE - Market size and forecast 2025-2030 ($ million)
Chart on UAE - Year-over-year growth 2025-2030 (%)
Data Table on UAE - Year-over-year growth 2025-2030 (%)

12.7.3 South Africa - Market size and forecast 2025-2030

Chart on South Africa - Market size and forecast 2025-2030 ($ million)
Data Table on South Africa - Market size and forecast 2025-2030 ($ million)
Chart on South Africa - Year-over-year growth 2025-2030 (%)
Data Table on South Africa - Year-over-year growth 2025-2030 (%)

12.7.4 Israel - Market size and forecast 2025-2030

Chart on Israel - Market size and forecast 2025-2030 ($ million)
Data Table on Israel - Market size and forecast 2025-2030 ($ million)
Chart on Israel - Year-over-year growth 2025-2030 (%)
Data Table on Israel - Year-over-year growth 2025-2030 (%)

12.7.5 Turkey - Market size and forecast 2025-2030

Chart on Turkey - Market size and forecast 2025-2030 ($ million)
Data Table on Turkey - Market size and forecast 2025-2030 ($ million)
Chart on Turkey - Year-over-year growth 2025-2030 (%)
Data Table on Turkey - Year-over-year growth 2025-2030 (%)

12.8 Market opportunity by geography

Market opportunity by geography ($ million)
Data Tables on Market opportunity by geography ($ million)

13. Drivers, Challenges, and Opportunity

13.1 Market drivers

Transformative impact of ecommerce and omnichannel fulfillment
Persistent labor shortages and escalating operational costs
Proliferation of industry 4.0 and advanced technologies

13.2 Market challenges

High initial capital outlay and complex system integration
Widening skills gap and human capital transformation
Lack of standardization, interoperability, and rising cybersecurity threats

13.3 Impact of drivers and challenges

Impact of drivers and challenges in 2025 and 2030

13.4 Market opportunities

Proliferation of flexible automation and as-a-service models
Rise of integrated software-defined intralogistics ecosystems
Strategic focus on human augmentation and advanced ergonomics

14. Competitive Landscape

14.1 Overview

14.2

Overview on criticality of inputs and factors of differentiation

14.3 Landscape disruption

Overview on factors of disruption

14.4 Industry risks

Impact of key risks on business

15. Competitive Analysis

15.1 Companies profiled

Companies covered

15.2 Company ranking index

15.3 Market positioning of companies

Matrix on companies position and classification

15.4 Beumer Group GmbH and Co. KG

Beumer Group GmbH and Co. KG - Overview
Beumer Group GmbH and Co. KG - Product / Service
Beumer Group GmbH and Co. KG - Key offerings
SWOT

15.5 Columbus McKinnon Corp.

Columbus McKinnon Corp. - Overview
Columbus McKinnon Corp. - Product / Service
Columbus McKinnon Corp. - Key offerings
SWOT

15.6 Crown Equipment Corp.

Crown Equipment Corp. - Overview
Crown Equipment Corp. - Product / Service
Crown Equipment Corp. - Key offerings
SWOT

15.7 Daifuku Co. Ltd.

Daifuku Co. Ltd. - Overview
Daifuku Co. Ltd. - Product / Service
Daifuku Co. Ltd. - Key offerings
SWOT

15.8 Honeywell International Inc.

Honeywell International Inc. - Overview
Honeywell International Inc. - Business segments
Honeywell International Inc. - Key news
Honeywell International Inc. - Key offerings
Honeywell International Inc. - Segment focus
SWOT

15.9 Interroll Holding AG

Interroll Holding AG - Overview
Interroll Holding AG - Business segments
Interroll Holding AG - Key offerings
Interroll Holding AG - Segment focus
SWOT

15.10 Jungheinrich Group

Jungheinrich Group - Overview
Jungheinrich Group - Business segments
Jungheinrich Group - Key news
Jungheinrich Group - Key offerings
Jungheinrich Group - Segment focus
SWOT

15.11 KION GROUP AG

KION GROUP AG - Overview
KION GROUP AG - Business segments
KION GROUP AG - Key offerings
KION GROUP AG - Segment focus
SWOT

15.12 KUKA AG

KUKA AG - Overview
KUKA AG - Business segments
KUKA AG - Key offerings
KUKA AG - Segment focus
SWOT

15.13 Liebherr International AG

Liebherr International AG - Overview
Liebherr International AG - Product / Service
Liebherr International AG - Key offerings
SWOT

15.14 Mitsubishi Chemical Grp.

Mitsubishi Chemical Grp. - Overview
Mitsubishi Chemical Grp. - Business segments
Mitsubishi Chemical Grp. - Key news
Mitsubishi Chemical Grp. - Key offerings
Mitsubishi Chemical Grp. - Segment focus
SWOT

15.15 Murata Manufacturing Co. Ltd.

Murata Manufacturing Co. Ltd. - Overview
Murata Manufacturing Co. Ltd. - Business segments
Murata Manufacturing Co. Ltd. - Key news
Murata Manufacturing Co. Ltd. - Key offerings
Murata Manufacturing Co. Ltd. - Segment focus
SWOT

15.16 NACCO Industries Inc.

NACCO Industries Inc. - Overview
NACCO Industries Inc. - Business segments
NACCO Industries Inc. - Key offerings
NACCO Industries Inc. - Segment focus
SWOT

15.17 SSI Schafer IT Solutions GmbH

SSI Schafer IT Solutions GmbH - Overview
SSI Schafer IT Solutions GmbH - Product / Service
SSI Schafer IT Solutions GmbH - Key offerings
SWOT

15.18 Toyota Industries Corp.

Toyota Industries Corp. - Overview
Toyota Industries Corp. - Business segments
Toyota Industries Corp. - Key news
Toyota Industries Corp. - Key offerings
Toyota Industries Corp. - Segment focus
SWOT

16. Appendix

16.1 Scope of the report

Market definition
Objectives
Notes and caveats

16.2 Inclusions and exclusions checklist

Inclusions checklist
Exclusions checklist

16.3 Currency conversion rates for US$

16.4 Research methodology

16.5 Data procurement

Information sources

16.6 Data validation

16.7 Validation techniques employed for market sizing

16.8 Data synthesis

16.9 360 degree market analysis

16.10 List of abbreviations

Research Methodology

Technavio presents a detailed picture of the market by way of study, synthesis, and summation of data from multiple sources. The analysts have presented the various facets of the market with a particular focus on identifying the key industry influencers. The data thus presented is comprehensive, reliable, and the result of extensive research, both primary and secondary.

INFORMATION SOURCES

Primary sources

  • Manufacturers and suppliers
  • Channel partners
  • Industry experts
  • Strategic decision makers

Secondary sources

  • Industry journals and periodicals
  • Government data
  • Financial reports of key industry players
  • Historical data
  • Press releases

DATA ANALYSIS

Data Synthesis

  • Collation of data
  • Estimation of key figures
  • Analysis of derived insights

Data Validation

  • Triangulation with data models
  • Reference against proprietary databases
  • Corroboration with industry experts

REPORT WRITING

Qualitative

  • Market drivers
  • Market challenges
  • Market trends
  • Five forces analysis

Quantitative

  • Market size and forecast
  • Market segmentation
  • Geographical insights
  • Competitive landscape

Interested in this report?

Get your sample now to see our research methodology and insights!

Download Now

Frequently Asked Questions

Material Handling Equipment market growth will increase by USD 18786.0 million during 2026-2030.

The Material Handling Equipment market is expected to grow at a CAGR of 7.2% during 2026-2030.

Material Handling Equipment market is segmented by Type (Cranes and lifting equipment, Industrial trucks, Continuous handling equipment, Racking and storage equipment) Application (Construction, Ecommerce, Food and beverages, Automotive, Others) Product type (Manual, Semi automated, Fully automated)

Beumer Group GmbH and Co. KG, Columbus McKinnon Corp., Crown Equipment Corp., Daifuku Co. Ltd., FlexLink Holding AB, Honeywell International Inc., Hytrol Conveyor Co., Interlake Mecalux Inc., Interroll Holding AG, Jungheinrich Group, KION GROUP AG, KUKA AG, Liebherr International AG, Mitsubishi Chemical Grp., Murata Manufacturing Co. Ltd., NACCO Industries Inc., SSI Schafer IT Solutions GmbH, Toyota Industries Corp., viastore SYSTEMS GmbH are a few of the key vendors in the Material Handling Equipment market.

APAC will register the highest growth rate of 42.7% among the other regions. Therefore, the Material Handling Equipment market in APAC is expected to garner significant business opportunities for the vendors during the forecast period.

China, Japan, India, South Korea, Indonesia, Australia, US, Canada, Mexico, Germany, UK, France, Italy, Spain, The Netherlands, Brazil, Argentina, Colombia, Saudi Arabia, UAE, South Africa, Israel, Turkey

  • Transformative impact of ecommerce and omnichannel fulfillment is the driving factor this market.

The Material Handling Equipment market vendors should focus on grabbing business opportunities from the Type segment as it accounted for the largest market share in the base year.