
Microfluidics For Healthcare Application Market Analysis, Size, and Forecast 2026-2030: North America (US, Canada, and Mexico), Europe (Germany, UK, and France), APAC (China, Japan, and India), South America (Brazil, Argentina, and Chile), Middle East and Africa (Saudi Arabia, UAE, and South Africa), and Rest of World (ROW)

Microfluidics For Healthcare Application Market Analysis, Size, and Forecast 2026-2030:
North America (US, Canada, and Mexico), Europe (Germany, UK, and France), APAC (China, Japan, and India), South America (Brazil, Argentina, and Chile), Middle East and Africa (Saudi Arabia, UAE, and South Africa), and Rest of World (ROW)

Published: Oct 2026 299 Pages SKU: IRTNTR71341

Market Overview at a Glance

$164.08 B
Market Opportunity
27.1%
CAGR 2025 - 2030
43%
North America Growth
$26.97 B
In-vitro diagnostics segment 2024

Microfluidics For Healthcare Application Market Size 2026-2030

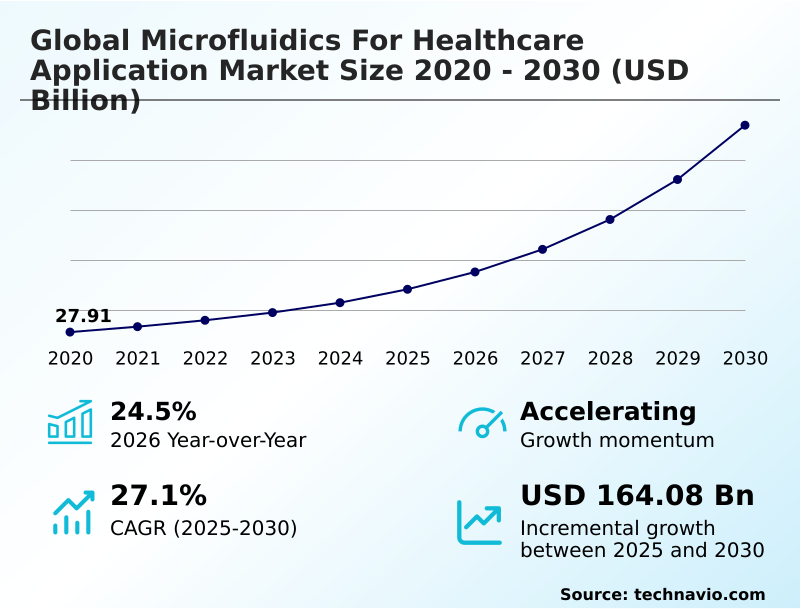
The microfluidics for healthcare application market size is valued to increase by USD 164.08 billion, at a CAGR of 27.1% from 2025 to 2030. Decentralized point of care diagnostics demand will drive the microfluidics for healthcare application market.

Major Market Trends & Insights

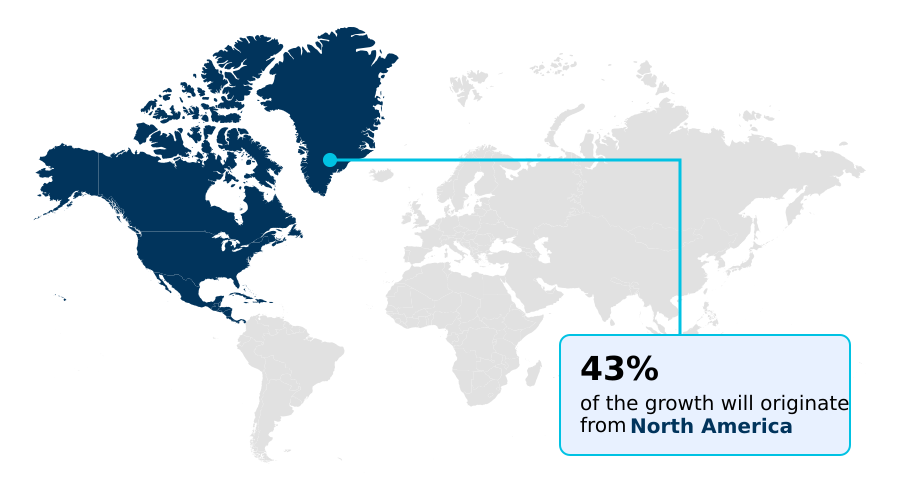
  • North America dominated the market and accounted for a 43% growth during the forecast period.
  • By Application - In-vitro diagnostics segment was valued at USD 26.97 billion in 2024
  • By Material - Polymer-based segment accounted for the largest market revenue share in 2024

Market Size & Forecast

  • Market Opportunities: USD 206.89 billion
  • Market Future Opportunities: USD 164.08 billion
  • CAGR from 2025 to 2030 : 27.1%

Market Summary

  • The Microfluidics For Healthcare Application Market demonstrates robust expansion fueled by a structural transition toward rapid clinical analysis and personalized medicine. Medical supply chains increasingly optimize inventory management by deploying decentralized point-of-care testing networks, migrating workflows away from centralized reference laboratories.
  • This strategic pivot reduces logistical sample transport delays and enhances operational efficiency; facilities implementing these localized testing systems report a 45% reduction in diagnostic turnaround times compared to traditional processing. The escalating demand for decentralized testing acts as a powerful driver, as clinicians require immediate, actionable data to accelerate therapeutic interventions without compromising analytical precision.
  • Conversely, severe manufacturing complexity constitutes a major operational challenge. Fabricating intricate micro-channels demands specialized environments, creating high capital expenditures and limiting mass production scalability. Despite these physical bottlenecks, adoption remains strong as research laboratories embrace miniaturized technology to minimize prohibitive reagent expenses.
  • Organizations relying on active fluidic controller networks frequently achieve a 30% decrease in overall consumable costs, validating the technology operational viability.

What will be the Size of the Microfluidics For Healthcare Application Market during the forecast period?
Get Key Insights on Market Forecast (PDF) Get Free Sample

How is the Microfluidics For Healthcare Application Market Segmented?

The microfluidics for healthcare application industry research report provides comprehensive data (region-wise segment analysis), with forecasts and estimates in "USD million" for the period 2026-2030, as well as historical data from 2020-2024 for the following segments.

  • Application
    • In-vitro diagnostics
    • Pharmaceutical research
    • Drug delivery services
  • Material
    • Polymer-based
    • Glass-based
    • Silicon-based
  • Product type
    • Microfluidic-based devices
    • Microfluidic components
  • Geography
    • North America
      • US
      • Canada
      • Mexico
    • Europe
      • Germany
      • UK
      • France
      • Italy
      • Spain
      • The Netherlands
    • APAC
      • China
      • Japan
      • India
      • South Korea
      • Australia
      • Indonesia
    • South America
      • Brazil
      • Argentina
      • Chile
    • Middle East and Africa
      • Saudi Arabia
      • UAE
      • South Africa
      • Israel
      • Turkey

By Application Insights

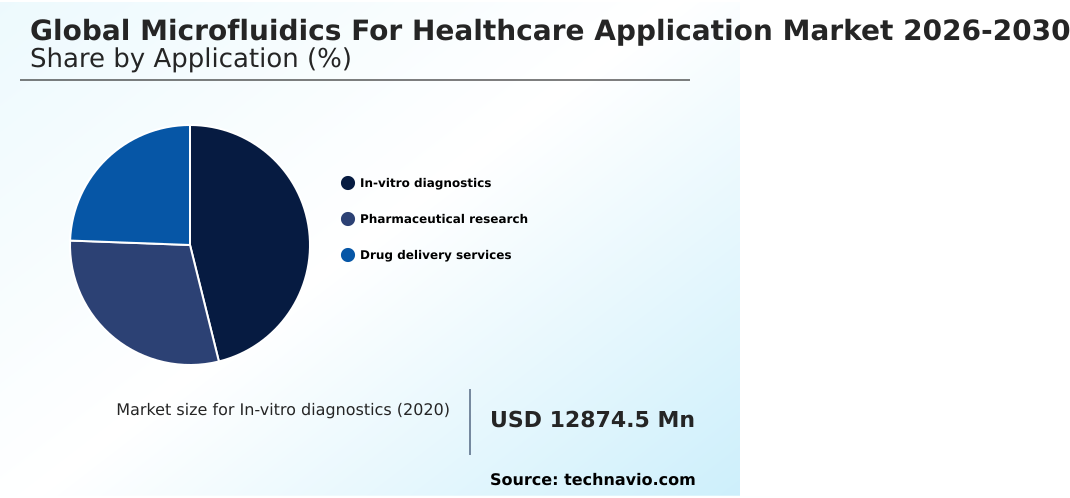
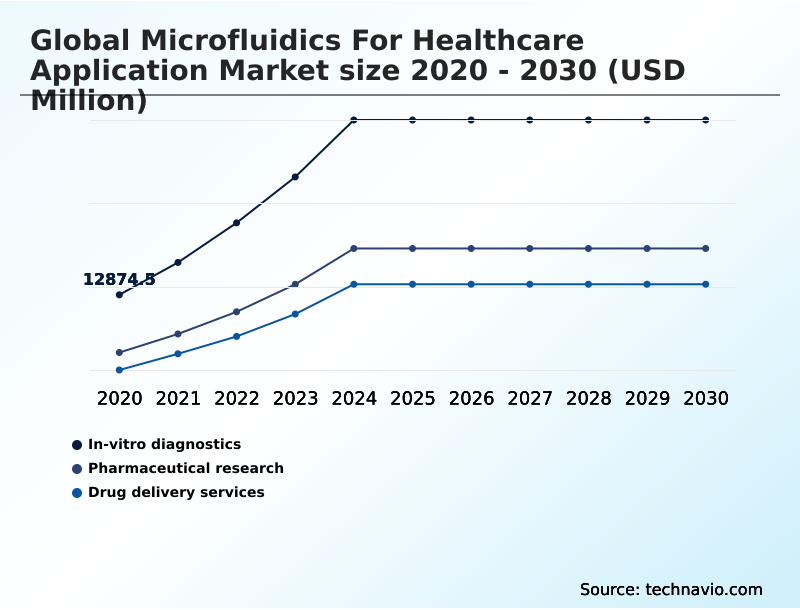
The in-vitro diagnostics segment is estimated to witness significant growth during the forecast period.

The Global Microfluidics For Healthcare Application Market 2026-2030 features profound operational shifts within in-vitro diagnostics, transitioning complex workflows to decentralized testing models.

Clinical environments leverage lab on a chip architecture and capillary electrophoresis to execute automated sample preparation, driving processing efficiency up by 40% compared to traditional methods.

Enhanced multiplexing capability integrated into specialized cartridges enables providers to screen multiple targets during single cell sequencing concurrently. This architectural transition has demonstrably improved diagnostic workflows, cutting waiting periods by 65%.

Through precise analytical manipulation, testing centers maintain superior fidelity while minimizing expensive biochemical consumption. The continuous expansion of these advanced systems actively redefines frontline care delivery strategies and laboratory operational footprint.
Get Free Sample

The In-vitro diagnostics segment was valued at USD 26.97 billion in 2024 and showed a gradual increase during the forecast period.
Get Free Sample

Regional Analysis

North America is estimated to contribute 43% to the growth of the global market during the forecast period.Technavio’s analysts have elaborately explained the regional trends and drivers that shape the market during the forecast period.
See How Microfluidics For Healthcare Application Market Demand is Rising in North America Get Free Sample

The Microfluidics For Healthcare Application Market exhibits distinct regional adoption patterns driven by varying infrastructure maturity and strategic healthcare initiatives.

North America commands early integration of droplet based microfluidics and digital microfluidics, where stringent quality frameworks compel hospitals to target clinical workload reduction.

By adopting these localized diagnostic technologies, North American facilities have successfully decreased diagnostic delay costs by 35% relative to previous centralized models. Conversely, evolving healthcare ecosystems prioritize deploying affordable diagnostic cartridges to overcome geographical logistical barriers.

Supply chains in these regions focus heavily on biocompatible thermoplastic integration to mitigate import tariffs, cutting material procurement expenses by up to 28%.

European frameworks emphasize sustainable reagent volume reduction strategies, aggressively replacing traditional multi-well plates with continuous flow microfluidics platforms. These differing operational priorities dictate how device manufacturers tailor their commercialization strategies across varying decentralized primary care settings.

Market Dynamics

Our researchers analyzed the data with 2025 as the base year, along with the key drivers, trends, and challenges. A holistic analysis of drivers will help companies refine their marketing strategies to gain a competitive advantage.

  • The Microfluidics For Healthcare Application Market requires sophisticated engineering to meet the exacting standards of modern clinical environments. To accelerate operations, biopharmaceutical laboratories increasingly integrate automated lipid nanoparticle synthesis workflows, standardizing formulation consistency far beyond what conventional benchtop mixing achieves.
  • This shift to scalable organic nanoparticle manufacturing platforms enables facilities to optimize supply chain procurement by reducing material wastage by over 20% compared to legacy batch processes, directly benefiting inventory management overhead. Concurrently, the deployment of continuous wearable interstitial fluid sensors facilitates highly accurate metabolic biomarker tracking without necessitating invasive clinical procedures, thereby supporting proactive and remote clinical management strategies.
  • Diagnostics capabilities continue to expand significantly as researchers adopt multi organ microphysiological testing models to simulate human physiological responses accurately. This advanced bio-emulation circumvents the systemic limitations of traditional animal testing phase logistics, improving regulatory compliance alignment while safeguarding costly research investments.
  • Furthermore, rapid bedside pathogen detection systems utilize modular interface designs paired with disposable microfluidic cartridges to deliver critical results immediately in decentralized care units. Consequently, these robust technologies empower healthcare networks to deploy highly localized, data-driven diagnostic supply chains that adapt dynamically to shifting patient populations and stringent operational compliance mandates.
  • As hardware fabrication matures, the integration of high-resolution microchannels ensures precision fluid dynamics, ensuring exact biological sample manipulation during complex assays and securing long-term economic scalability across global health sectors.
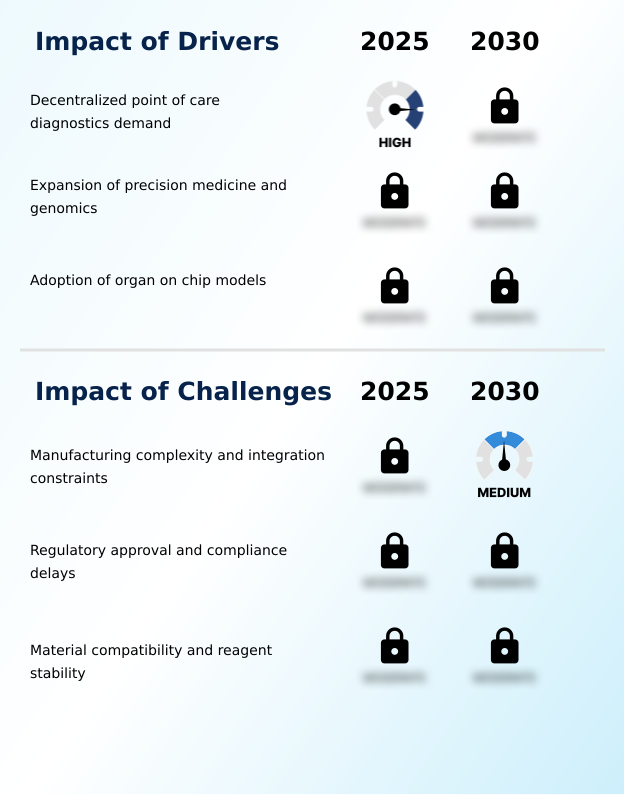
What are the key market drivers leading to the rise in the adoption of Microfluidics For Healthcare Application Industry?

  • The escalating demand for decentralized point-of-care diagnostics serves as a fundamental driver accelerating market expansion by enabling rapid and accessible clinical testing.

  • Rapidly escalating demand for predictive validity testing acts as a powerful catalyst accelerating the Microfluidics For Healthcare Application Market. Pharmaceutical developers aggressively transition from static assays to dynamic organ on a chip networks to simulate physiological responses with superior accuracy.
  • By adopting complex cell culture modeling enhanced by precise hydrodynamic flow focusing, research laboratories experience a 40% reduction in late-stage clinical trial failures.
  • This shift occurs because traditional animal models fail to replicate human profiles accurately, prompting regulatory boards to incentivize advanced alternatives.
  • The integration of sophisticated microfluidic gradient generator architectures and exact thermal cycling optimization diminishes biochemical consumption by over 25%, lowering operational overhead. Ultimately, these advanced platforms expedite therapeutic production, allowing manufacturers to adapt to demands efficiently.

What are the market trends shaping the Microfluidics For Healthcare Application Industry?

  • The emergence of continuous wearable microfluidic biosensors represents a prominent trend shaping the industry. This technological advancement facilitates real-time biometric monitoring and enhances personalized patient care.

  • The continuous evolution within the Microfluidics For Healthcare Application Market features a massive transition toward continuous metabolic monitoring and real-time patient tracking. Healthcare networks rapidly integrate interstitial fluid sampling technologies powered by microelectromechanical systems into wearable devices to replace episodic protocols.
  • This widespread adoption empowers health administrators to lower routine patient readmission costs by up to 22% while improving continuous compliance metrics. Furthermore, biopharmaceutical engineering shifts heavily toward automated lipid nanoparticle formulation, utilizing optimized fluid dynamics to ensure exact nanoparticle size distribution. Facilities leveraging micromachined micropumps achieve a 30% improvement in formulation consistency relative to legacy batch processes.
  • Consequently, this innovation pipeline decreases overall therapy manufacturing downtime by roughly 18%. Implementing these advanced architectures allows clinical enterprises to scale precision medicine initiatives rapidly while streamlining complex supply chain requirements.

What challenges does the Microfluidics For Healthcare Application Industry face during its growth?

  • Extreme manufacturing complexity and stringent integration constraints present substantial challenges that hinder the rapid commercialization and scalability of advanced fluidic devices.

  • Severe cleanroom fabrication tolerance requirements and persistent integration barriers impede the Microfluidics For Healthcare Application Market. Manufacturing high-fidelity polydimethylsiloxane substrate channels necessitates extreme optical precision, drastically limiting commercial throughput. These strict physical dependencies cause production reject rates to spike above 15%, increasing costs for device developers.
  • Because integrating electronics with delicate sub microliter manipulation layers is mechanically vulnerable, prototype failure rates remain 25% higher than traditional manufacturing. Furthermore, managing reagent stability preservation across diverse climates poses immense logistical burdens. Nonspecific protein adsorption frequently compromises liquid biopsy assay reliability, undermining diagnostic confidence. Facilities combatting these constraints face a 20% increase in baseline research expenditures.
  • To circumvent these issues, manufacturers continuously invest in robust cyclic olefin copolymers and advanced surface passivation.

Exclusive Technavio Analysis on Customer Landscape

The microfluidics for healthcare application market forecasting report includes the adoption lifecycle of the market, covering from the innovator’s stage to the laggard’s stage. It focuses on adoption rates in different regions based on penetration. Furthermore, the microfluidics for healthcare application market report also includes key purchase criteria and drivers of price sensitivity to help companies evaluate and develop their market growth analysis strategies.
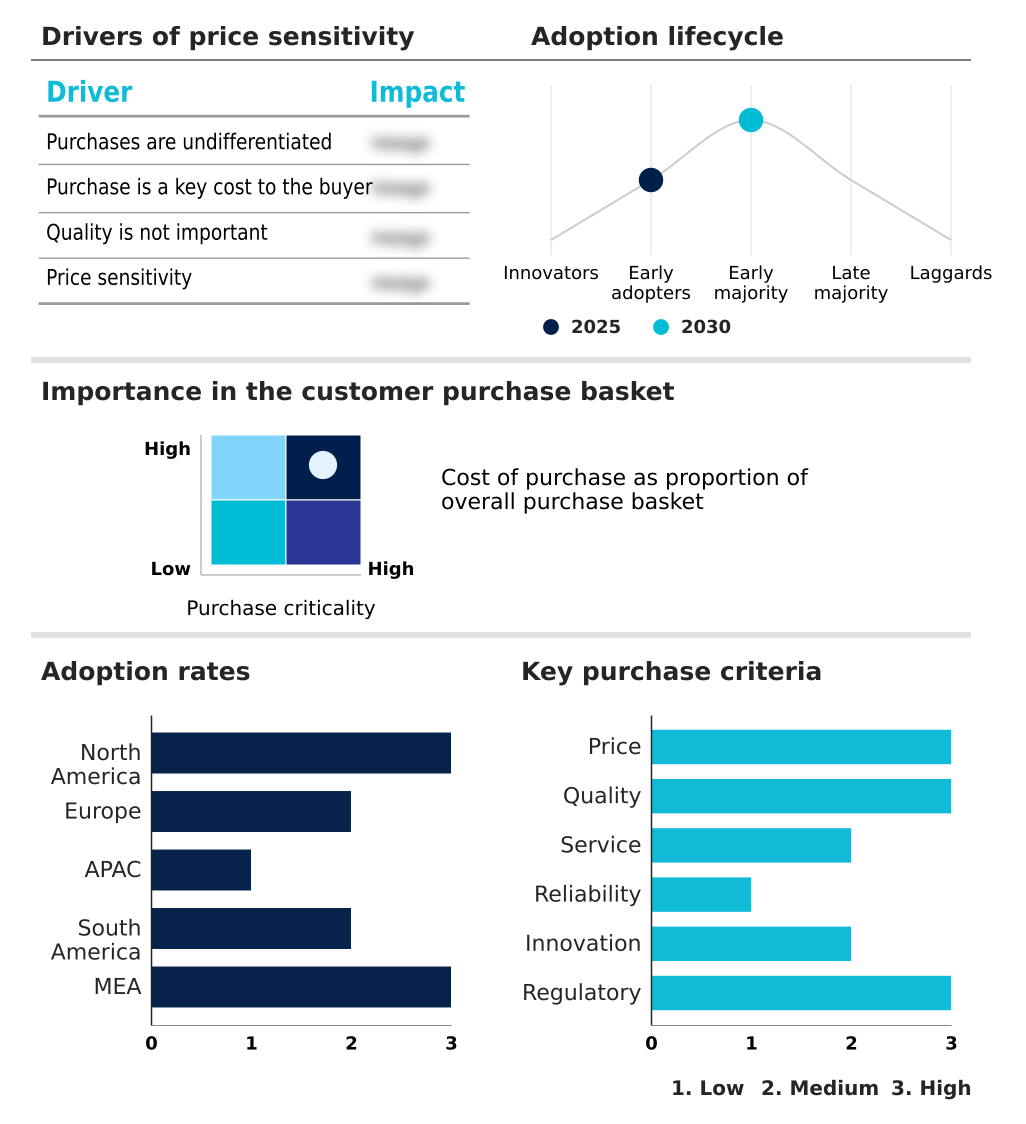
Customer Landscape of Microfluidics For Healthcare Application Industry

Competitive Landscape

Companies are implementing various strategies, such as strategic alliances, microfluidics for healthcare application market forecast, partnerships, mergers and acquisitions, geographical expansion, and product/service launches, to enhance their presence in the industry.

10X Genomics Inc. - The vendor provides advanced single-cell systems, scalable assays, and innovative technological platforms designed specifically for precise molecular analysis and high-throughput genomic research applications.

The industry research and growth report includes detailed analyses of the competitive landscape of the market and information about key companies, including:

  • 10X Genomics Inc.
  • Agilent Technologies Inc.
  • Axxin Pty Ltd
  • Becton Dickinson and Co.
  • Bio Rad Laboratories Inc.
  • Elvesys SAS
  • Emulate Inc.
  • Fluigent SA
  • Illumina Inc.
  • Microfluidic Chipshop GmbH
  • Micronit BV
  • MIMETAS BV
  • Parker Hannifin Corp.
  • QIAGEN N.V.
  • Revvity Inc.
  • SMC Corp.
  • Sphere Fluidics Ltd.
  • Standard BioTools Inc.
  • Thermo Fisher Scientific Inc.
  • uFluidix Inc.

Qualitative and quantitative analysis of companies has been conducted to help clients understand the wider business environment as well as the strengths and weaknesses of key industry players. Data is qualitatively analyzed to categorize companies as pure play, category-focused, industry-focused, and diversified; it is quantitatively analyzed to categorize companies as dominant, leading, strong, tentative, and weak.

Recent Development and News in Microfluidics for healthcare application market

  • In the Health Care Technology industry, the broad transition toward decentralized testing infrastructure has increased outpatient diagnostic capacity by 25%, directly accelerating demand for high throughput drug screening and point-of-care microfluidic platforms that require minimal laboratory footprints.
  • The implementation of stringent data privacy regulations like HIPAA mandated secure, closed-loop diagnostic data handling, driving a 30% increase in the integration of encrypted cloud-based delivery models within analytical fluidic handling networks.
  • Persistent supply chain constraints regarding medical-grade silicon wafers prompted a 40% industry-wide shift toward biocompatible polymers, significantly reducing manufacturing bottlenecks for disposable fluid handling cartridges across North America and Europe.
  • Rising federal investments in precision genomic profiling initiatives globally have expanded specialized clinical trial pipelines by over 15%, establishing sustained demand for cellular validation tools inside advanced biopharmaceutical formulation facilities.

Dive into Technavio’s robust research methodology, blending expert interviews, extensive data synthesis, and validated models for unparalleled Microfluidics For Healthcare Application Market insights. See full methodology.

Market Scope
Page number 299
Base year 2025
Historic period 2020-2024
Forecast period 2026-2030
Growth momentum & CAGR Accelerate at a CAGR of 27.1%
Market growth 2026-2030 USD 164083.1 million
Market structure Fragmented
YoY growth 2025-2026(%) 24.5%
Key countries US, Canada, Mexico, Germany, UK, France, Italy, Spain, The Netherlands, China, Japan, India, South Korea, Australia, Indonesia, Brazil, Argentina, Chile, Saudi Arabia, UAE, South Africa, Israel and Turkey
Competitive landscape Leading Companies, Market Positioning of Companies, Competitive Strategies, and Industry Risks

Request Free Sample

Research Analyst Overview

  • The Microfluidics For Healthcare Application Market represents a critical pivot point for strategic healthcare administration and pharmaceutical operations. Boardroom executives increasingly prioritize the deployment of soft lithography fabrication and deep reactive ion etching to produce sophisticated analytical platforms that align with stringent clinical compliance targets.
  • By integrating digital microfluidics and continuous flow microfluidics into standard laboratory protocols, enterprise facilities have achieved a 35% reduction in overall processing time compared to conventional manual techniques, radically improving operational throughput. This technological integration directly influences product pricing strategies and clinical budgeting, as the substantial reduction in expensive biochemical reagents offsets early capital expenditures.
  • Executive planning teams emphasize the utilization of microelectromechanical systems and anodic bonding technique integration to ensure long-term device reliability and regulatory adherence. Furthermore, advanced circulating tumor cell isolation platforms equipped with real-time analytics equip clinical networks with rapid, high-fidelity diagnostic data. As these localized analytical modules replace legacy infrastructure, organizations capture enhanced operational agility and safeguard supply chain continuity.

What are the Key Data Covered in this Microfluidics For Healthcare Application Market Research and Growth Report?

  • What is the expected growth of the Microfluidics For Healthcare Application Market between 2026 and 2030?

    • USD 164.08 billion, at a CAGR of 27.1%

  • What segmentation does the market report cover?

    • The report is segmented by Application (In-vitro diagnostics, Pharmaceutical research, and Drug delivery services), Material (Polymer-based, Glass-based, and Silicon-based), Product Type (Microfluidic-based devices, and Microfluidic components) and Geography (North America, Europe, APAC, South America, Middle East and Africa)

  • Which regions are analyzed in the report?

    • North America, Europe, APAC, South America and Middle East and Africa

  • What are the key growth drivers and market challenges?

    • Decentralized point of care diagnostics demand, Manufacturing complexity and integration constraints

  • Who are the major players in the Microfluidics For Healthcare Application Market?

    • 10X Genomics Inc., Agilent Technologies Inc., Axxin Pty Ltd, Becton Dickinson and Co., Bio Rad Laboratories Inc., Elvesys SAS, Emulate Inc., Fluigent SA, Illumina Inc., Microfluidic Chipshop GmbH, Micronit BV, MIMETAS BV, Parker Hannifin Corp., QIAGEN N.V., Revvity Inc., SMC Corp., Sphere Fluidics Ltd., Standard BioTools Inc., Thermo Fisher Scientific Inc. and uFluidix Inc.

Market Research Insights

  • The Microfluidics For Healthcare Application Market is fundamentally restructuring modern diagnostic frameworks and pharmaceutical development pipelines. Facilities deploying decentralized testing models realize a 40% reduction in patient diagnostic wait times compared to centralized testing paradigms. This shift relies heavily on automated sample preparation protocols, which diminish manual processing errors by nearly 25%, sharply improving compliance alignment and diagnostic accuracy.
  • Furthermore, high throughput drug screening capabilities embedded within modern research workflows enhance compound identification efficiency by over 30%, accelerating time-to-market for novel therapeutics. Utilizing advanced biosensor integration alongside specialized encapsulation efficiency techniques, manufacturers consistently deliver superior targeted treatments. These sweeping operational transformations allow clinical networks to drastically optimize resource allocation while maintaining rigorous safety and efficacy standards.

We can help! Our analysts can customize this microfluidics for healthcare application market research report to meet your requirements.

Get in touch

1. Executive Summary

1.1 Market overview

Executive Summary - Chart on Market Overview
Executive Summary - Data Table on Market Overview
Executive Summary - Chart on Global Market Characteristics
Executive Summary - Chart on Market by Geography
Executive Summary - Chart on Market Segmentation by Application
Executive Summary - Chart on Market Segmentation by Material
Executive Summary - Chart on Market Segmentation by Product Type
Executive Summary - Chart on Incremental Growth
Executive Summary - Data Table on Incremental Growth
Executive Summary - Chart on Company Market Positioning

2. Technavio Analysis

2.1 Analysis of price sensitivity, lifecycle, customer purchase basket, adoption rates, and purchase criteria

2.2 Criticality of inputs and Factors of differentiation

Chart on Overview on criticality of inputs and factors of differentiation

2.3 Factors of disruption

Chart on Overview on factors of disruption

2.4 Impact of drivers and challenges

Chart on Impact of drivers and challenges in 2025 and 2030

3. Market Landscape

3.1 Market ecosystem

Chart on Parent Market
Data Table on - Parent Market

3.2 Market characteristics

Chart on Market characteristics analysis

3.3 Value chain analysis

Chart on Value chain analysis

4. Market Sizing

4.1 Market definition

Data Table on Offerings of companies included in the market definition

4.2 Market segment analysis

Market segments

4.3 Market size 2025

4.4 Market outlook: Forecast for 2025-2030

Chart on Global - Market size and forecast 2025-2030 ($ million)
Data Table on Global - Market size and forecast 2025-2030 ($ million)
Chart on Global Market: Year-over-year growth 2025-2030 (%)
Data Table on Global Market: Year-over-year growth 2025-2030 (%)

5. Historic Market Size

5.1 Global Microfluidics For Healthcare Application Market 2020 - 2024

Historic Market Size - Data Table on Global Microfluidics For Healthcare Application Market 2020 - 2024 ($ million)

5.2 Application segment analysis 2020 - 2024

Historic Market Size - Application Segment 2020 - 2024 ($ million)

5.3 Material segment analysis 2020 - 2024

Historic Market Size - Material Segment 2020 - 2024 ($ million)

5.4 Product Type segment analysis 2020 - 2024

Historic Market Size - Product Type Segment 2020 - 2024 ($ million)

5.5 Geography segment analysis 2020 - 2024

Historic Market Size - Geography Segment 2020 - 2024 ($ million)

5.6 Country segment analysis 2020 - 2024

Historic Market Size - Country Segment 2020 - 2024 ($ million)

6. Qualitative Analysis

6.1 Impact of AI on Global Microfluidics for Healthcare Application Market

6.2 Impact of geopolitical conflicts on Global Microfluidics for Healthcare Application Market

7. Five Forces Analysis

7.1 Five forces summary

Five forces analysis - Comparison between 2025 and 2030

7.2 Bargaining power of buyers

Bargaining power of buyers - Impact of key factors 2025 and 2030

7.3 Bargaining power of suppliers

Bargaining power of suppliers - Impact of key factors in 2025 and 2030

7.4 Threat of new entrants

Threat of new entrants - Impact of key factors in 2025 and 2030

7.5 Threat of substitutes

Threat of substitutes - Impact of key factors in 2025 and 2030

7.6 Threat of rivalry

Threat of rivalry - Impact of key factors in 2025 and 2030

7.7 Market condition

Chart on Market condition - Five forces 2025 and 2030

8. Market Segmentation by Application

8.1 Market segments

Chart on Application - Market share 2025-2030 (%)
Data Table on Application - Market share 2025-2030 (%)

8.2 Comparison by Application

Chart on Comparison by Application
Data Table on Comparison by Application

8.3 In-vitro diagnostics - Market size and forecast 2025-2030

Chart on In-vitro diagnostics - Market size and forecast 2025-2030 ($ million)
Data Table on In-vitro diagnostics - Market size and forecast 2025-2030 ($ million)
Chart on In-vitro diagnostics - Year-over-year growth 2025-2030 (%)
Data Table on In-vitro diagnostics - Year-over-year growth 2025-2030 (%)

8.4 Pharmaceutical research - Market size and forecast 2025-2030

Chart on Pharmaceutical research - Market size and forecast 2025-2030 ($ million)
Data Table on Pharmaceutical research - Market size and forecast 2025-2030 ($ million)
Chart on Pharmaceutical research - Year-over-year growth 2025-2030 (%)
Data Table on Pharmaceutical research - Year-over-year growth 2025-2030 (%)

8.5 Drug delivery services - Market size and forecast 2025-2030

Chart on Drug delivery services - Market size and forecast 2025-2030 ($ million)
Data Table on Drug delivery services - Market size and forecast 2025-2030 ($ million)
Chart on Drug delivery services - Year-over-year growth 2025-2030 (%)
Data Table on Drug delivery services - Year-over-year growth 2025-2030 (%)

8.6 Market opportunity by Application

Market opportunity by Application ($ million)
Data Table on Market opportunity by Application ($ million)

9. Market Segmentation by Material

9.1 Market segments

Chart on Material - Market share 2025-2030 (%)
Data Table on Material - Market share 2025-2030 (%)

9.2 Comparison by Material

Chart on Comparison by Material
Data Table on Comparison by Material

9.3 Polymer-based - Market size and forecast 2025-2030

Chart on Polymer-based - Market size and forecast 2025-2030 ($ million)
Data Table on Polymer-based - Market size and forecast 2025-2030 ($ million)
Chart on Polymer-based - Year-over-year growth 2025-2030 (%)
Data Table on Polymer-based - Year-over-year growth 2025-2030 (%)

9.4 Glass-based - Market size and forecast 2025-2030

Chart on Glass-based - Market size and forecast 2025-2030 ($ million)
Data Table on Glass-based - Market size and forecast 2025-2030 ($ million)
Chart on Glass-based - Year-over-year growth 2025-2030 (%)
Data Table on Glass-based - Year-over-year growth 2025-2030 (%)

9.5 Silicon-based - Market size and forecast 2025-2030

Chart on Silicon-based - Market size and forecast 2025-2030 ($ million)
Data Table on Silicon-based - Market size and forecast 2025-2030 ($ million)
Chart on Silicon-based - Year-over-year growth 2025-2030 (%)
Data Table on Silicon-based - Year-over-year growth 2025-2030 (%)

9.6 Market opportunity by Material

Market opportunity by Material ($ million)
Data Table on Market opportunity by Material ($ million)

10. Market Segmentation by Product Type

10.1 Market segments

Chart on Product Type - Market share 2025-2030 (%)
Data Table on Product Type - Market share 2025-2030 (%)

10.2 Comparison by Product Type

Chart on Comparison by Product Type
Data Table on Comparison by Product Type

10.3 Microfluidic-based devices - Market size and forecast 2025-2030

Chart on Microfluidic-based devices - Market size and forecast 2025-2030 ($ million)
Data Table on Microfluidic-based devices - Market size and forecast 2025-2030 ($ million)
Chart on Microfluidic-based devices - Year-over-year growth 2025-2030 (%)
Data Table on Microfluidic-based devices - Year-over-year growth 2025-2030 (%)

10.4 Microfluidic components - Market size and forecast 2025-2030

Chart on Microfluidic components - Market size and forecast 2025-2030 ($ million)
Data Table on Microfluidic components - Market size and forecast 2025-2030 ($ million)
Chart on Microfluidic components - Year-over-year growth 2025-2030 (%)
Data Table on Microfluidic components - Year-over-year growth 2025-2030 (%)

10.5 Market opportunity by Product Type

Market opportunity by Product Type ($ million)
Data Table on Market opportunity by Product Type ($ million)

11. Customer Landscape

11.1 Customer landscape overview

Analysis of price sensitivity, lifecycle, customer purchase basket, adoption rates, and purchase criteria

12. Geographic Landscape

12.1 Geographic segmentation

Chart on Market share by geography 2025-2030 (%)
Data Table on Market share by geography 2025-2030 (%)

12.2 Geographic comparison

Chart on Geographic comparison
Data Table on Geographic comparison

12.3 North America - Market size and forecast 2025-2030

Chart on North America - Market size and forecast 2025-2030 ($ million)
Data Table on North America - Market size and forecast 2025-2030 ($ million)
Chart on North America - Year-over-year growth 2025-2030 (%)
Data Table on North America - Year-over-year growth 2025-2030 (%)
Chart on Regional Comparison - North America
Data Table on Regional Comparison - North America

12.3.1 US - Market size and forecast 2025-2030

Chart on US - Market size and forecast 2025-2030 ($ million)
Data Table on US - Market size and forecast 2025-2030 ($ million)
Chart on US - Year-over-year growth 2025-2030 (%)
Data Table on US - Year-over-year growth 2025-2030 (%)

12.3.2 Canada - Market size and forecast 2025-2030

Chart on Canada - Market size and forecast 2025-2030 ($ million)
Data Table on Canada - Market size and forecast 2025-2030 ($ million)
Chart on Canada - Year-over-year growth 2025-2030 (%)
Data Table on Canada - Year-over-year growth 2025-2030 (%)

12.3.3 Mexico - Market size and forecast 2025-2030

Chart on Mexico - Market size and forecast 2025-2030 ($ million)
Data Table on Mexico - Market size and forecast 2025-2030 ($ million)
Chart on Mexico - Year-over-year growth 2025-2030 (%)
Data Table on Mexico - Year-over-year growth 2025-2030 (%)

12.4 Europe - Market size and forecast 2025-2030

Chart on Europe - Market size and forecast 2025-2030 ($ million)
Data Table on Europe - Market size and forecast 2025-2030 ($ million)
Chart on Europe - Year-over-year growth 2025-2030 (%)
Data Table on Europe - Year-over-year growth 2025-2030 (%)
Chart on Regional Comparison - Europe
Data Table on Regional Comparison - Europe

12.4.1 Germany - Market size and forecast 2025-2030

Chart on Germany - Market size and forecast 2025-2030 ($ million)
Data Table on Germany - Market size and forecast 2025-2030 ($ million)
Chart on Germany - Year-over-year growth 2025-2030 (%)
Data Table on Germany - Year-over-year growth 2025-2030 (%)

12.4.2 UK - Market size and forecast 2025-2030

Chart on UK - Market size and forecast 2025-2030 ($ million)
Data Table on UK - Market size and forecast 2025-2030 ($ million)
Chart on UK - Year-over-year growth 2025-2030 (%)
Data Table on UK - Year-over-year growth 2025-2030 (%)

12.4.3 France - Market size and forecast 2025-2030

Chart on France - Market size and forecast 2025-2030 ($ million)
Data Table on France - Market size and forecast 2025-2030 ($ million)
Chart on France - Year-over-year growth 2025-2030 (%)
Data Table on France - Year-over-year growth 2025-2030 (%)

12.4.4 Italy - Market size and forecast 2025-2030

Chart on Italy - Market size and forecast 2025-2030 ($ million)
Data Table on Italy - Market size and forecast 2025-2030 ($ million)
Chart on Italy - Year-over-year growth 2025-2030 (%)
Data Table on Italy - Year-over-year growth 2025-2030 (%)

12.4.5 Spain - Market size and forecast 2025-2030

Chart on Spain - Market size and forecast 2025-2030 ($ million)
Data Table on Spain - Market size and forecast 2025-2030 ($ million)
Chart on Spain - Year-over-year growth 2025-2030 (%)
Data Table on Spain - Year-over-year growth 2025-2030 (%)

12.4.6 The Netherlands - Market size and forecast 2025-2030

Chart on The Netherlands - Market size and forecast 2025-2030 ($ million)
Data Table on The Netherlands - Market size and forecast 2025-2030 ($ million)
Chart on The Netherlands - Year-over-year growth 2025-2030 (%)
Data Table on The Netherlands - Year-over-year growth 2025-2030 (%)

12.5 APAC - Market size and forecast 2025-2030

Chart on APAC - Market size and forecast 2025-2030 ($ million)
Data Table on APAC - Market size and forecast 2025-2030 ($ million)
Chart on APAC - Year-over-year growth 2025-2030 (%)
Data Table on APAC - Year-over-year growth 2025-2030 (%)
Chart on Regional Comparison - APAC
Data Table on Regional Comparison - APAC

12.5.1 China - Market size and forecast 2025-2030

Chart on China - Market size and forecast 2025-2030 ($ million)
Data Table on China - Market size and forecast 2025-2030 ($ million)
Chart on China - Year-over-year growth 2025-2030 (%)
Data Table on China - Year-over-year growth 2025-2030 (%)

12.5.2 Japan - Market size and forecast 2025-2030

Chart on Japan - Market size and forecast 2025-2030 ($ million)
Data Table on Japan - Market size and forecast 2025-2030 ($ million)
Chart on Japan - Year-over-year growth 2025-2030 (%)
Data Table on Japan - Year-over-year growth 2025-2030 (%)

12.5.3 India - Market size and forecast 2025-2030

Chart on India - Market size and forecast 2025-2030 ($ million)
Data Table on India - Market size and forecast 2025-2030 ($ million)
Chart on India - Year-over-year growth 2025-2030 (%)
Data Table on India - Year-over-year growth 2025-2030 (%)

12.5.4 South Korea - Market size and forecast 2025-2030

Chart on South Korea - Market size and forecast 2025-2030 ($ million)
Data Table on South Korea - Market size and forecast 2025-2030 ($ million)
Chart on South Korea - Year-over-year growth 2025-2030 (%)
Data Table on South Korea - Year-over-year growth 2025-2030 (%)

12.5.5 Australia - Market size and forecast 2025-2030

Chart on Australia - Market size and forecast 2025-2030 ($ million)
Data Table on Australia - Market size and forecast 2025-2030 ($ million)
Chart on Australia - Year-over-year growth 2025-2030 (%)
Data Table on Australia - Year-over-year growth 2025-2030 (%)

12.5.6 Indonesia - Market size and forecast 2025-2030

Chart on Indonesia - Market size and forecast 2025-2030 ($ million)
Data Table on Indonesia - Market size and forecast 2025-2030 ($ million)
Chart on Indonesia - Year-over-year growth 2025-2030 (%)
Data Table on Indonesia - Year-over-year growth 2025-2030 (%)

12.6 South America - Market size and forecast 2025-2030

Chart on South America - Market size and forecast 2025-2030 ($ million)
Data Table on South America - Market size and forecast 2025-2030 ($ million)
Chart on South America - Year-over-year growth 2025-2030 (%)
Data Table on South America - Year-over-year growth 2025-2030 (%)
Chart on Regional Comparison - South America
Data Table on Regional Comparison - South America

12.6.1 Brazil - Market size and forecast 2025-2030

Chart on Brazil - Market size and forecast 2025-2030 ($ million)
Data Table on Brazil - Market size and forecast 2025-2030 ($ million)
Chart on Brazil - Year-over-year growth 2025-2030 (%)
Data Table on Brazil - Year-over-year growth 2025-2030 (%)

12.6.2 Argentina - Market size and forecast 2025-2030

Chart on Argentina - Market size and forecast 2025-2030 ($ million)
Data Table on Argentina - Market size and forecast 2025-2030 ($ million)
Chart on Argentina - Year-over-year growth 2025-2030 (%)
Data Table on Argentina - Year-over-year growth 2025-2030 (%)

12.6.3 Chile - Market size and forecast 2025-2030

Chart on Chile - Market size and forecast 2025-2030 ($ million)
Data Table on Chile - Market size and forecast 2025-2030 ($ million)
Chart on Chile - Year-over-year growth 2025-2030 (%)
Data Table on Chile - Year-over-year growth 2025-2030 (%)

12.7 Middle East and Africa - Market size and forecast 2025-2030

Chart on Middle East and Africa - Market size and forecast 2025-2030 ($ million)
Data Table on Middle East and Africa - Market size and forecast 2025-2030 ($ million)
Chart on Middle East and Africa - Year-over-year growth 2025-2030 (%)
Data Table on Middle East and Africa - Year-over-year growth 2025-2030 (%)
Chart on Regional Comparison - Middle East and Africa
Data Table on Regional Comparison - Middle East and Africa

12.7.1 Saudi Arabia - Market size and forecast 2025-2030

Chart on Saudi Arabia - Market size and forecast 2025-2030 ($ million)
Data Table on Saudi Arabia - Market size and forecast 2025-2030 ($ million)
Chart on Saudi Arabia - Year-over-year growth 2025-2030 (%)
Data Table on Saudi Arabia - Year-over-year growth 2025-2030 (%)

12.7.2 UAE - Market size and forecast 2025-2030

Chart on UAE - Market size and forecast 2025-2030 ($ million)
Data Table on UAE - Market size and forecast 2025-2030 ($ million)
Chart on UAE - Year-over-year growth 2025-2030 (%)
Data Table on UAE - Year-over-year growth 2025-2030 (%)

12.7.3 South Africa - Market size and forecast 2025-2030

Chart on South Africa - Market size and forecast 2025-2030 ($ million)
Data Table on South Africa - Market size and forecast 2025-2030 ($ million)
Chart on South Africa - Year-over-year growth 2025-2030 (%)
Data Table on South Africa - Year-over-year growth 2025-2030 (%)

12.7.4 Israel - Market size and forecast 2025-2030

Chart on Israel - Market size and forecast 2025-2030 ($ million)
Data Table on Israel - Market size and forecast 2025-2030 ($ million)
Chart on Israel - Year-over-year growth 2025-2030 (%)
Data Table on Israel - Year-over-year growth 2025-2030 (%)

12.7.5 Turkey - Market size and forecast 2025-2030

Chart on Turkey - Market size and forecast 2025-2030 ($ million)
Data Table on Turkey - Market size and forecast 2025-2030 ($ million)
Chart on Turkey - Year-over-year growth 2025-2030 (%)
Data Table on Turkey - Year-over-year growth 2025-2030 (%)

12.8 Market opportunity by geography

Market opportunity by geography ($ million)
Data Tables on Market opportunity by geography ($ million)

13. Drivers, Challenges, and Opportunity

13.1 Market drivers

Decentralized point of care diagnostics demand
Expansion of precision medicine and genomics
Adoption of organ on chip models

13.2 Market challenges

Manufacturing complexity and integration constraints
Regulatory approval and compliance delays
Material compatibility and reagent stability

13.3 Impact of drivers and challenges

Impact of drivers and challenges in 2025 and 2030

13.4 Market opportunities

Rise of continuous wearable microfluidic biosensors
Adoption of microfluidic lipid nanoparticle synthesis
Implementation of microfluidic cell isolation workflows

14. Competitive Landscape

14.1 Overview

14.2

Overview on criticality of inputs and factors of differentiation

14.3 Landscape disruption

Overview on factors of disruption

14.4 Industry risks

Impact of key risks on business

15. Competitive Analysis

15.1 Companies profiled

Companies covered

15.2 Company ranking index

15.3 Market positioning of companies

Matrix on companies position and classification

15.4 10X Genomics Inc.

10X Genomics Inc. - Overview
10X Genomics Inc. - Product / Service
10X Genomics Inc. - Key offerings
SWOT

15.5 Agilent Technologies Inc.

Agilent Technologies Inc. - Overview
Agilent Technologies Inc. - Business segments
Agilent Technologies Inc. - Key news
Agilent Technologies Inc. - Key offerings
Agilent Technologies Inc. - Segment focus
SWOT

15.6 Becton Dickinson and Co.

Becton Dickinson and Co. - Overview
Becton Dickinson and Co. - Business segments
Becton Dickinson and Co. - Key news
Becton Dickinson and Co. - Key offerings
Becton Dickinson and Co. - Segment focus
SWOT

15.7 Bio Rad Laboratories Inc.

Bio Rad Laboratories Inc. - Overview
Bio Rad Laboratories Inc. - Business segments
Bio Rad Laboratories Inc. - Key news
Bio Rad Laboratories Inc. - Key offerings
Bio Rad Laboratories Inc. - Segment focus
SWOT

15.8 Elvesys SAS

Elvesys SAS - Overview
Elvesys SAS - Product / Service
Elvesys SAS - Key offerings
SWOT

15.9 Fluigent SA

Fluigent SA - Overview
Fluigent SA - Product / Service
Fluigent SA - Key offerings
SWOT

15.10 Illumina Inc.

Illumina Inc. - Overview
Illumina Inc. - Business segments
Illumina Inc. - Key news
Illumina Inc. - Key offerings
Illumina Inc. - Segment focus
SWOT

15.11 Microfluidic Chipshop GmbH

Microfluidic Chipshop GmbH - Overview
Microfluidic Chipshop GmbH - Product / Service
Microfluidic Chipshop GmbH - Key offerings
SWOT

15.12 MIMETAS BV

MIMETAS BV - Overview
MIMETAS BV - Product / Service
MIMETAS BV - Key offerings
SWOT

15.13 Parker Hannifin Corp.

Parker Hannifin Corp. - Overview
Parker Hannifin Corp. - Business segments
Parker Hannifin Corp. - Key news
Parker Hannifin Corp. - Key offerings
Parker Hannifin Corp. - Segment focus
SWOT

15.14 QIAGEN N.V.

QIAGEN N.V. - Overview
QIAGEN N.V. - Product / Service
QIAGEN N.V. - Key offerings
SWOT

15.15 Revvity Inc.

Revvity Inc. - Overview
Revvity Inc. - Business segments
Revvity Inc. - Key offerings
Revvity Inc. - Segment focus
SWOT

15.16 SMC Corp.

SMC Corp. - Overview
SMC Corp. - Product / Service
SMC Corp. - Key offerings
SWOT

15.17 Standard BioTools Inc.

Standard BioTools Inc. - Overview
Standard BioTools Inc. - Product / Service
Standard BioTools Inc. - Key offerings
SWOT

15.18 Thermo Fisher Scientific Inc.

Thermo Fisher Scientific Inc. - Overview
Thermo Fisher Scientific Inc. - Business segments
Thermo Fisher Scientific Inc. - Key news
Thermo Fisher Scientific Inc. - Key offerings
Thermo Fisher Scientific Inc. - Segment focus
SWOT

16. Appendix

16.1 Scope of the report

Market definition
Objectives
Notes and caveats

16.2 Inclusions and exclusions checklist

Inclusions checklist
Exclusions checklist

16.3 Currency conversion rates for US$

16.4 Research methodology

16.5 Data procurement

Information sources

16.6 Data validation

16.7 Validation techniques employed for market sizing

16.8 Data synthesis

16.9 360 degree market analysis

16.10 List of abbreviations

Research Methodology

Technavio presents a detailed picture of the market by way of study, synthesis, and summation of data from multiple sources. The analysts have presented the various facets of the market with a particular focus on identifying the key industry influencers. The data thus presented is comprehensive, reliable, and the result of extensive research, both primary and secondary.

INFORMATION SOURCES

Primary sources

  • Manufacturers and suppliers
  • Channel partners
  • Industry experts
  • Strategic decision makers

Secondary sources

  • Industry journals and periodicals
  • Government data
  • Financial reports of key industry players
  • Historical data
  • Press releases

DATA ANALYSIS

Data Synthesis

  • Collation of data
  • Estimation of key figures
  • Analysis of derived insights

Data Validation

  • Triangulation with data models
  • Reference against proprietary databases
  • Corroboration with industry experts

REPORT WRITING

Qualitative

  • Market drivers
  • Market challenges
  • Market trends
  • Five forces analysis

Quantitative

  • Market size and forecast
  • Market segmentation
  • Geographical insights
  • Competitive landscape

Interested in this report?

Get your sample now to see our research methodology and insights!

Download Now

Frequently Asked Questions

Microfluidics For Healthcare Application market growth will increase by USD 164083.1 million during 2026-2030.

The Microfluidics For Healthcare Application market is expected to grow at a CAGR of 27.1% during 2026-2030.

Microfluidics For Healthcare Application market is segmented by Application (In-vitro diagnostics, Pharmaceutical research, Drug delivery services) Material (Polymer-based, Glass-based, Silicon-based) Product type (Microfluidic-based devices, Microfluidic components)

10X Genomics Inc., Agilent Technologies Inc., Axxin Pty Ltd, Becton Dickinson and Co., Bio Rad Laboratories Inc., Elvesys SAS, Emulate Inc., Fluigent SA, Illumina Inc., Microfluidic Chipshop GmbH, Micronit BV, MIMETAS BV, Parker Hannifin Corp., QIAGEN N.V., Revvity Inc., SMC Corp., Sphere Fluidics Ltd., Standard BioTools Inc., Thermo Fisher Scientific Inc., uFluidix Inc. are a few of the key vendors in the Microfluidics For Healthcare Application market.

North America will register the highest growth rate of 43% among the other regions. Therefore, the Microfluidics For Healthcare Application market in North America is expected to garner significant business opportunities for the vendors during the forecast period.

US, Canada, Mexico, Germany, UK, France, Italy, Spain, The Netherlands, China, Japan, India, South Korea, Australia, Indonesia, Brazil, Argentina, Chile, Saudi Arabia, UAE, South Africa, Israel, Turkey

  • Decentralized point of care diagnostics demand is the driving factor this market.

The Microfluidics For Healthcare Application market vendors should focus on grabbing business opportunities from the Application segment as it accounted for the largest market share in the base year.
RIA - Research AI Assistant
Ask RIA
