Military Helicopter MRO Market Analysis, Size, and Forecast 2025-2029: North America (US, Canada, and Mexico), Europe (Germany, France, and UK), APAC (China, India, and Japan), South America (Brazil and Argentina), Middle East and Africa (Saudi Arabia, UAE, and Turkey), and Rest of World (ROW)

Military Helicopter MRO Market Analysis, Size, and Forecast 2025-2029:
North America (US, Canada, and Mexico), Europe (Germany, France, and UK), APAC (China, India, and Japan), South America (Brazil and Argentina), Middle East and Africa (Saudi Arabia, UAE, and Turkey), and Rest of World (ROW)

Published: Dec 2025 310 Pages SKU: IRTNTR73093

Market Overview at a Glance

$2.53 B
Market Opportunity
4.1%
CAGR 2024 - 2029
35.2%
Europe Growth
$5.81 B
Maintenance segment 2023

Military Helicopter MRO Market Size 2025-2029

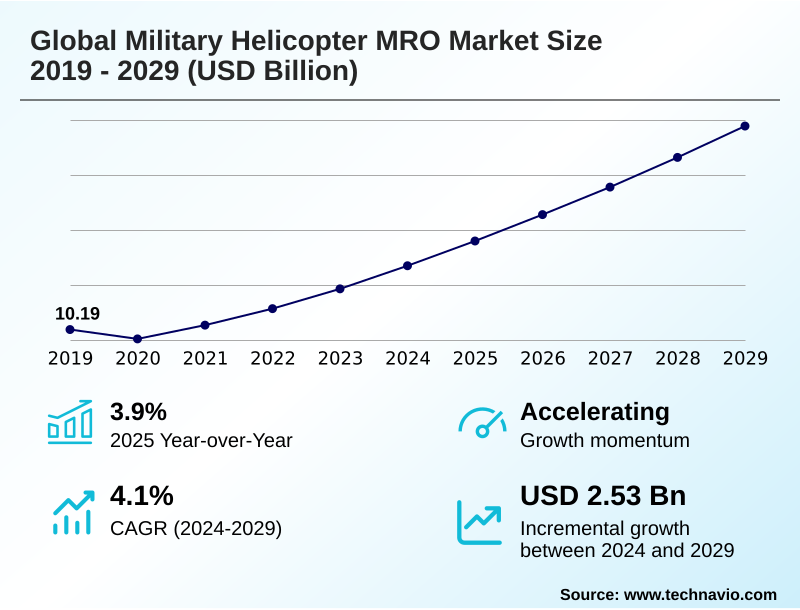
The military helicopter mro market size is valued to increase by USD 2.53 billion, at a CAGR of 4.1% from 2024 to 2029. Imperative of fleet modernization and service life extension will drive the military helicopter mro market.

Major Market Trends & Insights

  • Europe dominated the market and accounted for a 35.2% growth during the forecast period.
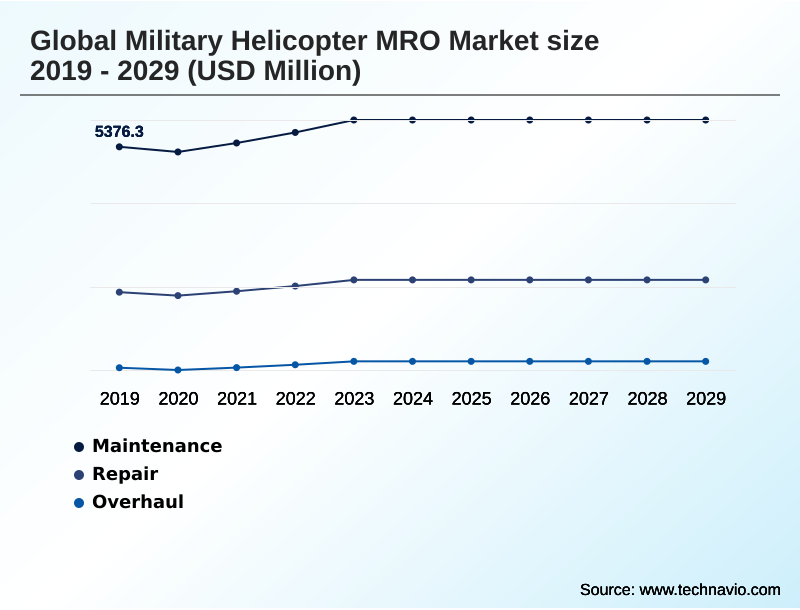
  • By Service - Maintenance segment was valued at USD 5.81 billion in 2023
  • By Type - Field maintenance segment accounted for the largest market revenue share in 2023

Market Size & Forecast

  • Market Opportunities: USD 3.69 billion
  • Market Future Opportunities: USD 2.53 billion
  • CAGR from 2024 to 2029 : 4.1%

Market Summary

What will be the Size of the Military Helicopter MRO Market during the forecast period?

Get Key Insights on Market Forecast (PDF) Request Free Sample

How is the Military Helicopter MRO Market Segmented?

The military helicopter mro industry research report provides comprehensive data (region-wise segment analysis), with forecasts and estimates in "USD million" for the period 2025-2029, as well as historical data from 2019-2023 for the following segments.

  • Service
    • Maintenance
    • Repair
    • Overhaul
  • Type
    • Field maintenance
    • Component depot maintenance
    • Airframe depot maintenance
    • Engine depot maintenance
  • Platform
    • Utility helicopter
    • Attack helicopters
    • Transport helicopters
    • Reconnaissance helicopters
    • Maritime helicopters
  • Geography
    • North America
      • US
      • Canada
      • Mexico
    • Europe
      • Germany
      • France
      • UK
    • APAC
      • China
      • India
      • Japan
    • South America
      • Brazil
      • Argentina
    • Middle East and Africa
      • Saudi Arabia
      • UAE
      • Turkey
    • Rest of World (ROW)

By Service Insights

The maintenance segment is estimated to witness significant growth during the forecast period.

Request Free Sample

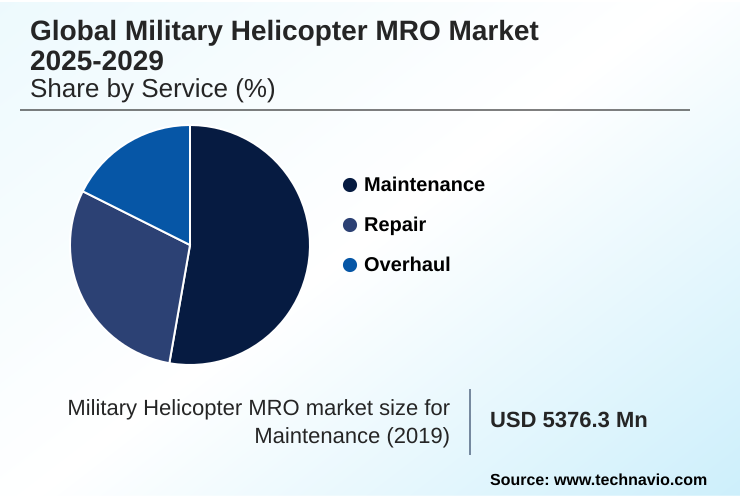
The Maintenance segment was valued at USD 5.81 billion in 2023 and showed a gradual increase during the forecast period.

Request Free Sample

Regional Analysis

Europe is estimated to contribute 35.2% to the growth of the global market during the forecast period.Technavio’s analysts have elaborately explained the regional trends and drivers that shape the market during the forecast period.

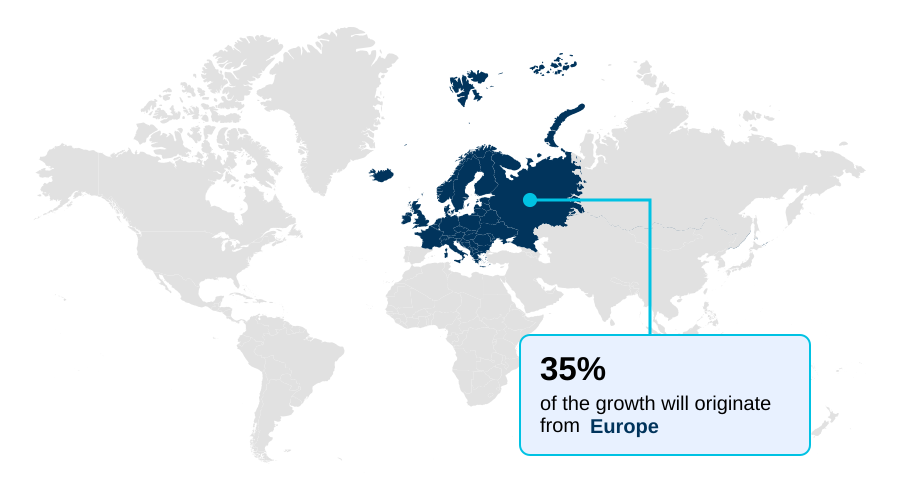
See How Military Helicopter MRO Market Demand is Rising in Europe Request Free Sample

Market Dynamics

Our researchers analyzed the data with 2024 as the base year, along with the key drivers, trends, and challenges. A holistic analysis of drivers will help companies refine their marketing strategies to gain a competitive advantage.

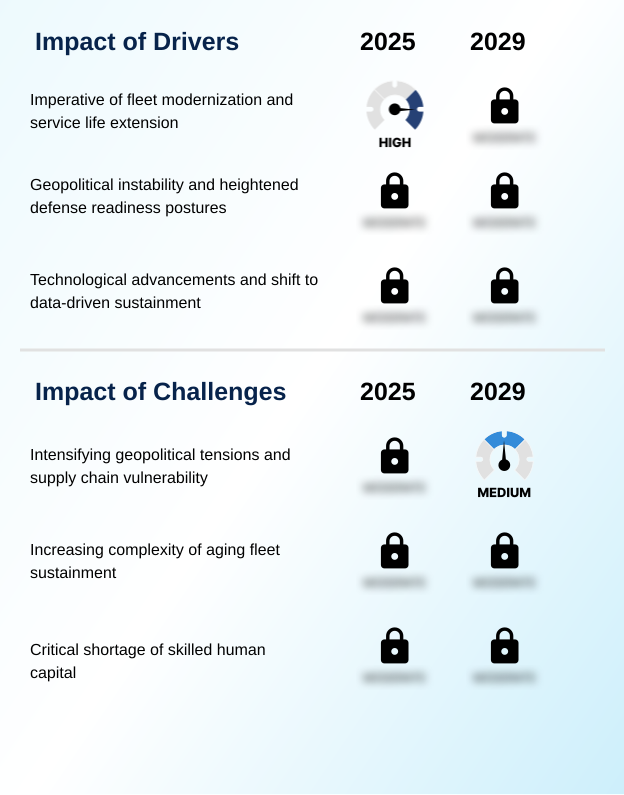
What are the key market drivers leading to the rise in the adoption of Military Helicopter MRO Industry?

What are the market trends shaping the Military Helicopter MRO Industry?

What challenges does the Military Helicopter MRO Industry face during its growth?

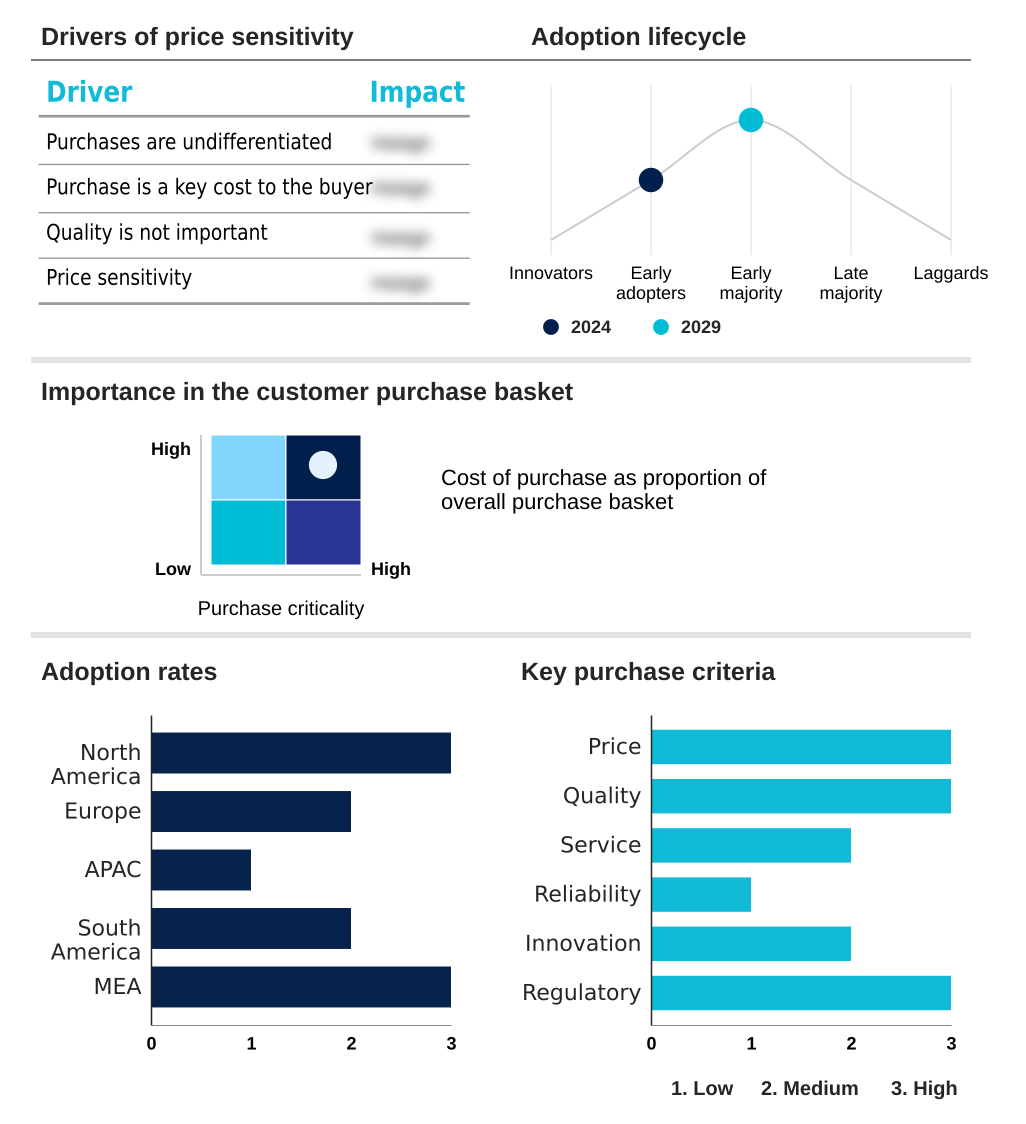
Exclusive Technavio Analysis on Customer Landscape

The military helicopter mro market forecasting report includes the adoption lifecycle of the market, covering from the innovator’s stage to the laggard’s stage. It focuses on adoption rates in different regions based on penetration. Furthermore, the military helicopter mro market report also includes key purchase criteria and drivers of price sensitivity to help companies evaluate and develop their market growth analysis strategies.

Customer Landscape of Military Helicopter MRO Industry

Competitive Landscape

Companies are implementing various strategies, such as strategic alliances, military helicopter mro market forecast, partnerships, mergers and acquisitions, geographical expansion, and product/service launches, to enhance their presence in the industry.

AAR Corp. -

The industry research and growth report includes detailed analyses of the competitive landscape of the market and information about key companies, including:

  • AAR Corp.
  • Airbus SE
  • AMETEK Inc.
  • CHC Group LLC
  • General Electric Co.
  • Hindustan Aeronautics Ltd.
  • L3Harris Technologies Inc.
  • Leonardo S.p.A.
  • Lockheed Martin Corp.
  • MTU Aero Engines AG
  • NHV Group
  • Patria Group
  • Rostec
  • RTX Corp.
  • Safran SA
  • Sika Interplant Systems Ltd.
  • StandardAero
  • TAIGLOBAL Group
  • Textron Inc.
  • The Boeing Co.

Qualitative and quantitative analysis of companies has been conducted to help clients understand the wider business environment as well as the strengths and weaknesses of key industry players. Data is qualitatively analyzed to categorize companies as pure play, category-focused, industry-focused, and diversified; it is quantitatively analyzed to categorize companies as dominant, leading, strong, tentative, and weak.

Recent Development and News in Military helicopter mro market

Dive into Technavio’s robust research methodology, blending expert interviews, extensive data synthesis, and validated models for unparalleled Military Helicopter MRO Market insights. See full methodology.

Market Scope
Page number 310
Base year 2024
Historic period 2019-2023
Forecast period 2025-2029
Growth momentum & CAGR Accelerate at a CAGR of 4.1%
Market growth 2025-2029 USD 2532.7 million
Market structure Fragmented
YoY growth 2024-2025(%) 3.9%
Key countries US, Canada, Mexico, Germany, France, UK, Italy, Russia, Spain, China, India, Japan, South Korea, Australia, Indonesia, Brazil, Argentina, Chile, Saudi Arabia, UAE, Turkey, South Africa and Egypt
Competitive landscape Leading Companies, Market Positioning of Companies, Competitive Strategies, and Industry Risks

Request Free Sample

Research Analyst Overview

What are the Key Data Covered in this Military Helicopter MRO Market Research and Growth Report?

  • What is the expected growth of the Military Helicopter MRO Market between 2025 and 2029?

    • USD 2.53 billion, at a CAGR of 4.1%

  • What segmentation does the market report cover?

    • The report is segmented by Service (Maintenance, Repair, and Overhaul), Type (Field maintenance, Component depot maintenance, Airframe depot maintenance, and Engine depot maintenance), Platform (Utility helicopter, Attack helicopters, Transport helicopters, Reconnaissance helicopters, and Maritime helicopters) and Geography (North America, Europe, APAC, South America, Middle East and Africa)

  • Which regions are analyzed in the report?

    • North America, Europe, APAC, South America and Middle East and Africa

  • What are the key growth drivers and market challenges?

    • Imperative of fleet modernization and service life extension, Intensifying geopolitical tensions and supply chain vulnerability

  • Who are the major players in the Military Helicopter MRO Market?

    • AAR Corp., Airbus SE, AMETEK Inc., CHC Group LLC, General Electric Co., Hindustan Aeronautics Ltd., L3Harris Technologies Inc., Leonardo S.p.A., Lockheed Martin Corp., MTU Aero Engines AG, NHV Group, Patria Group, Rostec, RTX Corp., Safran SA, Sika Interplant Systems Ltd., StandardAero, TAIGLOBAL Group, Textron Inc. and The Boeing Co.

Market Research Insights

We can help! Our analysts can customize this military helicopter mro market research report to meet your requirements.

Get in touch

1. Executive Summary

1.1 Market overview

Executive Summary - Chart on Market Overview
Executive Summary - Data Table on Market Overview
Executive Summary - Chart on Global Market Characteristics
Executive Summary - Chart on Market by Geography
Executive Summary - Chart on Market Segmentation by Service
Executive Summary - Chart on Market Segmentation by Type
Executive Summary - Chart on Market Segmentation by Platform
Executive Summary - Chart on Incremental Growth
Executive Summary - Data Table on Incremental Growth
Executive Summary - Chart on Company Market Positioning

2. Technavio Analysis

2.1 Analysis of price sensitivity, lifecycle, customer purchase basket, adoption rates, and purchase criteria

2.2 Criticality of inputs and Factors of differentiation

Chart on Overview on criticality of inputs and factors of differentiation

2.3 Factors of disruption

Chart on Overview on factors of disruption

2.4 Impact of drivers and challenges

Chart on Impact of drivers and challenges in 2024 and 2029

3. Market Landscape

3.1 Market ecosystem

Chart on Parent Market
Data Table on - Parent Market

3.2 Market characteristics

Chart on Market characteristics analysis

3.3 Value chain analysis

Chart on Value chain analysis

4. Market Sizing

4.1 Market definition

Data Table on Offerings of companies included in the market definition

4.2 Market segment analysis

Market segments

4.3 Market size 2024

4.4 Market outlook: Forecast for 2024-2029

Chart on Global - Market size and forecast 2024-2029 ($ million)
Data Table on Global - Market size and forecast 2024-2029 ($ million)
Chart on Global Market: Year-over-year growth 2024-2029 (%)
Data Table on Global Market: Year-over-year growth 2024-2029 (%)

5. Historic Market Size

5.1 Global Military Helicopter MRO Market 2019 - 2023

Historic Market Size - Data Table on Global Military Helicopter MRO Market 2019 - 2023 ($ million)

5.2 Service segment analysis 2019 - 2023

Historic Market Size - Service Segment 2019 - 2023 ($ million)

5.3 Type segment analysis 2019 - 2023

Historic Market Size - Type Segment 2019 - 2023 ($ million)

5.4 Platform segment analysis 2019 - 2023

Historic Market Size - Platform Segment 2019 - 2023 ($ million)

5.5 Geography segment analysis 2019 - 2023

Historic Market Size - Geography Segment 2019 - 2023 ($ million)

5.6 Country segment analysis 2019 - 2023

Historic Market Size - Country Segment 2019 - 2023 ($ million)

6. Qualitative Analysis

6.1 The Impact of AI in the Global Military Helicopter MRO Market

7. Five Forces Analysis

7.1 Five forces summary

Five forces analysis - Comparison between 2024 and 2029

7.2 Bargaining power of buyers

Bargaining power of buyers - Impact of key factors 2024 and 2029

7.3 Bargaining power of suppliers

Bargaining power of suppliers - Impact of key factors in 2024 and 2029

7.4 Threat of new entrants

Threat of new entrants - Impact of key factors in 2024 and 2029

7.5 Threat of substitutes

Threat of substitutes - Impact of key factors in 2024 and 2029

7.6 Threat of rivalry

Threat of rivalry - Impact of key factors in 2024 and 2029

7.7 Market condition

Chart on Market condition - Five forces 2024 and 2029

8. Market Segmentation by Service

8.1 Market segments

Chart on Service - Market share 2024-2029 (%)
Data Table on Service - Market share 2024-2029 (%)

8.2 Comparison by Service

Chart on Comparison by Service
Data Table on Comparison by Service

8.3 Maintenance - Market size and forecast 2024-2029

Chart on Maintenance - Market size and forecast 2024-2029 ($ million)
Data Table on Maintenance - Market size and forecast 2024-2029 ($ million)
Chart on Maintenance - Year-over-year growth 2024-2029 (%)
Data Table on Maintenance - Year-over-year growth 2024-2029 (%)

8.4 Repair - Market size and forecast 2024-2029

Chart on Repair - Market size and forecast 2024-2029 ($ million)
Data Table on Repair - Market size and forecast 2024-2029 ($ million)
Chart on Repair - Year-over-year growth 2024-2029 (%)
Data Table on Repair - Year-over-year growth 2024-2029 (%)

8.5 Overhaul - Market size and forecast 2024-2029

Chart on Overhaul - Market size and forecast 2024-2029 ($ million)
Data Table on Overhaul - Market size and forecast 2024-2029 ($ million)
Chart on Overhaul - Year-over-year growth 2024-2029 (%)
Data Table on Overhaul - Year-over-year growth 2024-2029 (%)

8.6 Market opportunity by Service

Market opportunity by Service ($ million)
Data Table on Market opportunity by Service ($ million)

9. Market Segmentation by Type

9.1 Market segments

Chart on Type - Market share 2024-2029 (%)
Data Table on Type - Market share 2024-2029 (%)

9.2 Comparison by Type

Chart on Comparison by Type
Data Table on Comparison by Type

9.3 Field maintenance - Market size and forecast 2024-2029

Chart on Field maintenance - Market size and forecast 2024-2029 ($ million)
Data Table on Field maintenance - Market size and forecast 2024-2029 ($ million)
Chart on Field maintenance - Year-over-year growth 2024-2029 (%)
Data Table on Field maintenance - Year-over-year growth 2024-2029 (%)

9.4 Component depot maintenance - Market size and forecast 2024-2029

Chart on Component depot maintenance - Market size and forecast 2024-2029 ($ million)
Data Table on Component depot maintenance - Market size and forecast 2024-2029 ($ million)
Chart on Component depot maintenance - Year-over-year growth 2024-2029 (%)
Data Table on Component depot maintenance - Year-over-year growth 2024-2029 (%)

9.5 Airframe depot maintenance - Market size and forecast 2024-2029

Chart on Airframe depot maintenance - Market size and forecast 2024-2029 ($ million)
Data Table on Airframe depot maintenance - Market size and forecast 2024-2029 ($ million)
Chart on Airframe depot maintenance - Year-over-year growth 2024-2029 (%)
Data Table on Airframe depot maintenance - Year-over-year growth 2024-2029 (%)

9.6 Engine depot maintenance - Market size and forecast 2024-2029

Chart on Engine depot maintenance - Market size and forecast 2024-2029 ($ million)
Data Table on Engine depot maintenance - Market size and forecast 2024-2029 ($ million)
Chart on Engine depot maintenance - Year-over-year growth 2024-2029 (%)
Data Table on Engine depot maintenance - Year-over-year growth 2024-2029 (%)

9.7 Market opportunity by Type

Market opportunity by Type ($ million)
Data Table on Market opportunity by Type ($ million)

10. Market Segmentation by Platform

10.1 Market segments

Chart on Platform - Market share 2024-2029 (%)
Data Table on Platform - Market share 2024-2029 (%)

10.2 Comparison by Platform

Chart on Comparison by Platform
Data Table on Comparison by Platform

10.3 Utility helicopter - Market size and forecast 2024-2029

Chart on Utility helicopter - Market size and forecast 2024-2029 ($ million)
Data Table on Utility helicopter - Market size and forecast 2024-2029 ($ million)
Chart on Utility helicopter - Year-over-year growth 2024-2029 (%)
Data Table on Utility helicopter - Year-over-year growth 2024-2029 (%)

10.4 Attack helicopters - Market size and forecast 2024-2029

Chart on Attack helicopters - Market size and forecast 2024-2029 ($ million)
Data Table on Attack helicopters - Market size and forecast 2024-2029 ($ million)
Chart on Attack helicopters - Year-over-year growth 2024-2029 (%)
Data Table on Attack helicopters - Year-over-year growth 2024-2029 (%)

10.5 Transport helicopters - Market size and forecast 2024-2029

Chart on Transport helicopters - Market size and forecast 2024-2029 ($ million)
Data Table on Transport helicopters - Market size and forecast 2024-2029 ($ million)
Chart on Transport helicopters - Year-over-year growth 2024-2029 (%)
Data Table on Transport helicopters - Year-over-year growth 2024-2029 (%)

10.6 Reconnaissance helicopters - Market size and forecast 2024-2029

Chart on Reconnaissance helicopters - Market size and forecast 2024-2029 ($ million)
Data Table on Reconnaissance helicopters - Market size and forecast 2024-2029 ($ million)
Chart on Reconnaissance helicopters - Year-over-year growth 2024-2029 (%)
Data Table on Reconnaissance helicopters - Year-over-year growth 2024-2029 (%)

10.7 Maritime helicopters - Market size and forecast 2024-2029

Chart on Maritime helicopters - Market size and forecast 2024-2029 ($ million)
Data Table on Maritime helicopters - Market size and forecast 2024-2029 ($ million)
Chart on Maritime helicopters - Year-over-year growth 2024-2029 (%)
Data Table on Maritime helicopters - Year-over-year growth 2024-2029 (%)

10.8 Market opportunity by Platform

Market opportunity by Platform ($ million)
Data Table on Market opportunity by Platform ($ million)

11. Customer Landscape

11.1 Customer landscape overview

Analysis of price sensitivity, lifecycle, customer purchase basket, adoption rates, and purchase criteria

12. Geographic Landscape

12.1 Geographic segmentation

Chart on Market share by geography 2024-2029 (%)
Data Table on Market share by geography 2024-2029 (%)

12.2 Geographic comparison

Chart on Geographic comparison
Data Table on Geographic comparison

12.3 North America - Market size and forecast 2024-2029

Chart on North America - Market size and forecast 2024-2029 ($ million)
Data Table on North America - Market size and forecast 2024-2029 ($ million)
Chart on North America - Year-over-year growth 2024-2029 (%)
Data Table on North America - Year-over-year growth 2024-2029 (%)
Chart on Regional Comparison - North America
Data Table on Regional Comparison - North America

12.3.1 US - Market size and forecast 2024-2029

Chart on US - Market size and forecast 2024-2029 ($ million)
Data Table on US - Market size and forecast 2024-2029 ($ million)
Chart on US - Year-over-year growth 2024-2029 (%)
Data Table on US - Year-over-year growth 2024-2029 (%)

12.3.2 Canada - Market size and forecast 2024-2029

Chart on Canada - Market size and forecast 2024-2029 ($ million)
Data Table on Canada - Market size and forecast 2024-2029 ($ million)
Chart on Canada - Year-over-year growth 2024-2029 (%)
Data Table on Canada - Year-over-year growth 2024-2029 (%)

12.3.3 Mexico - Market size and forecast 2024-2029

Chart on Mexico - Market size and forecast 2024-2029 ($ million)
Data Table on Mexico - Market size and forecast 2024-2029 ($ million)
Chart on Mexico - Year-over-year growth 2024-2029 (%)
Data Table on Mexico - Year-over-year growth 2024-2029 (%)

12.4 Europe - Market size and forecast 2024-2029

Chart on Europe - Market size and forecast 2024-2029 ($ million)
Data Table on Europe - Market size and forecast 2024-2029 ($ million)
Chart on Europe - Year-over-year growth 2024-2029 (%)
Data Table on Europe - Year-over-year growth 2024-2029 (%)
Chart on Regional Comparison - Europe
Data Table on Regional Comparison - Europe

12.4.1 Germany - Market size and forecast 2024-2029

Chart on Germany - Market size and forecast 2024-2029 ($ million)
Data Table on Germany - Market size and forecast 2024-2029 ($ million)
Chart on Germany - Year-over-year growth 2024-2029 (%)
Data Table on Germany - Year-over-year growth 2024-2029 (%)

12.4.2 France - Market size and forecast 2024-2029

Chart on France - Market size and forecast 2024-2029 ($ million)
Data Table on France - Market size and forecast 2024-2029 ($ million)
Chart on France - Year-over-year growth 2024-2029 (%)
Data Table on France - Year-over-year growth 2024-2029 (%)

12.4.3 UK - Market size and forecast 2024-2029

Chart on UK - Market size and forecast 2024-2029 ($ million)
Data Table on UK - Market size and forecast 2024-2029 ($ million)
Chart on UK - Year-over-year growth 2024-2029 (%)
Data Table on UK - Year-over-year growth 2024-2029 (%)

12.4.4 Italy - Market size and forecast 2024-2029

Chart on Italy - Market size and forecast 2024-2029 ($ million)
Data Table on Italy - Market size and forecast 2024-2029 ($ million)
Chart on Italy - Year-over-year growth 2024-2029 (%)
Data Table on Italy - Year-over-year growth 2024-2029 (%)

12.4.5 Russia - Market size and forecast 2024-2029

Chart on Russia - Market size and forecast 2024-2029 ($ million)
Data Table on Russia - Market size and forecast 2024-2029 ($ million)
Chart on Russia - Year-over-year growth 2024-2029 (%)
Data Table on Russia - Year-over-year growth 2024-2029 (%)

12.4.6 Spain - Market size and forecast 2024-2029

Chart on Spain - Market size and forecast 2024-2029 ($ million)
Data Table on Spain - Market size and forecast 2024-2029 ($ million)
Chart on Spain - Year-over-year growth 2024-2029 (%)
Data Table on Spain - Year-over-year growth 2024-2029 (%)

12.5 APAC - Market size and forecast 2024-2029

Chart on APAC - Market size and forecast 2024-2029 ($ million)
Data Table on APAC - Market size and forecast 2024-2029 ($ million)
Chart on APAC - Year-over-year growth 2024-2029 (%)
Data Table on APAC - Year-over-year growth 2024-2029 (%)
Chart on Regional Comparison - APAC
Data Table on Regional Comparison - APAC

12.5.1 China - Market size and forecast 2024-2029

Chart on China - Market size and forecast 2024-2029 ($ million)
Data Table on China - Market size and forecast 2024-2029 ($ million)
Chart on China - Year-over-year growth 2024-2029 (%)
Data Table on China - Year-over-year growth 2024-2029 (%)

12.5.2 India - Market size and forecast 2024-2029

Chart on India - Market size and forecast 2024-2029 ($ million)
Data Table on India - Market size and forecast 2024-2029 ($ million)
Chart on India - Year-over-year growth 2024-2029 (%)
Data Table on India - Year-over-year growth 2024-2029 (%)

12.5.3 Japan - Market size and forecast 2024-2029

Chart on Japan - Market size and forecast 2024-2029 ($ million)
Data Table on Japan - Market size and forecast 2024-2029 ($ million)
Chart on Japan - Year-over-year growth 2024-2029 (%)
Data Table on Japan - Year-over-year growth 2024-2029 (%)

12.5.4 South Korea - Market size and forecast 2024-2029

Chart on South Korea - Market size and forecast 2024-2029 ($ million)
Data Table on South Korea - Market size and forecast 2024-2029 ($ million)
Chart on South Korea - Year-over-year growth 2024-2029 (%)
Data Table on South Korea - Year-over-year growth 2024-2029 (%)

12.5.5 Australia - Market size and forecast 2024-2029

Chart on Australia - Market size and forecast 2024-2029 ($ million)
Data Table on Australia - Market size and forecast 2024-2029 ($ million)
Chart on Australia - Year-over-year growth 2024-2029 (%)
Data Table on Australia - Year-over-year growth 2024-2029 (%)

12.5.6 Indonesia - Market size and forecast 2024-2029

Chart on Indonesia - Market size and forecast 2024-2029 ($ million)
Data Table on Indonesia - Market size and forecast 2024-2029 ($ million)
Chart on Indonesia - Year-over-year growth 2024-2029 (%)
Data Table on Indonesia - Year-over-year growth 2024-2029 (%)

12.6 South America - Market size and forecast 2024-2029

Chart on South America - Market size and forecast 2024-2029 ($ million)
Data Table on South America - Market size and forecast 2024-2029 ($ million)
Chart on South America - Year-over-year growth 2024-2029 (%)
Data Table on South America - Year-over-year growth 2024-2029 (%)
Chart on Regional Comparison - South America
Data Table on Regional Comparison - South America

12.6.1 Brazil - Market size and forecast 2024-2029

Chart on Brazil - Market size and forecast 2024-2029 ($ million)
Data Table on Brazil - Market size and forecast 2024-2029 ($ million)
Chart on Brazil - Year-over-year growth 2024-2029 (%)
Data Table on Brazil - Year-over-year growth 2024-2029 (%)

12.6.2 Argentina - Market size and forecast 2024-2029

Chart on Argentina - Market size and forecast 2024-2029 ($ million)
Data Table on Argentina - Market size and forecast 2024-2029 ($ million)
Chart on Argentina - Year-over-year growth 2024-2029 (%)
Data Table on Argentina - Year-over-year growth 2024-2029 (%)

12.6.3 Chile - Market size and forecast 2024-2029

Chart on Chile - Market size and forecast 2024-2029 ($ million)
Data Table on Chile - Market size and forecast 2024-2029 ($ million)
Chart on Chile - Year-over-year growth 2024-2029 (%)
Data Table on Chile - Year-over-year growth 2024-2029 (%)

12.7 Middle East and Africa - Market size and forecast 2024-2029

Chart on Middle East and Africa - Market size and forecast 2024-2029 ($ million)
Data Table on Middle East and Africa - Market size and forecast 2024-2029 ($ million)
Chart on Middle East and Africa - Year-over-year growth 2024-2029 (%)
Data Table on Middle East and Africa - Year-over-year growth 2024-2029 (%)
Chart on Regional Comparison - Middle East and Africa
Data Table on Regional Comparison - Middle East and Africa

12.7.1 Saudi Arabia - Market size and forecast 2024-2029

Chart on Saudi Arabia - Market size and forecast 2024-2029 ($ million)
Data Table on Saudi Arabia - Market size and forecast 2024-2029 ($ million)
Chart on Saudi Arabia - Year-over-year growth 2024-2029 (%)
Data Table on Saudi Arabia - Year-over-year growth 2024-2029 (%)

12.7.2 UAE - Market size and forecast 2024-2029

Chart on UAE - Market size and forecast 2024-2029 ($ million)
Data Table on UAE - Market size and forecast 2024-2029 ($ million)
Chart on UAE - Year-over-year growth 2024-2029 (%)
Data Table on UAE - Year-over-year growth 2024-2029 (%)

12.7.3 Turkey - Market size and forecast 2024-2029

Chart on Turkey - Market size and forecast 2024-2029 ($ million)
Data Table on Turkey - Market size and forecast 2024-2029 ($ million)
Chart on Turkey - Year-over-year growth 2024-2029 (%)
Data Table on Turkey - Year-over-year growth 2024-2029 (%)

12.7.4 South Africa - Market size and forecast 2024-2029

Chart on South Africa - Market size and forecast 2024-2029 ($ million)
Data Table on South Africa - Market size and forecast 2024-2029 ($ million)
Chart on South Africa - Year-over-year growth 2024-2029 (%)
Data Table on South Africa - Year-over-year growth 2024-2029 (%)

12.7.5 Egypt - Market size and forecast 2024-2029

Chart on Egypt - Market size and forecast 2024-2029 ($ million)
Data Table on Egypt - Market size and forecast 2024-2029 ($ million)
Chart on Egypt - Year-over-year growth 2024-2029 (%)
Data Table on Egypt - Year-over-year growth 2024-2029 (%)

12.8 Market opportunity by geography

Market opportunity by geography ($ million)
Data Tables on Market opportunity by geography ($ million)

13. Drivers, Challenges, and Opportunity

13.1 Market drivers

Imperative of fleet modernization and service life extension
Geopolitical instability and heightened defense readiness postures
Technological advancements and shift to data-driven sustainment

13.2 Market challenges

Intensifying geopolitical tensions and supply chain vulnerability
Increasing complexity of aging fleet sustainment
Critical shortage of skilled human capital

13.3 Impact of drivers and challenges

Impact of drivers and challenges in 2024 and 2029

13.4 Market opportunities

Proliferation of PBL and integrated contracts
Strategic push for sovereign MRO capabilities and supply chain resilience
Digital transformation and integration of advanced analytics

14. Competitive Landscape

14.1 Overview

14.2

Overview on criticality of inputs and factors of differentiation

14.3 Landscape disruption

Overview on factors of disruption

14.4 Industry risks

Impact of key risks on business

15. Competitive Analysis

15.1 Companies profiled

Companies covered

15.2 Company ranking index

15.3 Market positioning of companies

Matrix on companies position and classification

15.4 AAR Corp.

AAR Corp. - Overview
AAR Corp. - Business segments
AAR Corp. - Key news
AAR Corp. - Key offerings
AAR Corp. - Segment focus
SWOT

15.5 Airbus SE

Airbus SE - Overview
Airbus SE - Business segments
Airbus SE - Key news
Airbus SE - Key offerings
Airbus SE - Segment focus
SWOT

15.6 AMETEK Inc.

AMETEK Inc. - Overview
AMETEK Inc. - Product / Service
AMETEK Inc. - Key news
AMETEK Inc. - Key offerings
SWOT

15.7 CHC Group LLC

CHC Group LLC - Overview
CHC Group LLC - Product / Service
CHC Group LLC - Key offerings
SWOT

15.8 General Electric Co.

General Electric Co. - Overview
General Electric Co. - Business segments
General Electric Co. - Key news
General Electric Co. - Key offerings
General Electric Co. - Segment focus
SWOT

15.9 Hindustan Aeronautics Ltd.

Hindustan Aeronautics Ltd. - Overview
Hindustan Aeronautics Ltd. - Product / Service
Hindustan Aeronautics Ltd. - Key offerings
SWOT

15.10 L3Harris Technologies Inc.

L3Harris Technologies Inc. - Overview
L3Harris Technologies Inc. - Business segments
L3Harris Technologies Inc. - Key news
L3Harris Technologies Inc. - Key offerings
L3Harris Technologies Inc. - Segment focus
SWOT

15.11 Leonardo S.p.A.

Leonardo S.p.A. - Overview
Leonardo S.p.A. - Business segments
Leonardo S.p.A. - Key offerings
Leonardo S.p.A. - Segment focus
SWOT

15.12 Lockheed Martin Corp.

Lockheed Martin Corp. - Overview
Lockheed Martin Corp. - Business segments
Lockheed Martin Corp. - Key news
Lockheed Martin Corp. - Key offerings
Lockheed Martin Corp. - Segment focus
SWOT

15.13 MTU Aero Engines AG

MTU Aero Engines AG - Overview
MTU Aero Engines AG - Business segments
MTU Aero Engines AG - Key offerings
MTU Aero Engines AG - Segment focus
SWOT

15.14 Sika Interplant Systems Ltd.

Sika Interplant Systems Ltd. - Overview
Sika Interplant Systems Ltd. - Product / Service
Sika Interplant Systems Ltd. - Key offerings
SWOT

15.15 StandardAero

StandardAero - Overview
StandardAero - Product / Service
StandardAero - Key offerings
SWOT

15.16 TAIGLOBAL Group

TAIGLOBAL Group - Overview
TAIGLOBAL Group - Product / Service
TAIGLOBAL Group - Key offerings
SWOT

15.17 Textron Inc.

Textron Inc. - Overview
Textron Inc. - Business segments
Textron Inc. - Key offerings
Textron Inc. - Segment focus
SWOT

15.18 The Boeing Co.

The Boeing Co. - Overview
The Boeing Co. - Business segments
The Boeing Co. - Key news
The Boeing Co. - Key offerings
The Boeing Co. - Segment focus
SWOT

16. Appendix

16.1 Scope of the report

Market definition
Objectives
Notes and caveats

16.2 Inclusions and exclusions checklist

Inclusions checklist
Exclusions checklist

16.3 Currency conversion rates for US$

16.4 Research methodology

16.5 Data procurement

Information sources

16.6 Data validation

16.7 Validation techniques employed for market sizing

16.8 Data synthesis

16.9 360 degree market analysis

16.10 List of abbreviations

Research Methodology

Technavio presents a detailed picture of the market by way of study, synthesis, and summation of data from multiple sources. The analysts have presented the various facets of the market with a particular focus on identifying the key industry influencers. The data thus presented is comprehensive, reliable, and the result of extensive research, both primary and secondary.

INFORMATION SOURCES

Primary sources

  • Manufacturers and suppliers
  • Channel partners
  • Industry experts
  • Strategic decision makers

Secondary sources

  • Industry journals and periodicals
  • Government data
  • Financial reports of key industry players
  • Historical data
  • Press releases

DATA ANALYSIS

Data Synthesis

  • Collation of data
  • Estimation of key figures
  • Analysis of derived insights

Data Validation

  • Triangulation with data models
  • Reference against proprietary databases
  • Corroboration with industry experts

REPORT WRITING

Qualitative

  • Market drivers
  • Market challenges
  • Market trends
  • Five forces analysis

Quantitative

  • Market size and forecast
  • Market segmentation
  • Geographical insights
  • Competitive landscape

Interested in this report?

Get your sample now to see our research methodology and insights!

Download Now

Frequently Asked Questions

Military Helicopter MRO market growth will increase by USD 2532.7 million during 2025-2029.

The Military Helicopter MRO market is expected to grow at a CAGR of 4.1% during 2025-2029.

Military Helicopter MRO market is segmented by Service (Maintenance, Repair, Overhaul) Type (Field maintenance, Component depot maintenance, Airframe depot maintenance, Engine depot maintenance) Platform (Utility helicopter, Attack helicopters, Transport helicopters, Reconnaissance helicopters, Maritime helicopters)

AAR Corp., Airbus SE, AMETEK Inc., CHC Group LLC, General Electric Co., Hindustan Aeronautics Ltd., L3Harris Technologies Inc., Leonardo S.p.A., Lockheed Martin Corp., MTU Aero Engines AG, NHV Group, Patria Group, Rostec, RTX Corp., Safran SA, Sika Interplant Systems Ltd., StandardAero, TAIGLOBAL Group, Textron Inc., The Boeing Co. are a few of the key vendors in the Military Helicopter MRO market.

Europe will register the highest growth rate of 35.2% among the other regions. Therefore, the Military Helicopter MRO market in Europe is expected to garner significant business opportunities for the vendors during the forecast period.

US, Canada, Mexico, Germany, France, UK, Italy, Russia, Spain, China, India, Japan, South Korea, Australia, Indonesia, Brazil, Argentina, Chile, Saudi Arabia, UAE, Turkey, South Africa, Egypt

  • Imperative of fleet modernization and service life extension is the driving factor this market.

The Military Helicopter MRO market vendors should focus on grabbing business opportunities from the Service segment as it accounted for the largest market share in the base year.