Japan - Multifactor Authentication Market Research Report, Size , Growth, Trends, Opportunity Analysis, Industry Forecast - 2024-2028

Japan - Multifactor Authentication Market Research Report, Size , Growth, Trends, Opportunity Analysis, Industry Forecast - 2024-2028

Published: Jan 2024 141 Pages SKU: IRTNTR77302

Market Overview at a Glance

$1.09 B
Market Opportunity
24.39%
CAGR
23.02
YoY growth 2023-2024(%)

Japan - Multifactor Authentication Market 2024-2028

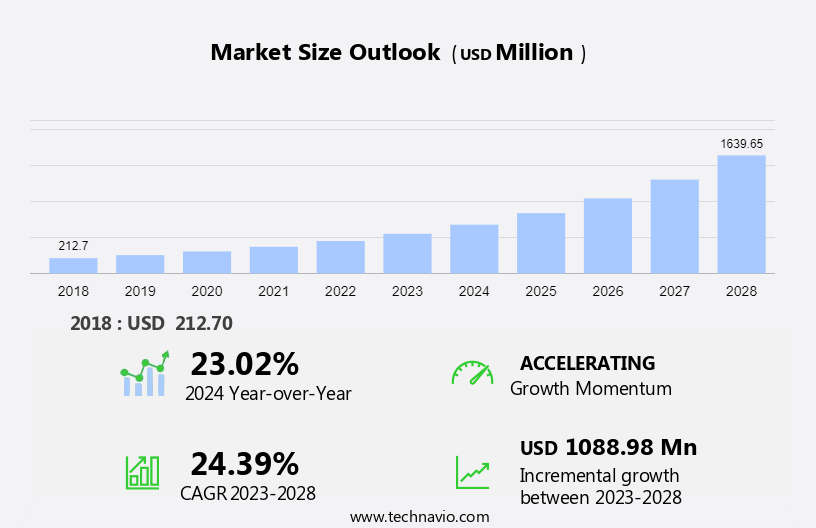
Japan - multifactor authentication market size is projected to increase by USD 1,088.98 million, at a CAGR of 24.39% between 2023 and 2028. The growth rate of the market depends on several factors, including the emergence of cloud-based multifactor authentication solutions and services, the stringent government regulations to increase the adoption of multifactor authentication, and the increase in the volume of online transactions. Multifactor authentication solutions and services comprise biometrics and phone-based authentication solutions, making them the most secure authentication solutions in the market. Multifactor authentication is a security process that validates the user multiple times before allowing access to the data. It ensures that no security breach would affect the confidentiality of the data.

The report includes a comprehensive outlook on the market, offering forecasts for the industry segmented by Component, which comprises service and product. Additionally, it categorizes Deployment into on premises and cloud, and covers Type, including password-based authentication and password-less authentication. The report provides market size, historical data spanning from 2018 to 2022, and future projections, all presented in terms of value in USD billion for each of the mentioned segments.

What will be the Size of the Market During the Forecast Period?

Multifactor Authentication Market in Japan Size

For More Highlights About this Report, Download Free Sample in a Minute 

Market Overview

Market Growth Analysis Driver

The emergence of cloud-based multifactor authentication solutions and services is the key factor driving market growth. The rise in maintenance costs for hardware and software-based two-factor and three-factor authentication models has aroused the interest of many companies in the adoption of cloud-based multifactor authentication solutions and services. Market players are integrating multifactor authentication techniques with the cloud due to the growing demand for cloud-based multifactor authentication. Companies prefer cloud-based multifactor authentication because of its benefits, such as easy installation and upgrading, pay-as-you-go, zero maintenance costs, less dependency on internal IT personnel, and improved reliability and scalability.

Additionally, the adoption of the cloud is rapidly increasing among industries, giving rise to many security challenges for cloud service providers and other ecosystem vendors, especially in dealing with the complexity of privacy and data protection regulations. The demand for multifactor authentication for securing the data and information in the cloud environment is likely to provide huge opportunities to multifactor authentication solution providers and cloud service providers, which will drive the growth of the market during the forecast period.

Market Growth and Trends

Growing adoption of BYOD among enterprises is the primary trend shaping market growth. The growing BYOD movement continues to draw authentication concerns for enterprise security. Organizations are figuring out ways to seal the cracks between employee authentication and enterprise security. For easy onboarding, firms can implement multifactor authentication to manage employee access on enterprise applications.

Moreover, aligning with market trends and analysis, in the context of providing high security, secure authentication and authorization of a user is crucial to protecting the user's personal information. It involves the security of the whole infrastructure. Thus, the growing adoption of the BYOD concept acts as a driving factor for the growth of the market during the forecast period.

Market Restrain

Inconvenience of bearing hardware tokens and vulnerability to threats is a challenge that affects market growth. Hardware tokens are susceptible to theft and might not be recognized by the systems in use. The hardware OTP token is an additional device that must always be carried around, making it inconvenient for users. These devices can be easily forgotten by end-users. The storage capacity of hardware tokens is very low (a few kilobytes).

In addition, these devices are sensitive to high temperatures, physical damage, and dust. There is a potential for permanent corruption in hardware devices, and reformatting is almost impossible. Hardware devices are also vulnerable to man-in-the-middle attacks. These disadvantages and the short life span make hardware tokens a less popular option for end-users, which may impede market growth during the forecast period.

Market Segmentation By Mention Segment

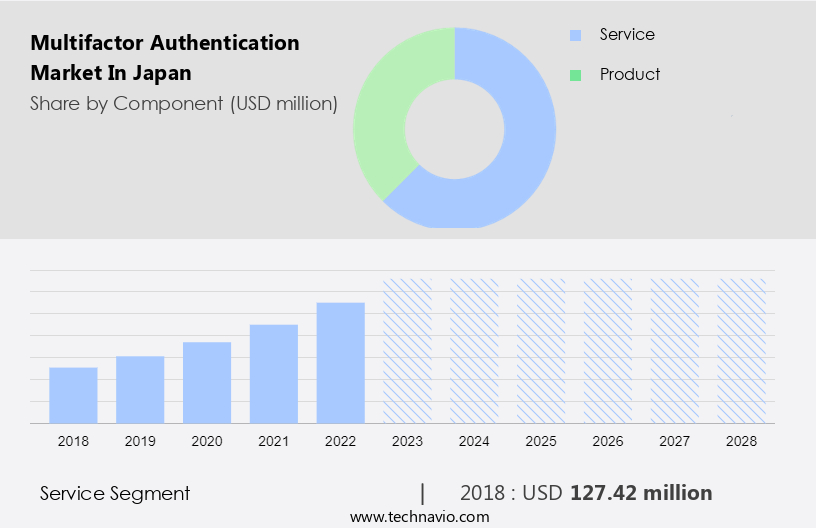
The market share growth by the service segment will be significant during the forecast period. Increased flexibility in enterprises has enabled employees to work from home or outside the office. In such cases, verification of the remote access user is crucial. So, enterprises are adopting safe and secure authentication services that allow only an authorized person to access their information. Multifactor authentication solutions and services are gaining prominence in organizations for restricting people from gaining unauthorized access to critical data and tampering with critical information. People are granted access after their identity is confirmed with the information stored in the database.

Multifactor Authentication Market in Japan Size

Get a glance at the market contribution of various segments Download the PDF Sample

The service segment showed a gradual increase in the market share of USD 127.42 million in 2018. The major factors expected to drive the Japan - multifactor authentication market are increased data breaches, cyber-attacks, and the growing adoption of BYOD among enterprises. The introduction of cloud-based multifactor authentication technology has reduced the maintenance costs associated with hardware and software-based authentication. Furthermore, multifactor authentication enables secured access control, tracks fraudulent activities, and facilitates authentication of online transactions. The banking sector witnessed the highest adoption of multifactor authentication solutions and services, which enabled secure transactions and reduced data loss and fraudulent activities. Thus, such factors will drive the growth of the services segment of the multifactor authentication market in Japan during the forecast period.

Market Segmentation By Deployment

On-premises multifactor authentication is installed and runs on systems on the premises of the organization utilizing the product rather than at a remote facility such as a cloud or a server farm. The multifactor authentication software is made up of databases and modules that work together to specifically meet the special requirements of large businesses with regard to the automation of corporate-wide business systems and their functions. Additionally, on-premises multifactor authentication solutions and services offer a high level of confidence to end-users in the security of servers. The adoption of on-premises multifactor authentication is expected to maintain steady growth of the on-premises segment of the market during the forecast period.

Market Customer Landscape

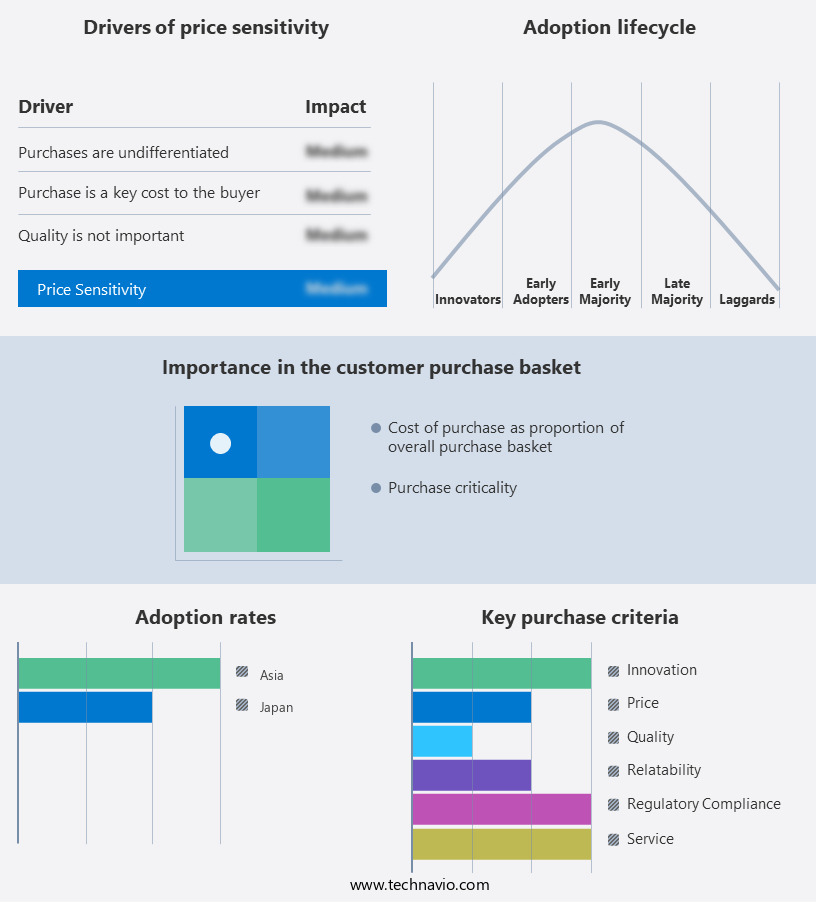
The market forecasting report includes the adoption lifecycle of the market research and growth, covering from the innovator’s stage to the laggard’s stage. It focuses on adoption rates in different regions based on penetration. Furthermore, the report also includes key purchase criteria and drivers of price sensitivity to help companies evaluate and develop their market growth and trends strategies.

Multifactor Authentication Market in Japan Share by Geography

Market Customer Landscape

Who are the Major Market Companies?

Companies are implementing various strategies, such as strategic alliances, partnerships, mergers and acquisitions, geographical expansion, and product/service launches, to enhance their presence in the market.

  • Akamai Technologies Inc.: The company offers multifactor authentication services through their platform Akamai MFA that provides FIDO2 MFA security, IdP integration, automatic provisioning, event report, self-service user registration and multiple authentication factors like secure push, standard push, TOTP, SMS, and more.
  • Amazon.com Inc.: The company offers multifactor authentication services such as AWS multi-factor authentication that requires a second authentication factor in addition to user name and password sign-in credentials.
  • Cisco Systems Inc.: The company offers multifactor authentication services through its subsidiary Duo Security that provides powerful authentication methods such as biometrics, tokens, passcodes, the Duo Push mobile app, and more.

The  market  growth and forecasting report also includes detailed analyses of the competitive landscape of the market and information about 14 market companies, including:

  • Entrust Corp.
  • Fujitsu Ltd.
  • International Business Machines Corp.
  • Kyndryl Inc.
  • Microsoft Corp.
  • NEC Corp.
  • Okta Inc.
  • Ping Identity Corp.
  • Quest Software Inc.
  • Salesforce Inc.
  • Thales Group

The market analysis and report of qualitative and quantitative analysis of companies has been conducted to help clients understand the wider business environment as well as the strengths and weaknesses of key market players. Data is qualitatively analyzed to categorize companies as pure play, category-focused, industry-focused, and diversified; it is quantitatively analyzed to categorize companies as dominant, leading, strong, tentative, and weak.

Segment Overview

The market research report forecasts market growth by revenue and provides an analysis of the latest trends and growth opportunities from 2018-2028

  • Component Outlook
    • Service
    • Product
  • Deployment Outlook
    • On premises
    • Cloud

Japan Multifactor Authentication Market Scope

Report Coverage

Details

Page number

141

Base year

2023

Historic period

2018-2022

Forecast period

2024-2028

Growth momentum & CAGR

Accelerate at a CAGR of 24.39%

Market Growth 2024-2028

USD 1,088.98 million

Market structure

Concentrated

YoY growth 2023-2024(%)

23.02

Competitive landscape

Leading Companies, Market Positioning of Companies, Competitive Strategies, and Industry Risks

Key companies profiled

Akamai Technologies Inc., Amazon.com Inc., Cisco Systems Inc., Entrust Corp., Fujitsu Ltd., International Business Machines Corp., Kyndryl Inc., Microsoft Corp., NEC Corp., Okta Inc., Ping Identity Corp., Quest Software Inc., Salesforce Inc., and Thales Group

Market dynamics

Parent market analysis, Market growth inducers and obstacles, Fast-growing and slow-growing segment analysis, COVID-19 impact and recovery analysis and future consumer dynamics, Market condition analysis for the forecast period. 

Customization purview

If our report has not included the data that you are looking for, you can reach out to our analysts and get segments customized.

Download PDF Sample

What are the Key Data Covered in this Japan Multifactor Authentication Market Research Report?

  • CAGR of the market report forecast during the forecast period
  • Detailed information on factors that will drive the growth of the market  between 2024 and 2028
  • Precise estimation of the market size and its contribution to the market in focus on the parent market
  • Accurate predictions about upcoming trends and changes in consumer behavior
  • Growth of the market across Japan
  • Thorough market analysis and report of the market’s competitive landscape and detailed information about companies
  • Comprehensive analysis of factors that will challenge the growth of Industry companies


We can help! Our analysts can customize this market research report to meet your requirements. Get in touch


1 Executive Summary

  • 1.1 Market overview
    • Exhibit 01: Executive Summary – Chart on Market Overview
    • Exhibit 02: Executive Summary – Data Table on Market Overview
    • Exhibit 03: Executive Summary – Chart on Country Market Characteristics
    • Exhibit 04: Executive Summary – Chart on Market Segmentation by Component
    • Exhibit 05: Executive Summary – Chart on Market Segmentation by Deployment
    • Exhibit 06: Executive Summary – Chart on Market Segmentation by Type
    • Exhibit 07: Executive Summary – Chart on Vendor Market Positioning

2 Market Landscape

  • 2.1 Market ecosystem
    • Exhibit 08: Parent market
    • Exhibit 09: Market Characteristics

3 Market Sizing

  • 3.1 Market definition
    • Exhibit 10: Offerings of vendors included in the market definition
  • 3.2 Market segment analysis
    • Exhibit 11: Market segments
  • 3.3 Market size 2023
    • 3.4 Market outlook: Forecast for 2023-2028
      • Exhibit 12: Chart on Japan - Market size and forecast 2023-2028 ($ million)
      • Exhibit 13: Data Table on Japan - Market size and forecast 2023-2028 ($ million)
      • Exhibit 14: Chart on Japan: Year-over-year growth 2023-2028 (%)
      • Exhibit 15: Data Table on Japan: Year-over-year growth 2023-2028 (%)

    4 Historic Market Size

    • 4.1 Multifactor authentication market in Japan 2018 - 2022
      • Exhibit 16: Historic Market Size – Data Table on multifactor authentication market in Japan 2018 - 2022 ($ million)
    • 4.2 Component Segment Analysis 2018 - 2022
      • Exhibit 17: Historic Market Size – Component Segment 2018 - 2022 ($ million)
    • 4.3 Deployment Segment Analysis 2018 - 2022
      • Exhibit 18: Historic Market Size – Deployment Segment 2018 - 2022 ($ million)
    • 4.4 Type Segment Analysis 2018 - 2022
      • Exhibit 19: Historic Market Size – Type Segment 2018 - 2022 ($ million)

    5 Five Forces Analysis

    • 5.1 Five forces summary
      • Exhibit 20: Five forces analysis - Comparison between 2023 and 2028
    • 5.2 Bargaining power of buyers
      • Exhibit 21: Chart on Bargaining power of buyers – Impact of key factors 2023 and 2028
    • 5.3 Bargaining power of suppliers
      • Exhibit 22: Bargaining power of suppliers – Impact of key factors in 2023 and 2028
    • 5.4 Threat of new entrants
      • Exhibit 23: Threat of new entrants – Impact of key factors in 2023 and 2028
    • 5.5 Threat of substitutes
      • Exhibit 24: Threat of substitutes – Impact of key factors in 2023 and 2028
    • 5.6 Threat of rivalry
      • Exhibit 25: Threat of rivalry – Impact of key factors in 2023 and 2028
    • 5.7 Market condition
      • Exhibit 26: Chart on Market condition - Five forces 2023 and 2028

    6 Market Segmentation by Component

    • 6.1 Market segments
      • Exhibit 27: Chart on Component - Market share 2023-2028 (%)
      • Exhibit 28: Data Table on Component - Market share 2023-2028 (%)
    • 6.2 Comparison by Component
      • Exhibit 29: Chart on Comparison by Component
      • Exhibit 30: Data Table on Comparison by Component
    • 6.3 Service - Market size and forecast 2023-2028
      • Exhibit 31: Chart on Service - Market size and forecast 2023-2028 ($ million)
      • Exhibit 32: Data Table on Service - Market size and forecast 2023-2028 ($ million)
      • Exhibit 33: Chart on Service - Year-over-year growth 2023-2028 (%)
      • Exhibit 34: Data Table on Service - Year-over-year growth 2023-2028 (%)
    • 6.4 Product - Market size and forecast 2023-2028
      • Exhibit 35: Chart on Product - Market size and forecast 2023-2028 ($ million)
      • Exhibit 36: Data Table on Product - Market size and forecast 2023-2028 ($ million)
      • Exhibit 37: Chart on Product - Year-over-year growth 2023-2028 (%)
      • Exhibit 38: Data Table on Product - Year-over-year growth 2023-2028 (%)
    • 6.5 Market opportunity by Component
      • Exhibit 39: Market opportunity by Component ($ million)
      • Exhibit 40: Data Table on Market opportunity by Component ($ million)

    7 Market Segmentation by Deployment

    • 7.1 Market segments
      • Exhibit 41: Chart on Deployment - Market share 2023-2028 (%)
      • Exhibit 42: Data Table on Deployment - Market share 2023-2028 (%)
    • 7.2 Comparison by Deployment
      • Exhibit 43: Chart on Comparison by Deployment
      • Exhibit 44: Data Table on Comparison by Deployment
    • 7.3 On premises - Market size and forecast 2023-2028
      • Exhibit 45: Chart on On premises - Market size and forecast 2023-2028 ($ million)
      • Exhibit 46: Data Table on On premises - Market size and forecast 2023-2028 ($ million)
      • Exhibit 47: Chart on On premises - Year-over-year growth 2023-2028 (%)
      • Exhibit 48: Data Table on On premises - Year-over-year growth 2023-2028 (%)
    • 7.4 Cloud - Market size and forecast 2023-2028
      • Exhibit 49: Chart on Cloud - Market size and forecast 2023-2028 ($ million)
      • Exhibit 50: Data Table on Cloud - Market size and forecast 2023-2028 ($ million)
      • Exhibit 51: Chart on Cloud - Year-over-year growth 2023-2028 (%)
      • Exhibit 52: Data Table on Cloud - Year-over-year growth 2023-2028 (%)
    • 7.5 Market opportunity by Deployment
      • Exhibit 53: Market opportunity by Deployment ($ million)
      • Exhibit 54: Data Table on Market opportunity by Deployment ($ million)

    8 Market Segmentation by Type

    • 8.1 Market segments
      • Exhibit 55: Chart on Type - Market share 2023-2028 (%)
      • Exhibit 56: Data Table on Type - Market share 2023-2028 (%)
    • 8.2 Comparison by Type
      • Exhibit 57: Chart on Comparison by Type
      • Exhibit 58: Data Table on Comparison by Type
    • 8.3 Password-based authentication - Market size and forecast 2023-2028
      • Exhibit 59: Chart on Password-based authentication - Market size and forecast 2023-2028 ($ million)
      • Exhibit 60: Data Table on Password-based authentication - Market size and forecast 2023-2028 ($ million)
      • Exhibit 61: Chart on Password-based authentication - Year-over-year growth 2023-2028 (%)
      • Exhibit 62: Data Table on Password-based authentication - Year-over-year growth 2023-2028 (%)
    • 8.4 Password-less authentication - Market size and forecast 2023-2028
      • Exhibit 63: Chart on Password-less authentication - Market size and forecast 2023-2028 ($ million)
      • Exhibit 64: Data Table on Password-less authentication - Market size and forecast 2023-2028 ($ million)
      • Exhibit 65: Chart on Password-less authentication - Year-over-year growth 2023-2028 (%)
      • Exhibit 66: Data Table on Password-less authentication - Year-over-year growth 2023-2028 (%)
    • 8.5 Market opportunity by Type
      • Exhibit 67: Market opportunity by Type ($ million)
      • Exhibit 68: Data Table on Market opportunity by Type ($ million)

    9 Customer Landscape

    • 9.1 Customer landscape overview
      • Exhibit 69: Analysis of price sensitivity, lifecycle, customer purchase basket, adoption rates, and purchase criteria

    10 Drivers, Challenges, and Trends

    • 10.1 Market drivers
      • 10.2 Market challenges
        • 10.3 Impact of drivers and challenges
          • Exhibit 70: Impact of drivers and challenges in 2023 and 2028
        • 10.4 Market trends

          11 Vendor Landscape

          • 11.1 Overview
            • 11.2 Vendor landscape
              • Exhibit 71: Overview on Criticality of inputs and Factors of differentiation
            • 11.3 Landscape disruption
              • Exhibit 72: Overview on factors of disruption
            • 11.4 Industry risks
              • Exhibit 73: Impact of key risks on business

            12 Vendor Analysis

            • 12.1 Vendors covered
              • Exhibit 74: Vendors covered
            • 12.2 Market positioning of vendors
              • Exhibit 75: Matrix on vendor position and classification
            • 12.3 Akamai Technologies Inc.
              • Exhibit 76: Akamai Technologies Inc. - Overview
              • Exhibit 77: Akamai Technologies Inc. - Business segments
              • Exhibit 78: Akamai Technologies Inc. - Key offerings
              • Exhibit 79: Akamai Technologies Inc. - Segment focus
            • 12.4 Amazon.com Inc.
              • Exhibit 80: Amazon.com Inc. - Overview
              • Exhibit 81: Amazon.com Inc. - Business segments
              • Exhibit 82: Amazon.com Inc. - Key news
              • Exhibit 83: Amazon.com Inc. - Key offerings
              • Exhibit 84: Amazon.com Inc. - Segment focus
            • 12.5 Cisco Systems Inc.
              • Exhibit 85: Cisco Systems Inc. - Overview
              • Exhibit 86: Cisco Systems Inc. - Business segments
              • Exhibit 87: Cisco Systems Inc. - Key news
              • Exhibit 88: Cisco Systems Inc. - Key offerings
              • Exhibit 89: Cisco Systems Inc. - Segment focus
            • 12.6 Entrust Corp.
              • Exhibit 90: Entrust Corp. - Overview
              • Exhibit 91: Entrust Corp. - Product / Service
              • Exhibit 92: Entrust Corp. - Key news
              • Exhibit 93: Entrust Corp. - Key offerings
            • 12.7 Fujitsu Ltd.
              • Exhibit 94: Fujitsu Ltd. - Overview
              • Exhibit 95: Fujitsu Ltd. - Business segments
              • Exhibit 96: Fujitsu Ltd. - Key news
              • Exhibit 97: Fujitsu Ltd. - Key offerings
              • Exhibit 98: Fujitsu Ltd. - Segment focus
            • 12.8 International Business Machines Corp.
              • Exhibit 99: International Business Machines Corp. - Overview
              • Exhibit 100: International Business Machines Corp. - Business segments
              • Exhibit 101: International Business Machines Corp. - Key news
              • Exhibit 102: International Business Machines Corp. - Key offerings
              • Exhibit 103: International Business Machines Corp. - Segment focus
            • 12.9 Kyndryl Inc.
              • Exhibit 104: Kyndryl Inc. - Overview
              • Exhibit 105: Kyndryl Inc. - Product / Service
              • Exhibit 106: Kyndryl Inc. - Key offerings
            • 12.10 Microsoft Corp.
              • Exhibit 107: Microsoft Corp. - Overview
              • Exhibit 108: Microsoft Corp. - Business segments
              • Exhibit 109: Microsoft Corp. - Key news
              • Exhibit 110: Microsoft Corp. - Key offerings
              • Exhibit 111: Microsoft Corp. - Segment focus
            • 12.11 NEC Corp.
              • Exhibit 112: NEC Corp. - Overview
              • Exhibit 113: NEC Corp. - Business segments
              • Exhibit 114: NEC Corp. - Key news
              • Exhibit 115: NEC Corp. - Key offerings
              • Exhibit 116: NEC Corp. - Segment focus
            • 12.12 Okta Inc.
              • Exhibit 117: Okta Inc. - Overview
              • Exhibit 118: Okta Inc. - Product / Service
              • Exhibit 119: Okta Inc. - Key offerings
            • 12.13 Ping Identity Corp.
              • Exhibit 120: Ping Identity Corp. - Overview
              • Exhibit 121: Ping Identity Corp. - Product / Service
              • Exhibit 122: Ping Identity Corp. - Key offerings
            • 12.14 Quest Software Inc.
              • Exhibit 123: Quest Software Inc. - Overview
              • Exhibit 124: Quest Software Inc. - Product / Service
              • Exhibit 125: Quest Software Inc. - Key offerings
            • 12.15 Salesforce Inc.
              • Exhibit 126: Salesforce Inc. - Overview
              • Exhibit 127: Salesforce Inc. - Product / Service
              • Exhibit 128: Salesforce Inc. - Key news
              • Exhibit 129: Salesforce Inc. - Key offerings
            • 12.16 Thales Group
              • Exhibit 130: Thales Group - Overview
              • Exhibit 131: Thales Group - Business segments
              • Exhibit 132: Thales Group - Key news
              • Exhibit 133: Thales Group - Key offerings
              • Exhibit 134: Thales Group - Segment focus

            13 Appendix

            • 13.1 Scope of the report
              • 13.2 Inclusions and exclusions checklist
                • Exhibit 135: Inclusions checklist
                • Exhibit 136: Exclusions checklist
              • 13.3 Currency conversion rates for US$
                • Exhibit 137: Currency conversion rates for US$
              • 13.4 Research methodology
                • Exhibit 138: Research methodology
                • Exhibit 139: Validation techniques employed for market sizing
                • Exhibit 140: Information sources
              • 13.5 List of abbreviations
                • Exhibit 141: List of abbreviations

              Research Methodology

              Technavio presents a detailed picture of the market by way of study, synthesis, and summation of data from multiple sources. The analysts have presented the various facets of the market with a particular focus on identifying the key industry influencers. The data thus presented is comprehensive, reliable, and the result of extensive research, both primary and secondary.

              INFORMATION SOURCES

              Primary sources

              • Manufacturers and suppliers
              • Channel partners
              • Industry experts
              • Strategic decision makers

              Secondary sources

              • Industry journals and periodicals
              • Government data
              • Financial reports of key industry players
              • Historical data
              • Press releases

              DATA ANALYSIS

              Data Synthesis

              • Collation of data
              • Estimation of key figures
              • Analysis of derived insights

              Data Validation

              • Triangulation with data models
              • Reference against proprietary databases
              • Corroboration with industry experts

              REPORT WRITING

              Qualitative

              • Market drivers
              • Market challenges
              • Market trends
              • Five forces analysis

              Quantitative

              • Market size and forecast
              • Market segmentation
              • Geographical insights
              • Competitive landscape

              Interested in this report?

              Get your sample now to see our research methodology and insights!

              Download Now

              Frequently Asked Questions

              Multifactor Authenticationin Japan market growth will increase by $ 1088.98 mn during 2024-2028.

              The Multifactor Authenticationin Japan market is expected to grow at a CAGR of 24.39% during 2024-2028.

              Multifactor Authenticationin Japan market is segmented by Component( Service, Product) Deployment( On premises, Cloud) Type( Password-based authentication, Password-less authentication)

              Akamai Technologies Inc., Amazon.com Inc., Cisco Systems Inc., Entrust Corp., Fujitsu Ltd., International Business Machines Corp., Kyndryl Inc., Microsoft Corp., NEC Corp., Okta Inc., Ping Identity Corp., Quest Software Inc., Salesforce Inc., Thales Group are a few of the key vendors in the Multifactor Authenticationin Japan market.

              APAC will register the highest growth rate of 100% among the other regions. Therefore, the Multifactor Authenticationin Japan market in APAC is expected to garner significant business opportunities for the vendors during the forecast period.

              Japan, Asia

              • Emergence of cloud-based multifactor authentication solutions and servicesThe rise in maintenance costs for hardware and software-based two-factor and three-factor authentication models has aroused the interest of many companies in the adoption of cloud-based multifactor authentication solutions and services. Vendors are integrating multifactor authentication techniques with the cloud due to the growing demand for cloud-based multifactor authentication. Companies prefer cloud-based multifactor authentication because of its benefits is the driving factor this market.
              • such as easy installation and upgrading is the driving factor this market.
              • pay-as-you-go is the driving factor this market.
              • zero maintenance costs is the driving factor this market.
              • less dependency on internal IT personnel is the driving factor this market.
              • and improved reliability and scalability. Cloud-based multifactor authentication offers secure access to networks and applications is the driving factor this market.
              • protects users while improving user experience is the driving factor this market.
              • and addresses compliance requirements for the security of regulated data. These benefits simplify the deployment and management of traditional hardware tokens. They also reduce the cost and difficulty of deploying traditional hardware tokens. Many cloud providers offer robust authentication measures and role-based access control. The adoption of the cloud is rapidly increasing among industries is the driving factor this market.
              • giving rise to many security challenges for cloud service providers and other ecosystem vendors is the driving factor this market.
              • especially in dealing with the complexity of privacy and data protection regulations. To guarantee the security and safety of data on the cloud is the driving factor this market.
              • cloud service providers are adopting technologies such as tokenization is the driving factor this market.
              • biometric authentication is the driving factor this market.
              • etc. is the driving factor this market.
              • by implementing various models of multifactor authentication is the driving factor this market.
              • which can provide authentication for the safety of data stored on the cloud. The demand for multifactor authentication for securing the data and information in the cloud environment is likely to provide huge opportunities to multifactor authentication solution providers and cloud service providers is the driving factor this market.
              • which will drive the multifactor authentication market in Japan during the forecast period. is the driving factor this market.

              The Multifactor Authenticationin Japan market vendors should focus on grabbing business opportunities from the Service segment as it accounted for the largest market share in the base year.