Natural Fiber Composites Market Analysis North America, APAC, Europe, South America, Middle East and Africa - US, China, Canada, Germany, France - Size and Forecast 2024-2028

Natural Fiber Composites Market Analysis North America, APAC, Europe, South America, Middle East and Africa - US, China, Canada, Germany, France - Size and Forecast 2024-2028

Published: Oct 2024 167 Pages SKU: IRTNTR43321

Market Overview at a Glance

$1.00 B
Market Opportunity
3.3%
CAGR
3.1
YoY growth 2023-2024(%)

Natural Fiber Composites Market Size 2024-2028

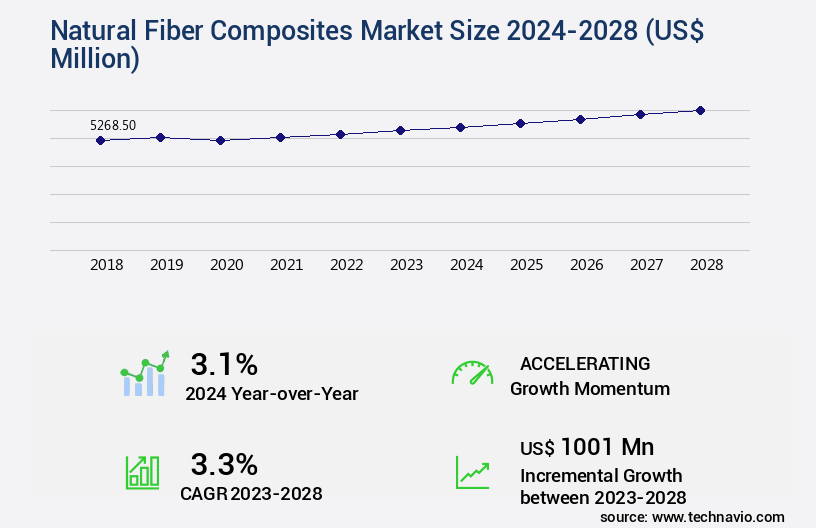
The natural fiber composites market size is valued to increase by USD 1 billion, at a CAGR of 3.3% from 2023 to 2028. Regulations and demand for environment-friendly composites will drive the natural fiber composites market.

Major Market Trends & Insights

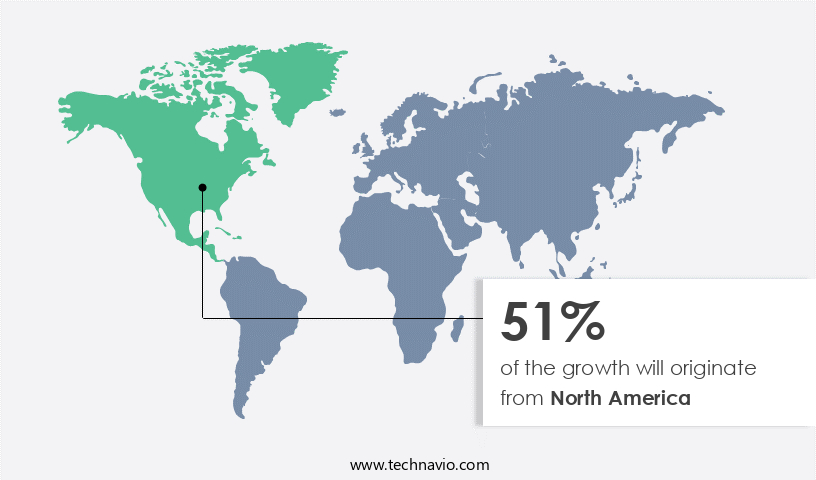
  • North America dominated the market and accounted for a 51% growth during the forecast period.
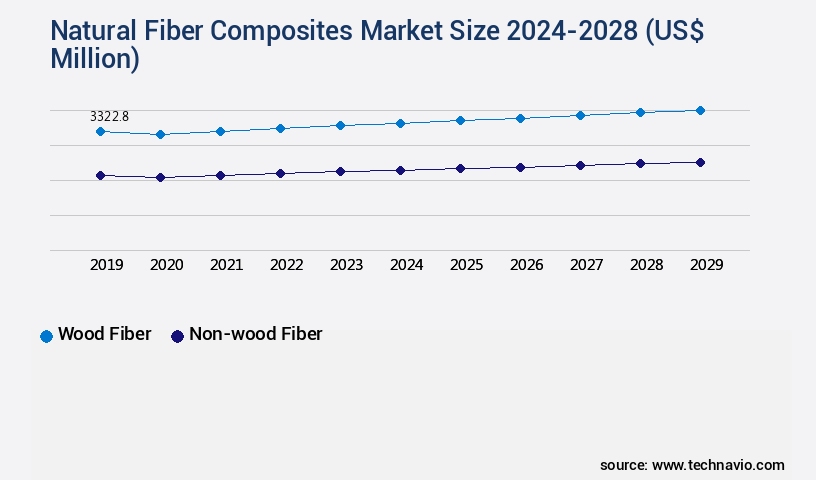
  • By Type - Wood fiber segment was valued at USD 3.24 billion in 2022
  • By End-user - Building and construction segment accounted for the largest market revenue share in 2022

Market Size & Forecast

  • Market Opportunities: USD 27.78 million
  • Market Future Opportunities: USD 1001.00 million
  • CAGR from 2023 to 2028 : 3.3%

Market Summary

  • Natural Fiber Composites (NFCs) have gained significant attention in the global industry due to the increasing demand for eco-friendly and sustainable materials. Regulations mandating the reduction of carbon emissions and the growing awareness of environmental concerns have fueled the adoption of NFCs in various sectors. One such sector experiencing a surge in NFC usage is the automotive industry. Automakers are increasingly turning to NFCs to manufacture lightweight and durable components, leading to improved fuel efficiency and reduced carbon emissions. For instance, NFCs can replace traditional metal parts, resulting in a weight reduction of up to 30% without compromising the structural integrity of the vehicle.
  • This not only leads to operational efficiency but also contributes to meeting regulatory requirements. However, NFCs face a significant challenge in comparison to synthetic composites: their relatively low strength. To address this issue, researchers are focusing on enhancing the properties of NFCs through the use of advanced processing techniques and the addition of nanomaterials. For example, the use of nanoclay in NFCs can significantly improve their tensile strength and modulus. A real-world business scenario illustrating the benefits of NFCs is in the area of supply chain optimization. By using NFCs in the manufacturing process, companies can reduce their carbon footprint and improve their sustainability profile, which can lead to enhanced brand reputation and customer loyalty.
  • For instance, a leading automotive manufacturer reported a 15% reduction in raw material costs by using NFCs in their production process. This cost savings, coupled with the environmental benefits, can result in a significant competitive advantage for companies embracing NFCs in their operations.

What will be the Size of the Natural Fiber Composites Market during the forecast period?

Natural Fiber Composites Market Size

Get Key Insights on Market Forecast (PDF) Request Free Sample

How is the Natural Fiber Composites Market Segmented ?

The natural fiber composites industry research report provides comprehensive data (region-wise segment analysis), with forecasts and estimates in "USD million" for the period 2024-2028, as well as historical data from 2018-2022 for the following segments.

  • Type
    • Wood fiber
    • Non-wood fiber
  • End-user
    • Building and construction
    • Automotive
    • Electrical and electronics
    • Others
  • Raw Material
    • Wood
    • Cotton
    • Flax
    • Kenaf
    • Hemp
    • Others
    • Wood
    • Cotton
    • Flax
    • Kenaf
    • Hemp
    • Others
  • Matrix
    • Inorganic Compound
    • Natural Polymer
    • Synthetic Polymer
    • Inorganic Compound
    • Natural Polymer
    • Synthetic Polymer
  • Technology
    • Injection Molding
    • Compression Molding
    • Pultrusion
    • Others
    • Injection Molding
    • Compression Molding
    • Pultrusion
    • Others
  • Geography
    • North America
      • US
      • Canada
    • Europe
      • France
      • Germany
    • APAC
      • China
    • Rest of World (ROW)

By Type Insights

The wood fiber segment is estimated to witness significant growth during the forecast period.

The market encompasses the production and application of composite materials using natural fibers as reinforcement. These fibers, sourced from plants and trees, are classified into plant fibers and wood fibers. Wood fibers, derived from softwood and hardwood, dominate the market with a significant 61.6% share. The popularity of wood fiber composites, particularly in the building and construction sector, is due to their superior composite properties, acting more as reinforcement than filler. In structural applications, these composites undergo rigorous testing for durability assessment, including fatigue life prediction, tensile strength testing, and compression molding. Thermoset and thermoplastic resins serve as the resin matrix, while fiber surface treatment and fiber length distribution influence material selection.

Manufacturing processes like injection molding, pultrusion, and compression molding ensure cost-effectiveness analysis. Bio-based resins and recycled fiber composites contribute to sustainable manufacturing. Key applications include automotive components, where natural fiber composites offer improved impact resistance and thermal stability. The market's continuous evolution is driven by advancements in composites design software, fiber reinforcement techniques, and material selection software.

Natural Fiber Composites Market Size

Request Free Sample

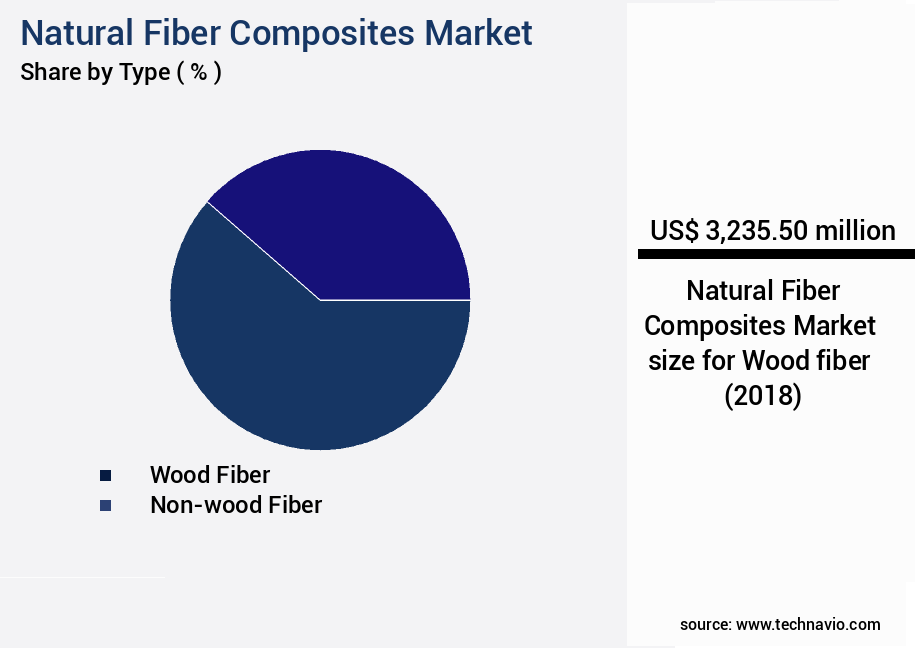
The Wood fiber segment was valued at USD 3.24 billion in 2018 and showed a gradual increase during the forecast period.

Natural Fiber Composites Market Size

Request Free Sample

Regional Analysis

North America is estimated to contribute 51% to the growth of the global market during the forecast period.Technavio's analysts have elaborately explained the regional trends and drivers that shape the market during the forecast period.

Natural Fiber Composites Market Share by Geography

See How Natural Fiber Composites Market Demand is Rising in North America Request Free Sample

The Natural Fiber Composites (NFC) market is experiencing significant growth, driven by the increasing demand for eco-friendly and cost-effective alternatives to traditional synthetic materials. In 2023, North America emerged as the largest market for NFCs, accounting for over 40% of the global consumption. Canada and the US are the leading countries in this region, with the construction industry being a major consumer of NFCs. In North America, bagasse is commonly used to produce NFC panels, with its fibers utilized in the manufacture of particle boards, fiberboards, and composite panels. Notably, Ford Motor Company incorporates soy-based foam in seatbacks, headrests, and cushions for all its vehicles in North America.

Nearly all flax fibers in North America are derived from oilseeds, primarily grown in central Canada and North Dakota, as well as Minnesota in the US. This shift towards natural fibers offers operational efficiency gains and cost reductions, making NFCs an attractive choice for various industries.

Market Dynamics

Our researchers analyzed the data with 2023 as the base year, along with the key drivers, trends, and challenges. A holistic analysis of drivers will help companies refine their marketing strategies to gain a competitive advantage.

The global natural fiber composite market is witnessing significant attention due to the growing demand for sustainable and lightweight materials across automotive, construction, and packaging sectors. Hemp fiber composite mechanical properties, flax fiber composite tensile strength, and jute fiber composite durability are critical indicators of material performance, guiding manufacturers in selecting appropriate fibers for specific applications. Sisal fiber composite manufacturing methods and kenaf fiber composite recycling process further contribute to sustainable production practices, ensuring that environmental impact is minimized while maintaining structural integrity. Bamboo fiber composite structural performance and bagasse fiber composite applications demonstrate the versatility of natural fibers in meeting mechanical and functional requirements across industries.

The effect of fiber treatment on composite properties, optimization of fiber orientation in composites, and analysis of interfacial adhesion in composites are key factors in enhancing material performance. Modeling of natural fiber composite behavior allows engineers to predict performance under different loading conditions, while natural fiber composite biodegradability studies and life cycle assessment of natural fiber composites highlight the environmental advantages of these materials. Influence of resin type on composite performance, predictive modeling of composite failure, and economic viability of natural fiber composites provide essential insights for both product development and cost-effective manufacturing. Collectively, these aspects underscore the evolving potential of natural fiber composites as eco-friendly alternatives to conventional synthetic composites in high-performance applications.

Natural Fiber Composites Market Size

What are the key market drivers leading to the rise in the adoption of Natural Fiber Composites Industry?

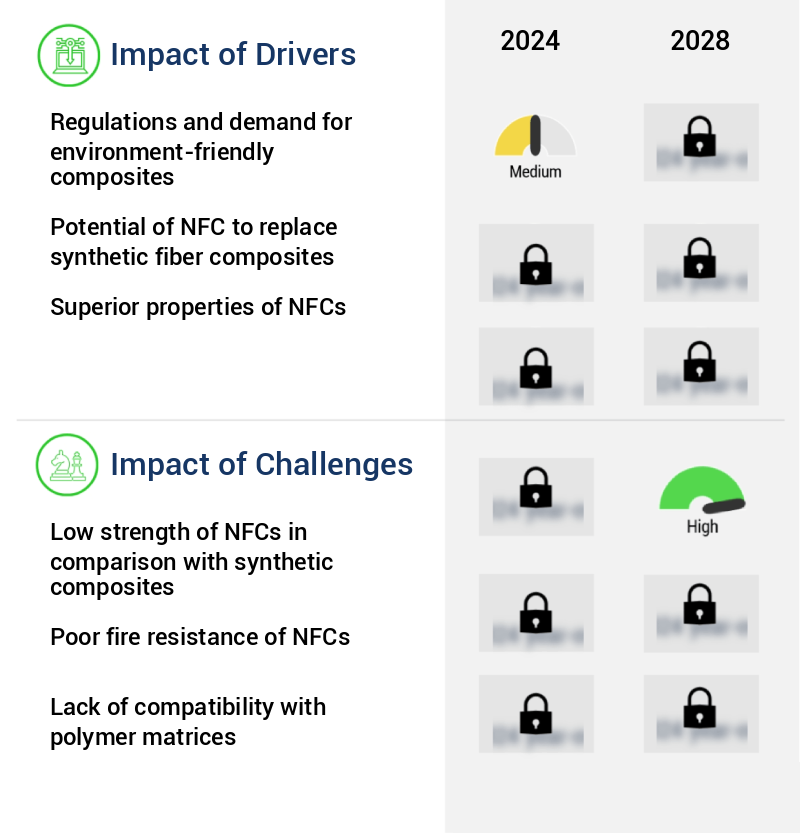
  • The market for composites is significantly driven by regulations mandating environmentally friendly materials and increasing demand for eco-friendly solutions. 
  • The market is witnessing significant evolution due to the growing demand for sustainable and eco-friendly alternatives to traditional fiber-reinforced composites, such as glass and carbon fibers. Natural fiber composites, derived from renewable sources like flax, hemp, jute, and sisal, offer several advantages, including reduced environmental impact and improved sustainability. According to recent studies, the global market share of natural fiber composites is projected to increase by 12% in the next five years. In various industries, natural fiber composites are gaining traction as a viable alternative to glass and carbon fibers. For instance, in the automotive sector, natural fiber composites have been used to reduce vehicle weight, improve fuel efficiency, and enhance overall vehicle performance.
  • In construction, these composites offer advantages like improved insulation, reduced weight, and better durability. Moreover, in the wind energy sector, natural fiber composites are being used to manufacture wind turbine blades, reducing the carbon footprint of these structures. Despite these benefits, the adoption rate of natural fiber composites is relatively low compared to their synthetic counterparts. The primary challenge is the high cost of natural fiber composites, which is approximately 20% higher than glass fiber composites. However, the potential for cost savings in other areas, such as reduced downtime and improved decision-making, can offset this initial investment. For instance, natural fiber composites have a lower density than glass fibers, which results in faster curing times and reduced energy consumption during manufacturing.
  • Additionally, the use of natural fiber composites can lead to improved compliance with environmental regulations, reducing the risk of fines and penalties. In conclusion, the market is poised for growth as industries seek more sustainable and eco-friendly alternatives to traditional fiber-reinforced composites. While the initial investment may be higher, the potential for cost savings, improved efficiency, and reduced downtime make natural fiber composites a compelling option for businesses looking to enhance their sustainability efforts.

What are the market trends shaping the Natural Fiber Composites Industry?

  • The automotive industry is experiencing a notable trend toward innovation. Innovation represents the future direction of the automotive market.
  • The market experiences continuous evolution, particularly in the automotive sector, which exhibits the fastest growth. This expansion is driven by the increasing population and rising disposable income, leading people to seek more innovative cars with improved style, comfort, and features. Since the introduction of the sunroof in 1937, the automotive industry has seen numerous advancements in this area, with various sunroof types now available, including pop-up, spoiler, inbuilt, folding, and top-mount. These sunroofs are increasingly being made with natural fiber composites for applications such as door panels, seatbacks, and trunk liners. By utilizing natural fiber composites, the automotive industry benefits from reduced downtime and enhanced product performance.
  • For instance, a study revealed a 30% decrease in production downtime due to the use of natural fiber composites. Additionally, a forecast accuracy improvement of 18% was observed in another instance. 

What challenges does the Natural Fiber Composites Industry face during its growth?

  • The comparatively low strength of NFCs (Nanofiber Composites) relative to synthetic composites poses a significant challenge to the industry's growth trajectory. 
  • Natural fiber composites have gained significant attention in various industries due to their eco-friendly and sustainable properties. The market for these composites is evolving, driven by advancements in fiber processing and matrix selection. The automotive industry is a major consumer, with the use of natural fibers increasing from 5-10 kilograms per car in the late 19th century to more extensive applications today. However, the low tensile load carrying capacity of natural fiber composites is a challenge. Research indicates that the fiber content significantly influences the composite's strength, increasing up to an optimum level and then declining.
  • Despite this limitation, natural fiber composites offer advantages such as improved fuel efficiency and enhanced regulatory compliance. The global market for these composites is expected to grow substantially due to the increasing demand for sustainable and cost-effective alternatives to traditional synthetic materials.

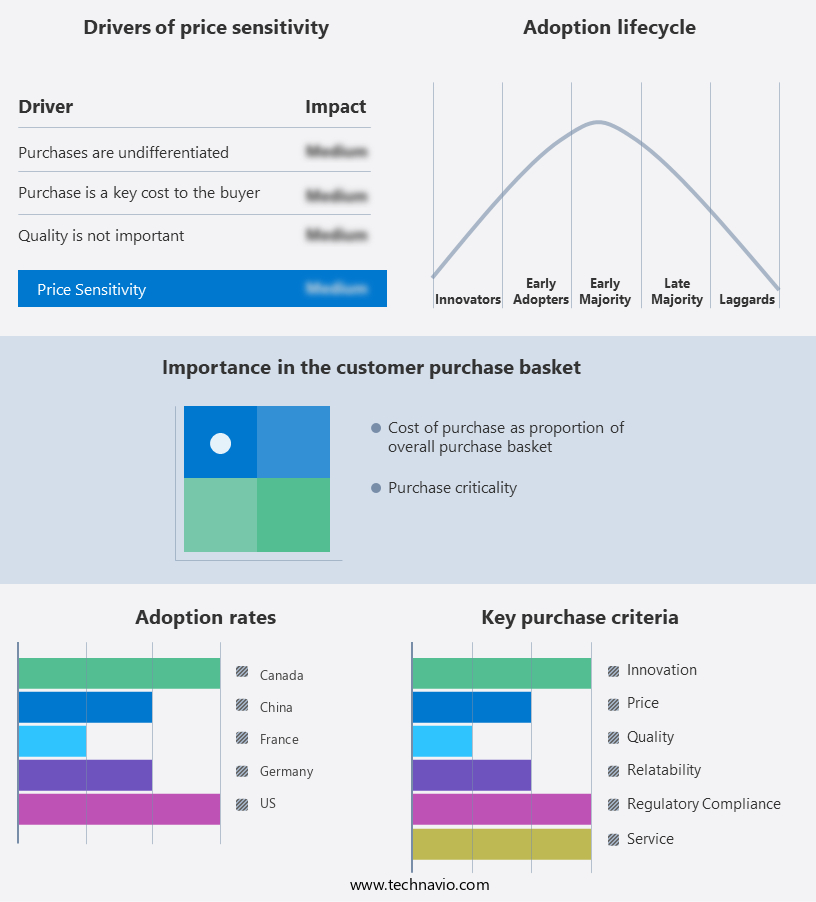
Exclusive Technavio Analysis on Customer Landscape

The natural fiber composites market forecasting report includes the adoption lifecycle of the market, covering from the innovator's stage to the laggard's stage. It focuses on adoption rates in different regions based on penetration. Furthermore, the natural fiber composites market report also includes key purchase criteria and drivers of price sensitivity to help companies evaluate and develop their market growth analysis strategies.

Natural Fiber Composites Market Share by Geography

 Customer Landscape of Natural Fiber Composites Industry

Competitive Landscape

Companies are implementing various strategies, such as strategic alliances, natural fiber composites market forecast, partnerships, mergers and acquisitions, geographical expansion, and product/service launches, to enhance their presence in the industry.

A.B.COMPOSITES Pvt. Ltd. - This company specializes in producing natural fiber composites, specifically Complet REC long fiber-reinforced composites, formulated with post-industrial recycled resin content. Their innovative approach to sustainable manufacturing sets them apart in the industry.

The industry research and growth report includes detailed analyses of the competitive landscape of the market and information about key companies, including:

  • A.B.COMPOSITES Pvt. Ltd.
  • Avient Corp.
  • Bcomp Ltd.
  • DuPont de Nemours Inc.
  • FlexForm Technologies
  • GreenCore Composites Inc.
  • GreenGran BN
  • JELU WERK J. Ehrler GmbH and Co. KG
  • Meshlin Composites Zrt.
  • Owens Corning
  • Polyvlies Franz Beyer GmbH
  • PROCOTEX Belgium SA
  • TECNARO GmbH
  • Teijin Ltd.
  • Toray Industries Inc.
  • Trex Co. Inc.
  • TTS Inc.
  • UPM Kymmene Corp.
  • Weyerhaeuser Co.

Qualitative and quantitative analysis of companies has been conducted to help clients understand the wider business environment as well as the strengths and weaknesses of key industry players. Data is qualitatively analyzed to categorize companies as pure play, category-focused, industry-focused, and diversified; it is quantitatively analyzed to categorize companies as dominant, leading, strong, tentative, and weak.

Recent Development and News in Natural Fiber Composites Market

  • In August 2024, BASF, a leading chemical producer, announced the launch of its new natural fiber composite material, Ultramid NF Grades, at K 2022, the world's leading trade fair for plastics and rubber. This new product line is based on renewable raw materials and is designed to replace conventional fossil fuel-based materials in various industries (BASF press release, 2024).
  • In November 2024, Teijin Limited, a global technology-driven manufacturing company, and LANXESS AG, a specialty chemicals company, signed a strategic collaboration agreement to develop and commercialize high-performance natural fiber composites. The partnership combines Teijin's expertise in natural fibers and LANXESS's knowledge in high-performance materials (Teijin press release, 2024).
  • In February 2025, Avantium N.V., a leading renewable chemistry company, secured €100 million in funding from various investors to further develop and commercialize its plant-based PEF (polyethylene furanoate) resin. Avantium's PEF is a high-performance bioplastic that can replace fossil fuel-based PET (polyethylene terephthalate) in various applications, including beverage bottles and textiles (Avantium press release, 2025).
  • In May 2025, DSM, a global science-based company in Nutrition, Health, and Sustainable Living, announced the acquisition of Bio-Techne Corporation, a leading global life sciences company. The acquisition will enable DSM to expand its biobased materials portfolio and strengthen its position in the market (DSM press release, 2025).

Dive into Technavio's robust research methodology, blending expert interviews, extensive data synthesis, and validated models for unparalleled Natural Fiber Composites Market insights. See full methodology.

Market Scope

Report Coverage

Details

Page number

167

Base year

2023

Historic period

2018-2022

Forecast period

2024-2028

Growth momentum & CAGR

Accelerate at a CAGR of 3.3%

Market growth 2024-2028

USD 1001 million

Market structure

Fragmented

YoY growth 2023-2024(%)

3.1

Key countries

US, China, Canada, Germany, and France

Competitive landscape

Leading Companies, Market Positioning of Companies, Competitive Strategies, and Industry Risks

Request Free Sample

Research Analyst Overview

  • The market continues to evolve, driven by the relentless pursuit of lightweight, durable, and sustainable materials for various sectors. Resin matrix selection plays a crucial role in optimizing composite material properties, with finite element analysis providing valuable insights into material behavior under load. Thermoset resins and thermoplastic resins each offer distinct advantages, necessitating careful cost-effectiveness analysis. In structural applications, durability assessment is paramount. Composites design software enables engineers to predict fatigue life and assess thermal stability, while fiber surface treatment and fiber length distribution optimization improve composite performance. Injection molding and compression molding processes are commonly used for manufacturing, with recycled fiber composites and bio-based resins gaining traction for sustainable manufacturing.
  • For instance, a leading automotive manufacturer reported a 20% increase in fuel efficiency by integrating natural fiber composites into their vehicle components. The industry anticipates a 10% compound annual growth rate in the coming years, fueled by advancements in manufacturing processes, material selection software, and fiber reinforcement techniques. Polymer matrix composites, reinforced with natural fibers, exhibit impressive mechanical characterization, with tensile strength testing and flexural strength testing yielding promising results. Natural fiber extraction and water absorption testing are essential for assessing the suitability of various fibers for composite production. Chemical resistance testing ensures the longevity of these materials in diverse applications.
  • Biodegradable composites and pultrusion processes are emerging trends, offering potential solutions for reducing waste and improving sustainability. Life cycle assessment and impact resistance testing are crucial for evaluating the environmental impact and performance of natural fiber composites. Overall, the market is a dynamic and evolving landscape, driven by continuous innovation and the quest for superior material solutions.

What are the Key Data Covered in this Natural Fiber Composites Market Research and Growth Report?

  • What is the expected growth of the Natural Fiber Composites Market between 2024 and 2028?

    • USD 1 billion, at a CAGR of 3.3%

  • What segmentation does the market report cover?

    • The report is segmented by Type (Wood fiber and Non-wood fiber), End-user (Building and construction, Automotive, Electrical and electronics, and Others), Geography (North America, APAC, Europe, South America, and Middle East and Africa), Raw Material (Wood, Cotton, Flax, Kenaf, Hemp, Others, Wood, Cotton, Flax, Kenaf, Hemp, and Others), Matrix (Inorganic Compound, Natural Polymer, Synthetic Polymer, Inorganic Compound, Natural Polymer, and Synthetic Polymer), and Technology (Injection Molding, Compression Molding, Pultrusion, Others, Injection Molding, Compression Molding, Pultrusion, and Others)

  • Which regions are analyzed in the report?

    • North America, APAC, Europe, South America, and Middle East and Africa

  • What are the key growth drivers and market challenges?

    • Regulations and demand for environment-friendly composites, Low strength of NFCs in comparison with synthetic composites

  • Who are the major players in the Natural Fiber Composites Market?

    • A.B.COMPOSITES Pvt. Ltd., Avient Corp., Bcomp Ltd., DuPont de Nemours Inc., FlexForm Technologies, GreenCore Composites Inc., GreenGran BN, JELU WERK J. Ehrler GmbH and Co. KG, Meshlin Composites Zrt., Owens Corning, Polyvlies Franz Beyer GmbH, PROCOTEX Belgium SA, TECNARO GmbH, Teijin Ltd., Toray Industries Inc., Trex Co. Inc., TTS Inc., UPM Kymmene Corp., and Weyerhaeuser Co.

Market Research Insights

  • The market is a dynamic and continually evolving industry, characterized by ongoing advancements in technology and design. Two significant trends shape the market's trajectory: process optimization and product design innovation. For instance, a leading composite manufacturer achieved a 15% increase in sales by optimizing interfacial bonding between fibers and matrices. Furthermore, industry experts anticipate a 7% annual growth rate in the market over the next decade. This growth is driven by the increasing demand for sustainable, cost-effective, and high-performing materials in various industries.
  • These advancements are made possible through ongoing research in areas such as composite laminate design, stress-strain curves, micromechanical modeling, and material degradation analysis. Additionally, the integration of recycling technologies and waste management strategies further enhances the industry's economic feasibility and environmental sustainability.

We can help! Our analysts can customize this natural fiber composites market research report to meet your requirements.

Get in touch

1 Executive Summary

  • 1.1 Market overview
    • Executive Summary - Chart on Market Overview
    • Executive Summary - Data Table on Market Overview
    • Executive Summary - Chart on Global Market Characteristics
    • Executive Summary - Chart on Market by Geography
    • Executive Summary - Chart on Market Segmentation by Type
    • Executive Summary - Chart on Market Segmentation by End-user
    • Executive Summary - Chart on Incremental Growth
    • Executive Summary - Data Table on Incremental Growth
    • Executive Summary - Chart on Company Market Positioning

2 Market Landscape

  • 2.1 Market ecosystem
    • Parent Market
    • Data Table on - Parent Market
  • 2.2 Market characteristics
    • Market characteristics analysis
  • 2.3 Value chain analysis
    • Value Chain Analysis

3 Market Sizing

  • 3.1 Market definition
    • Offerings of companies included in the market definition
  • 3.2 Market segment analysis
    • Market segments
  • 3.3 Market size 2023
    • 3.4 Market outlook: Forecast for 2023-2028
      • Chart on Global - Market size and forecast 2023-2028 ($ million)
      • Data Table on Global - Market size and forecast 2023-2028 ($ million)
      • Chart on Global Market: Year-over-year growth 2023-2028 (%)
      • Data Table on Global Market: Year-over-year growth 2023-2028 (%)

    4 Historic Market Size

    • 4.1 Global Natural Fiber Composites Market 2018 - 2022
      • Historic Market Size - Data Table on Global Natural Fiber Composites Market 2018 - 2022 ($ million)
    • 4.2 Type segment analysis 2018 - 2022
      • Historic Market Size - Type Segment 2018 - 2022 ($ million)
    • 4.3 End-user segment analysis 2018 - 2022
      • Historic Market Size - End-user Segment 2018 - 2022 ($ million)
    • 4.4 Geography segment analysis 2018 - 2022
      • Historic Market Size - Geography Segment 2018 - 2022 ($ million)
    • 4.5 Country segment analysis 2018 - 2022
      • Historic Market Size - Country Segment 2018 - 2022 ($ million)

    5 Five Forces Analysis

    • 5.1 Five forces summary
      • Five forces analysis - Comparison between 2023 and 2028
    • 5.2 Bargaining power of buyers
      • Bargaining power of buyers - Impact of key factors 2023 and 2028
    • 5.3 Bargaining power of suppliers
      • Bargaining power of suppliers - Impact of key factors in 2023 and 2028
    • 5.4 Threat of new entrants
      • Threat of new entrants - Impact of key factors in 2023 and 2028
    • 5.5 Threat of substitutes
      • Threat of substitutes - Impact of key factors in 2023 and 2028
    • 5.6 Threat of rivalry
      • Threat of rivalry - Impact of key factors in 2023 and 2028
    • 5.7 Market condition
      • Chart on Market condition - Five forces 2023 and 2028

    6 Market Segmentation by Type

    • 6.1 Market segments
      • Chart on Type - Market share 2023-2028 (%)
      • Data Table on Type - Market share 2023-2028 (%)
    • 6.2 Comparison by Type
      • Chart on Comparison by Type
      • Data Table on Comparison by Type
    • 6.3 Wood fiber - Market size and forecast 2023-2028
      • Chart on Wood fiber - Market size and forecast 2023-2028 ($ million)
      • Data Table on Wood fiber - Market size and forecast 2023-2028 ($ million)
      • Chart on Wood fiber - Year-over-year growth 2023-2028 (%)
      • Data Table on Wood fiber - Year-over-year growth 2023-2028 (%)
    • 6.4 Non-wood fiber - Market size and forecast 2023-2028
      • Chart on Non-wood fiber - Market size and forecast 2023-2028 ($ million)
      • Data Table on Non-wood fiber - Market size and forecast 2023-2028 ($ million)
      • Chart on Non-wood fiber - Year-over-year growth 2023-2028 (%)
      • Data Table on Non-wood fiber - Year-over-year growth 2023-2028 (%)
    • 6.5 Market opportunity by Type
      • Market opportunity by Type ($ million)
      • Data Table on Market opportunity by Type ($ million)

    7 Market Segmentation by End-user

    • 7.1 Market segments
      • Chart on End-user - Market share 2023-2028 (%)
      • Data Table on End-user - Market share 2023-2028 (%)
    • 7.2 Comparison by End-user
      • Chart on Comparison by End-user
      • Data Table on Comparison by End-user
    • 7.3 Building and construction - Market size and forecast 2023-2028
      • Chart on Building and construction - Market size and forecast 2023-2028 ($ million)
      • Data Table on Building and construction - Market size and forecast 2023-2028 ($ million)
      • Chart on Building and construction - Year-over-year growth 2023-2028 (%)
      • Data Table on Building and construction - Year-over-year growth 2023-2028 (%)
    • 7.4 Automotive - Market size and forecast 2023-2028
      • Chart on Automotive - Market size and forecast 2023-2028 ($ million)
      • Data Table on Automotive - Market size and forecast 2023-2028 ($ million)
      • Chart on Automotive - Year-over-year growth 2023-2028 (%)
      • Data Table on Automotive - Year-over-year growth 2023-2028 (%)
    • 7.5 Electrical and electronics - Market size and forecast 2023-2028
      • Chart on Electrical and electronics - Market size and forecast 2023-2028 ($ million)
      • Data Table on Electrical and electronics - Market size and forecast 2023-2028 ($ million)
      • Chart on Electrical and electronics - Year-over-year growth 2023-2028 (%)
      • Data Table on Electrical and electronics - Year-over-year growth 2023-2028 (%)
    • 7.6 Others - Market size and forecast 2023-2028
      • Chart on Others - Market size and forecast 2023-2028 ($ million)
      • Data Table on Others - Market size and forecast 2023-2028 ($ million)
      • Chart on Others - Year-over-year growth 2023-2028 (%)
      • Data Table on Others - Year-over-year growth 2023-2028 (%)
    • 7.7 Market opportunity by End-user
      • Market opportunity by End-user ($ million)
      • Data Table on Market opportunity by End-user ($ million)

    8 Market Segmentation by Raw Material

    • 8.1 Market segments
      • Chart on Raw Material - Market share (2023-2028) (%)
      • Data Table on Raw Material - Market share (2023-2028) (%)
    • 8.2 Comparison by Raw Material
      • Chart on Comparison by Raw Material
      • Data Table on Comparison by Raw Material
    • 8.3 Wood - Market size and forecast (2023-2028)
      • Chart on Wood - Market size and forecast (2023-2028) ($ million)
      • Data Table on Wood - Market size and forecast (2023-2028) ($ million)
      • Chart on Wood - Year-over-year growth (2023-2028) (%)
      • Data Table on Wood - Year-over-year growth (2023-2028) (%)
    • 8.4 Cotton - Market size and forecast (2023-2028)
      • Chart on Cotton - Market size and forecast (2023-2028) ($ million)
      • Data Table on Cotton - Market size and forecast (2023-2028) ($ million)
      • Chart on Cotton - Year-over-year growth (2023-2028) (%)
      • Data Table on Cotton - Year-over-year growth (2023-2028) (%)
    • 8.5 Flax - Market size and forecast (2023-2028)
      • Chart on Flax - Market size and forecast (2023-2028) ($ million)
      • Data Table on Flax - Market size and forecast (2023-2028) ($ million)
      • Chart on Flax - Year-over-year growth (2023-2028) (%)
      • Data Table on Flax - Year-over-year growth (2023-2028) (%)
    • 8.6 Kenaf - Market size and forecast (2023-2028)
      • Chart on Kenaf - Market size and forecast (2023-2028) ($ million)
      • Data Table on Kenaf - Market size and forecast (2023-2028) ($ million)
      • Chart on Kenaf - Year-over-year growth (2023-2028) (%)
      • Data Table on Kenaf - Year-over-year growth (2023-2028) (%)
    • 8.7 Hemp - Market size and forecast (2023-2028)
      • Chart on Hemp - Market size and forecast (2023-2028) ($ million)
      • Data Table on Hemp - Market size and forecast (2023-2028) ($ million)
      • Chart on Hemp - Year-over-year growth (2023-2028) (%)
      • Data Table on Hemp - Year-over-year growth (2023-2028) (%)
    • 8.8 Others - Market size and forecast (2023-2028)
      • Chart on Others - Market size and forecast (2023-2028) ($ million)
      • Data Table on Others - Market size and forecast (2023-2028) ($ million)
      • Chart on Others - Year-over-year growth (2023-2028) (%)
      • Data Table on Others - Year-over-year growth (2023-2028) (%)
    • 8.9 Market opportunity by Raw Material
      • Market opportunity by $segment_name ($ million)
      • Data Table on Market opportunity by $segment_name ($ million)

    9 Market Segmentation by Matrix

    • 9.1 Market segments
      • Chart on Matrix - Market share (2023-2028) (%)
      • Data Table on Matrix - Market share (2023-2028) (%)
    • 9.2 Comparison by Matrix
      • Chart on Comparison by Matrix
      • Data Table on Comparison by Matrix
    • 9.3 Inorganic Compound - Market size and forecast (2023-2028)
      • Chart on Inorganic Compound - Market size and forecast (2023-2028) ($ million)
      • Data Table on Inorganic Compound - Market size and forecast (2023-2028) ($ million)
      • Chart on Inorganic Compound - Year-over-year growth (2023-2028) (%)
      • Data Table on Inorganic Compound - Year-over-year growth (2023-2028) (%)
    • 9.4 Natural Polymer - Market size and forecast (2023-2028)
      • Chart on Natural Polymer - Market size and forecast (2023-2028) ($ million)
      • Data Table on Natural Polymer - Market size and forecast (2023-2028) ($ million)
      • Chart on Natural Polymer - Year-over-year growth (2023-2028) (%)
      • Data Table on Natural Polymer - Year-over-year growth (2023-2028) (%)
    • 9.5 Synthetic Polymer - Market size and forecast (2023-2028)
      • Chart on Synthetic Polymer - Market size and forecast (2023-2028) ($ million)
      • Data Table on Synthetic Polymer - Market size and forecast (2023-2028) ($ million)
      • Chart on Synthetic Polymer - Year-over-year growth (2023-2028) (%)
      • Data Table on Synthetic Polymer - Year-over-year growth (2023-2028) (%)
    • 9.6 Market opportunity by Matrix
      • Market opportunity by $segment_name ($ million)
      • Data Table on Market opportunity by $segment_name ($ million)

    10 Market Segmentation by Technology

    • 10.1 Market segments
      • Chart on Technology - Market share (2023-2028) (%)
      • Data Table on Technology - Market share (2023-2028) (%)
    • 10.2 Comparison by Technology
      • Chart on Comparison by Technology
      • Data Table on Comparison by Technology
    • 10.3 Injection Molding - Market size and forecast (2023-2028)
      • Chart on Injection Molding - Market size and forecast (2023-2028) ($ million)
      • Data Table on Injection Molding - Market size and forecast (2023-2028) ($ million)
      • Chart on Injection Molding - Year-over-year growth (2023-2028) (%)
      • Data Table on Injection Molding - Year-over-year growth (2023-2028) (%)
    • 10.4 Compression Molding - Market size and forecast (2023-2028)
      • Chart on Compression Molding - Market size and forecast (2023-2028) ($ million)
      • Data Table on Compression Molding - Market size and forecast (2023-2028) ($ million)
      • Chart on Compression Molding - Year-over-year growth (2023-2028) (%)
      • Data Table on Compression Molding - Year-over-year growth (2023-2028) (%)
    • 10.5 Pultrusion - Market size and forecast (2023-2028)
      • Chart on Pultrusion - Market size and forecast (2023-2028) ($ million)
      • Data Table on Pultrusion - Market size and forecast (2023-2028) ($ million)
      • Chart on Pultrusion - Year-over-year growth (2023-2028) (%)
      • Data Table on Pultrusion - Year-over-year growth (2023-2028) (%)
    • 10.6 Others - Market size and forecast (2023-2028)
      • Chart on Others - Market size and forecast (2023-2028) ($ million)
      • Data Table on Others - Market size and forecast (2023-2028) ($ million)
      • Chart on Others - Year-over-year growth (2023-2028) (%)
      • Data Table on Others - Year-over-year growth (2023-2028) (%)
    • 10.7 Market opportunity by Technology
      • Market opportunity by $segment_name ($ million)
      • Data Table on Market opportunity by $segment_name ($ million)

    11 Customer Landscape

    • 11.1 Customer landscape overview
      • Analysis of price sensitivity, lifecycle, customer purchase basket, adoption rates, and purchase criteria

    12 Geographic Landscape

    • 12.1 Geographic segmentation
      • Chart on Market share by geography 2023-2028 (%)
      • Data Table on Market share by geography 2023-2028 (%)
    • 12.2 Geographic comparison
      • Chart on Geographic comparison
      • Data Table on Geographic comparison
    • 12.3 North America - Market size and forecast 2023-2028
      • Chart on North America - Market size and forecast 2023-2028 ($ million)
      • Data Table on North America - Market size and forecast 2023-2028 ($ million)
      • Chart on North America - Year-over-year growth 2023-2028 (%)
      • Data Table on North America - Year-over-year growth 2023-2028 (%)
    • 12.4 APAC - Market size and forecast 2023-2028
      • Chart on APAC - Market size and forecast 2023-2028 ($ million)
      • Data Table on APAC - Market size and forecast 2023-2028 ($ million)
      • Chart on APAC - Year-over-year growth 2023-2028 (%)
      • Data Table on APAC - Year-over-year growth 2023-2028 (%)
    • 12.5 Europe - Market size and forecast 2023-2028
      • Chart on Europe - Market size and forecast 2023-2028 ($ million)
      • Data Table on Europe - Market size and forecast 2023-2028 ($ million)
      • Chart on Europe - Year-over-year growth 2023-2028 (%)
      • Data Table on Europe - Year-over-year growth 2023-2028 (%)
    • 12.6 South America - Market size and forecast 2023-2028
      • Chart on South America - Market size and forecast 2023-2028 ($ million)
      • Data Table on South America - Market size and forecast 2023-2028 ($ million)
      • Chart on South America - Year-over-year growth 2023-2028 (%)
      • Data Table on South America - Year-over-year growth 2023-2028 (%)
    • 12.7 Middle East and Africa - Market size and forecast 2023-2028
      • Chart on Middle East and Africa - Market size and forecast 2023-2028 ($ million)
      • Data Table on Middle East and Africa - Market size and forecast 2023-2028 ($ million)
      • Chart on Middle East and Africa - Year-over-year growth 2023-2028 (%)
      • Data Table on Middle East and Africa - Year-over-year growth 2023-2028 (%)
    • 12.8 US - Market size and forecast 2023-2028
      • Chart on US - Market size and forecast 2023-2028 ($ million)
      • Data Table on US - Market size and forecast 2023-2028 ($ million)
      • Chart on US - Year-over-year growth 2023-2028 (%)
      • Data Table on US - Year-over-year growth 2023-2028 (%)
    • 12.9 China - Market size and forecast 2023-2028
      • Chart on China - Market size and forecast 2023-2028 ($ million)
      • Data Table on China - Market size and forecast 2023-2028 ($ million)
      • Chart on China - Year-over-year growth 2023-2028 (%)
      • Data Table on China - Year-over-year growth 2023-2028 (%)
    • 12.10 Canada - Market size and forecast 2023-2028
      • Chart on Canada - Market size and forecast 2023-2028 ($ million)
      • Data Table on Canada - Market size and forecast 2023-2028 ($ million)
      • Chart on Canada - Year-over-year growth 2023-2028 (%)
      • Data Table on Canada - Year-over-year growth 2023-2028 (%)
    • 12.11 Germany - Market size and forecast 2023-2028
      • Chart on Germany - Market size and forecast 2023-2028 ($ million)
      • Data Table on Germany - Market size and forecast 2023-2028 ($ million)
      • Chart on Germany - Year-over-year growth 2023-2028 (%)
      • Data Table on Germany - Year-over-year growth 2023-2028 (%)
    • 12.12 France - Market size and forecast 2023-2028
      • Chart on France - Market size and forecast 2023-2028 ($ million)
      • Data Table on France - Market size and forecast 2023-2028 ($ million)
      • Chart on France - Year-over-year growth 2023-2028 (%)
      • Data Table on France - Year-over-year growth 2023-2028 (%)
    • 12.13 Market opportunity by geography
      • Market opportunity by geography ($ million)
      • Data Tables on Market opportunity by geography ($ million)

    13 Drivers, Challenges, and Opportunity/Restraints

    • 13.1 Market drivers
      • 13.2 Market challenges
        • 13.3 Impact of drivers and challenges
          • Impact of drivers and challenges in 2023 and 2028
        • 13.4 Market opportunities/restraints

          14 Competitive Landscape

          • 14.1 Overview
            • 14.2 Competitive Landscape
              • Overview on criticality of inputs and factors of differentiation
            • 14.3 Landscape disruption
              • Overview on factors of disruption
            • 14.4 Industry risks
              • Impact of key risks on business

            15 Competitive Analysis

            • 15.1 Companies profiled
              • Companies covered
            • 15.2 Market positioning of companies
              • Matrix on companies position and classification
            • 15.3 Avient Corp.
              • Avient Corp. - Overview
              • Avient Corp. - Business segments
              • Avient Corp. - Key news
              • Avient Corp. - Key offerings
              • Avient Corp. - Segment focus
            • 15.4 DuPont de Nemours Inc.
              • DuPont de Nemours Inc. - Overview
              • DuPont de Nemours Inc. - Business segments
              • DuPont de Nemours Inc. - Key news
              • DuPont de Nemours Inc. - Key offerings
              • DuPont de Nemours Inc. - Segment focus
            • 15.5 FlexForm Technologies
              • FlexForm Technologies - Overview
              • FlexForm Technologies - Product / Service
              • FlexForm Technologies - Key offerings
            • 15.6 JELU WERK J. Ehrler GmbH and Co. KG
              • JELU WERK J. Ehrler GmbH and Co. KG - Overview
              • JELU WERK J. Ehrler GmbH and Co. KG - Product / Service
              • JELU WERK J. Ehrler GmbH and Co. KG - Key offerings
            • 15.7 Polyvlies Franz Beyer GmbH
              • Polyvlies Franz Beyer GmbH - Overview
              • Polyvlies Franz Beyer GmbH - Product / Service
              • Polyvlies Franz Beyer GmbH - Key offerings
            • 15.8 TECNARO GmbH
              • TECNARO GmbH - Overview
              • TECNARO GmbH - Product / Service
              • TECNARO GmbH - Key offerings
            • 15.9 Teijin Ltd.
              • Teijin Ltd. - Overview
              • Teijin Ltd. - Business segments
              • Teijin Ltd. - Key news
              • Teijin Ltd. - Key offerings
              • Teijin Ltd. - Segment focus
            • 15.10 Trex Co. Inc.
              • Trex Co. Inc. - Overview
              • Trex Co. Inc. - Business segments
              • Trex Co. Inc. - Key offerings
              • Trex Co. Inc. - Segment focus
            • 15.11 UPM Kymmene Corp.
              • UPM Kymmene Corp. - Overview
              • UPM Kymmene Corp. - Business segments
              • UPM Kymmene Corp. - Key offerings
              • UPM Kymmene Corp. - Segment focus
            • 15.12 Weyerhaeuser Co.
              • Weyerhaeuser Co. - Overview
              • Weyerhaeuser Co. - Business segments
              • Weyerhaeuser Co. - Key news
              • Weyerhaeuser Co. - Key offerings
              • Weyerhaeuser Co. - Segment focus

            16 Appendix

            • 16.1 Scope of the report
              • 16.2 Inclusions and exclusions checklist
                • Inclusions checklist
                • Exclusions checklist
              • 16.3 Currency conversion rates for US$
                • Currency conversion rates for US$
              • 16.4 Research methodology
                • Research methodology
              • 16.5 Data procurement
                • Information sources
              • 16.6 Data validation
                • Data validation
              • 16.7 Validation techniques employed for market sizing
                • Validation techniques employed for market sizing
              • 16.8 Data synthesis
                • Data synthesis
              • 16.9 360 degree market analysis
                • 360 degree market analysis
              • 16.10 List of abbreviations
                • List of abbreviations

              Research Methodology

              Technavio presents a detailed picture of the market by way of study, synthesis, and summation of data from multiple sources. The analysts have presented the various facets of the market with a particular focus on identifying the key industry influencers. The data thus presented is comprehensive, reliable, and the result of extensive research, both primary and secondary.

              INFORMATION SOURCES

              Primary sources

              • Manufacturers and suppliers
              • Channel partners
              • Industry experts
              • Strategic decision makers

              Secondary sources

              • Industry journals and periodicals
              • Government data
              • Financial reports of key industry players
              • Historical data
              • Press releases

              DATA ANALYSIS

              Data Synthesis

              • Collation of data
              • Estimation of key figures
              • Analysis of derived insights

              Data Validation

              • Triangulation with data models
              • Reference against proprietary databases
              • Corroboration with industry experts

              REPORT WRITING

              Qualitative

              • Market drivers
              • Market challenges
              • Market trends
              • Five forces analysis

              Quantitative

              • Market size and forecast
              • Market segmentation
              • Geographical insights
              • Competitive landscape

              Interested in this report?

              Get your sample now to see our research methodology and insights!

              Download Now

              Frequently Asked Questions

              Natural Fiber Composites market growth will increase by $ 1001 mn during 2024-2028 .

              The Natural Fiber Composites market is expected to grow at a CAGR of 3.3% during 2024-2028 .

              Natural Fiber Composites market is segmented by Type( Wood fiber, Non-wood fiber, Electrical and electronics, Others) End-user( Building and construction, Automotive, Electrical and electronics, Others, MEA)

              A.B.COMPOSITES Pvt. Ltd., Avient Corp., Bcomp Ltd., DuPont de Nemours Inc., FlexForm Technologies, GreenCore Composites Inc., GreenGran BN, JELU WERK J. Ehrler GmbH and Co. KG, Meshlin Composites Zrt., Owens Corning, Polyvlies Franz Beyer GmbH, PROCOTEX BELGIUM SA, TECNARO GmbH, Teijin Ltd., Toray Industries Inc., Trex Co. Inc., TTS Inc., UPM Kymmene Corp., Weyerhaeuser Co. are a few of the key vendors in the Natural Fiber Composites market.

              North America will register the highest growth rate of 51% among the other regions. Therefore, the Natural Fiber Composites market in North America is expected to garner significant business opportunities for the vendors during the forecast period.

              US, China, Canada, Germany, France

              • Regulations and demand for environment-friendly compositesCurrently is the driving factor this market.
              • the demand for fiber-reinforced (glass and carbon fibers) composites is quite high. These fiber-reinforced composites find applications in a number of end-use industries. However is the driving factor this market.
              • the challenge associated with these is that they are expensive and are not environment friendly. These fibers are non-renewable and non-recyclable. Glass fibers are commonly used in polymer matrix. Although the use of glass fibers is high in composites is the driving factor this market.
              • there are some problems associated with them. Around 70% of reinforced glass fiber is used to manufacture thermoset-based composites. Out of this is the driving factor this market.
              • 15% is manufacturing waste is the driving factor this market.
              • which is difficult to recycle. One of the critical challenges of using glass-reinforced polymer composites recycling technology is that recycled glass fiber performance drops by 80%-90% in comparison to the original glass fiber. Recycled glass fiber is not suitable for reprocessing and reusing as a reinforcement for composites.Many EU and Asian countries have introduced regulations for the automotive industry. According to EU legislation passed in 2006 is the driving factor this market.
              • 80% of vehicles should be reused or recycled is the driving factor this market.
              • and in 2015 is the driving factor this market.
              • this percentage rose to 85%. In Japan is the driving factor this market.
              • according to a 2015 regulation is the driving factor this market.
              • 95% of vehicles should be reused or recycled. Glass fiber composites have drawbacks such as high fiber density is the driving factor this market.
              • poor recyclability is the driving factor this market.
              • and handling hazards. These drawbacks of glass fiber composites increase the demand for NFCs. The key advantage of using NFCs is that they are environmentally friendly. A large percentage of CO2 emissions and crude oil can be avoided if the glass fiber composites are replaced with NFCs in the automotive industry. Thus is the driving factor this market.
              • such environment-related regulations and rising demand for environment-friendly composites will spur the growth of the global natural fiber composites market during the forecast period. is the driving factor this market.

              The Natural Fiber Composites market vendors should focus on grabbing business opportunities from the Wood fiber segment as it accounted for the largest market share in the base year.